This pipeline computes the correlation between significant arm-level copy number variations (cnvs) and subtypes.
Testing the association between copy number variation 65 arm-level results and 2 molecular subtypes across 50 patients, 2 significant findings detected with Q value < 0.25.
-
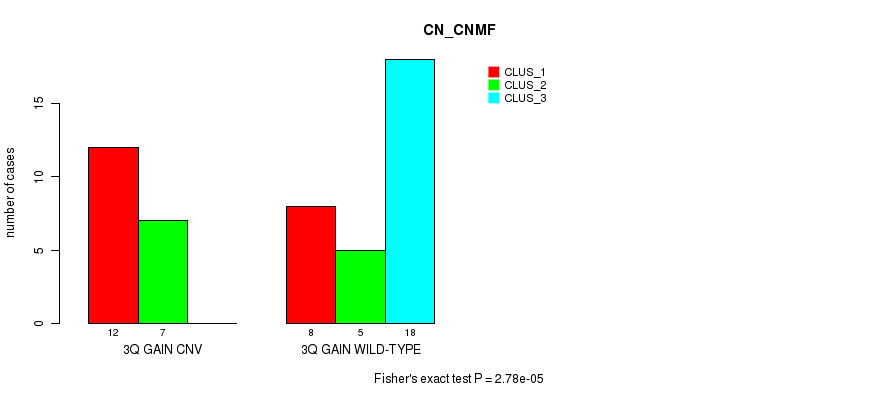
3q gain cnv correlated to 'CN_CNMF'.
-
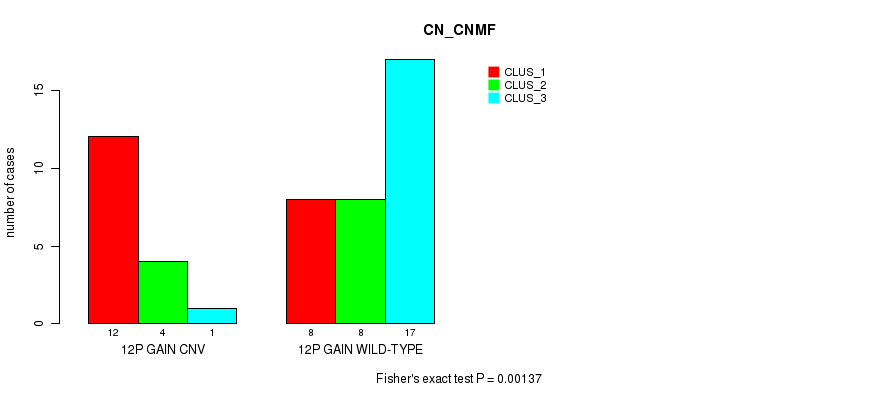
12p gain cnv correlated to 'CN_CNMF'.
Table 1. Get Full Table Overview of the association between significant copy number variation of 65 arm-level results and 2 molecular subtypes. Shown in the table are P values (Q values). Thresholded by Q value < 0.25, 2 significant findings detected.
|
Molecular subtypes |
CN CNMF |
METHLYATION CNMF |
||
| nCNV (%) | nWild-Type | Fisher's exact test | Fisher's exact test | |
| 3q gain | 0 (0%) | 31 |
2.78e-05 (0.00361) |
0.00322 (0.406) |
| 12p gain | 0 (0%) | 33 |
0.00137 (0.177) |
0.0095 (1.00) |
| 1p gain | 0 (0%) | 47 |
0.449 (1.00) |
0.597 (1.00) |
| 1q gain | 0 (0%) | 38 |
0.0666 (1.00) |
1 (1.00) |
| 2p gain | 0 (0%) | 39 |
0.00591 (0.727) |
0.201 (1.00) |
| 2q gain | 0 (0%) | 43 |
0.0217 (1.00) |
0.0989 (1.00) |
| 3p gain | 0 (0%) | 44 |
0.0677 (1.00) |
0.29 (1.00) |
| 4p gain | 0 (0%) | 47 |
0.449 (1.00) |
0.794 (1.00) |
| 5p gain | 0 (0%) | 37 |
0.461 (1.00) |
0.317 (1.00) |
| 6p gain | 0 (0%) | 47 |
0.239 (1.00) |
1 (1.00) |
| 7p gain | 0 (0%) | 26 |
0.0835 (1.00) |
0.188 (1.00) |
| 7q gain | 0 (0%) | 35 |
0.241 (1.00) |
0.528 (1.00) |
| 8p gain | 0 (0%) | 35 |
0.241 (1.00) |
0.178 (1.00) |
| 8q gain | 0 (0%) | 26 |
0.552 (1.00) |
0.36 (1.00) |
| 9p gain | 0 (0%) | 47 |
0.239 (1.00) |
0.317 (1.00) |
| 9q gain | 0 (0%) | 44 |
0.213 (1.00) |
0.743 (1.00) |
| 10p gain | 0 (0%) | 44 |
0.868 (1.00) |
0.527 (1.00) |
| 10q gain | 0 (0%) | 47 |
0.0112 (1.00) |
1 (1.00) |
| 12q gain | 0 (0%) | 45 |
0.191 (1.00) |
0.289 (1.00) |
| 13q gain | 0 (0%) | 44 |
0.00312 (0.396) |
0.00365 (0.457) |
| 14q gain | 0 (0%) | 42 |
0.628 (1.00) |
0.167 (1.00) |
| 16p gain | 0 (0%) | 47 |
1 (1.00) |
0.317 (1.00) |
| 17p gain | 0 (0%) | 43 |
0.39 (1.00) |
0.08 (1.00) |
| 17q gain | 0 (0%) | 43 |
1 (1.00) |
0.575 (1.00) |
| 18p gain | 0 (0%) | 39 |
0.152 (1.00) |
0.333 (1.00) |
| 18q gain | 0 (0%) | 47 |
0.78 (1.00) |
1 (1.00) |
| 19q gain | 0 (0%) | 43 |
0.017 (1.00) |
0.242 (1.00) |
| 20p gain | 0 (0%) | 31 |
0.935 (1.00) |
0.526 (1.00) |
| 20q gain | 0 (0%) | 27 |
0.419 (1.00) |
0.439 (1.00) |
| 21q gain | 0 (0%) | 47 |
0.239 (1.00) |
0.597 (1.00) |
| 22q gain | 0 (0%) | 43 |
0.885 (1.00) |
0.575 (1.00) |
| Xq gain | 0 (0%) | 42 |
0.886 (1.00) |
0.107 (1.00) |
| 3p loss | 0 (0%) | 30 |
0.661 (1.00) |
0.394 (1.00) |
| 3q loss | 0 (0%) | 47 |
0.449 (1.00) |
0.794 (1.00) |
| 4p loss | 0 (0%) | 32 |
0.0961 (1.00) |
0.0505 (1.00) |
| 4q loss | 0 (0%) | 36 |
0.115 (1.00) |
0.0211 (1.00) |
| 5p loss | 0 (0%) | 42 |
0.628 (1.00) |
0.246 (1.00) |
| 5q loss | 0 (0%) | 36 |
0.149 (1.00) |
0.0257 (1.00) |
| 6p loss | 0 (0%) | 42 |
0.886 (1.00) |
0.363 (1.00) |
| 6q loss | 0 (0%) | 47 |
0.78 (1.00) |
0.597 (1.00) |
| 7p loss | 0 (0%) | 47 |
0.449 (1.00) |
0.597 (1.00) |
| 8p loss | 0 (0%) | 40 |
0.739 (1.00) |
0.656 (1.00) |
| 8q loss | 0 (0%) | 46 |
0.159 (1.00) |
0.0388 (1.00) |
| 9p loss | 0 (0%) | 31 |
0.213 (1.00) |
0.236 (1.00) |
| 9q loss | 0 (0%) | 42 |
0.101 (1.00) |
0.167 (1.00) |
| 10p loss | 0 (0%) | 41 |
1 (1.00) |
0.573 (1.00) |
| 10q loss | 0 (0%) | 39 |
0.0614 (1.00) |
0.0237 (1.00) |
| 11p loss | 0 (0%) | 39 |
0.192 (1.00) |
0.0681 (1.00) |
| 11q loss | 0 (0%) | 36 |
0.00297 (0.38) |
0.0338 (1.00) |
| 12p loss | 0 (0%) | 43 |
0.773 (1.00) |
0.504 (1.00) |
| 12q loss | 0 (0%) | 45 |
0.613 (1.00) |
0.228 (1.00) |
| 13q loss | 0 (0%) | 36 |
0.0193 (1.00) |
0.0281 (1.00) |
| 14q loss | 0 (0%) | 44 |
1 (1.00) |
0.861 (1.00) |
| 15q loss | 0 (0%) | 41 |
0.804 (1.00) |
0.514 (1.00) |
| 16p loss | 0 (0%) | 42 |
0.0854 (1.00) |
0.0908 (1.00) |
| 16q loss | 0 (0%) | 41 |
0.00604 (0.737) |
0.408 (1.00) |
| 17p loss | 0 (0%) | 40 |
0.664 (1.00) |
0.00558 (0.692) |
| 18p loss | 0 (0%) | 40 |
0.228 (1.00) |
0.192 (1.00) |
| 18q loss | 0 (0%) | 34 |
0.861 (1.00) |
0.123 (1.00) |
| 19p loss | 0 (0%) | 46 |
1 (1.00) |
0.562 (1.00) |
| 19q loss | 0 (0%) | 47 |
0.78 (1.00) |
0.794 (1.00) |
| 20p loss | 0 (0%) | 45 |
0.719 (1.00) |
1 (1.00) |
| 21q loss | 0 (0%) | 27 |
1 (1.00) |
0.128 (1.00) |
| 22q loss | 0 (0%) | 44 |
0.545 (1.00) |
0.0636 (1.00) |
| Xq loss | 0 (0%) | 47 |
1 (1.00) |
0.428 (1.00) |
P value = 2.78e-05 (Fisher's exact test), Q value = 0.0036
Table S1. Gene #6: '3q gain' versus Molecular Subtype #1: 'CN_CNMF'
| nPatients | CLUS_1 | CLUS_2 | CLUS_3 |
|---|---|---|---|
| ALL | 20 | 12 | 18 |
| 3Q GAIN CNV | 12 | 7 | 0 |
| 3Q GAIN WILD-TYPE | 8 | 5 | 18 |
Figure S1. Get High-res Image Gene #6: '3q gain' versus Molecular Subtype #1: 'CN_CNMF'
P value = 0.00137 (Fisher's exact test), Q value = 0.18
Table S2. Gene #18: '12p gain' versus Molecular Subtype #1: 'CN_CNMF'
| nPatients | CLUS_1 | CLUS_2 | CLUS_3 |
|---|---|---|---|
| ALL | 20 | 12 | 18 |
| 12P GAIN CNV | 12 | 4 | 1 |
| 12P GAIN WILD-TYPE | 8 | 8 | 17 |
Figure S2. Get High-res Image Gene #18: '12p gain' versus Molecular Subtype #1: 'CN_CNMF'
-
Mutation data file = broad_values_by_arm.mutsig.cluster.txt
-
Molecular subtypes file = ESCA-TP.transferedmergedcluster.txt
-
Number of patients = 50
-
Number of significantly arm-level cnvs = 65
-
Number of molecular subtypes = 2
-
Exclude genes that fewer than K tumors have mutations, K = 3
For binary or multi-class clinical features (nominal or ordinal), two-tailed Fisher's exact tests (Fisher 1922) were used to estimate the P values using the 'fisher.test' function in R
For multiple hypothesis correction, Q value is the False Discovery Rate (FDR) analogue of the P value (Benjamini and Hochberg 1995), defined as the minimum FDR at which the test may be called significant. We used the 'Benjamini and Hochberg' method of 'p.adjust' function in R to convert P values into Q values.
This is an experimental feature. The full results of the analysis summarized in this report can be downloaded from the TCGA Data Coordination Center.