This pipeline computes the correlation between significant arm-level copy number variations (cnvs) and selected clinical features.
Testing the association between copy number variation 79 arm-level results and 6 clinical features across 552 patients, 10 significant findings detected with Q value < 0.25.
-
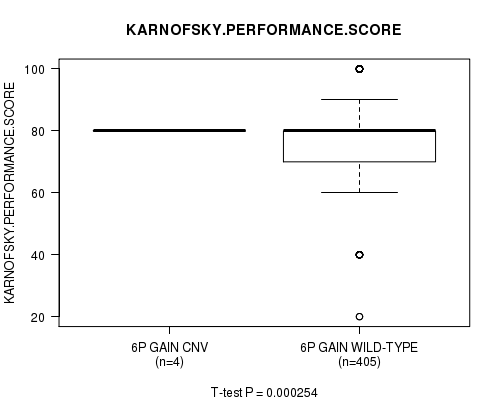
6p gain cnv correlated to 'KARNOFSKY.PERFORMANCE.SCORE'.
-
6q gain cnv correlated to 'KARNOFSKY.PERFORMANCE.SCORE'.
-
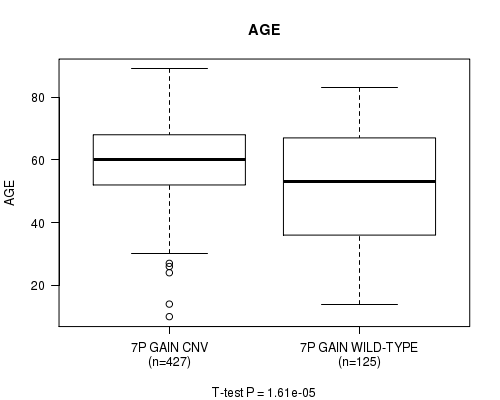
7p gain cnv correlated to 'AGE'.
-
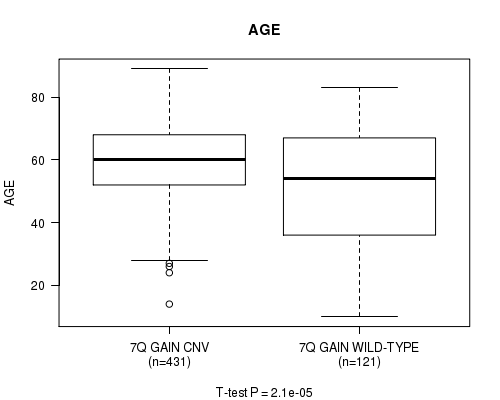
7q gain cnv correlated to 'AGE'.
-
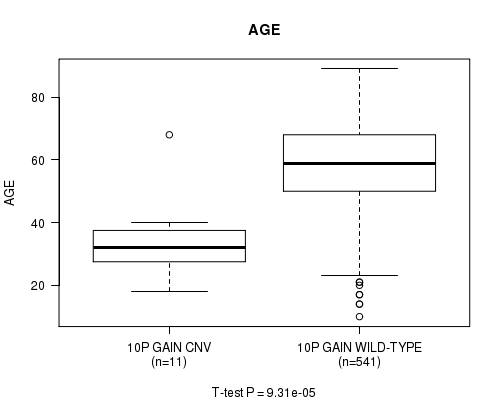
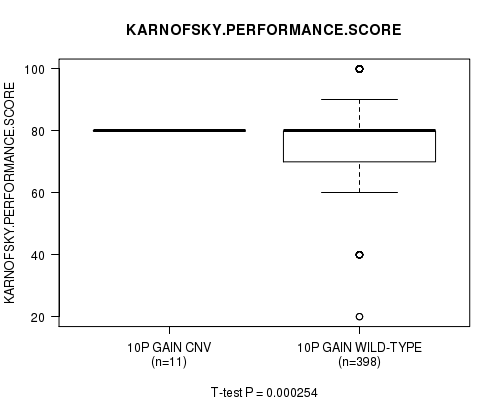
10p gain cnv correlated to 'AGE' and 'KARNOFSKY.PERFORMANCE.SCORE'.
-
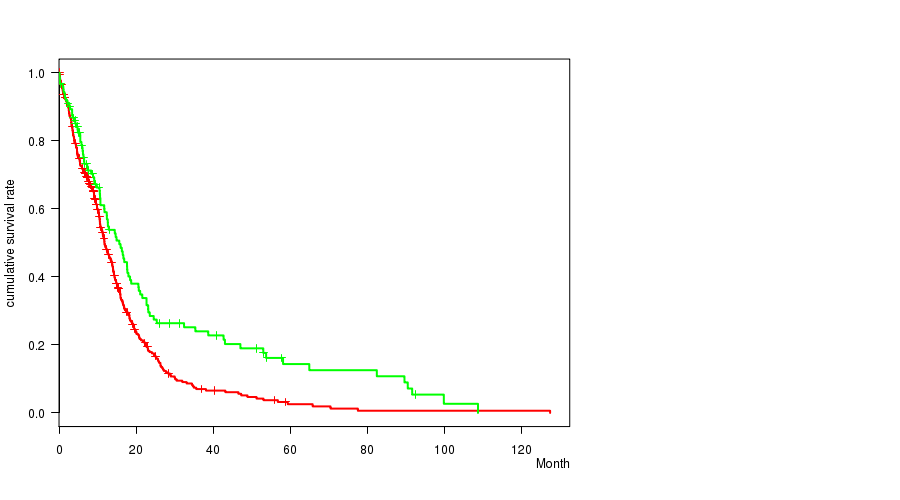
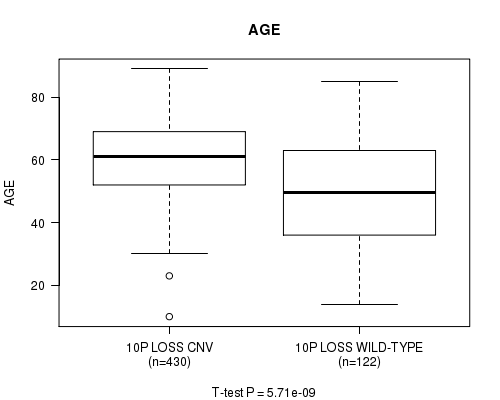
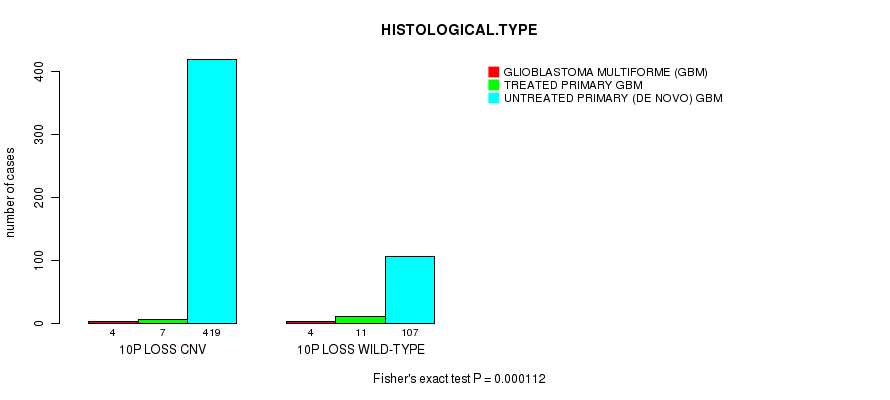
10p loss cnv correlated to 'Time to Death', 'AGE', and 'HISTOLOGICAL.TYPE'.
-
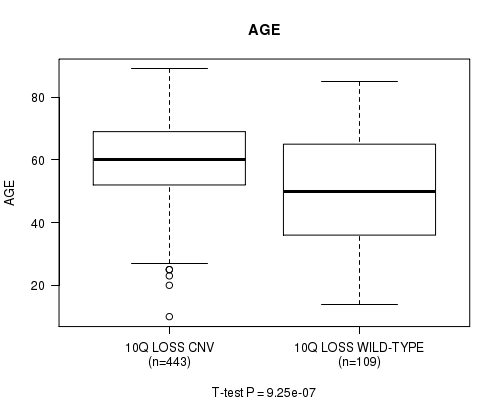
10q loss cnv correlated to 'AGE'.
Table 1. Get Full Table Overview of the association between significant copy number variation of 79 arm-level results and 6 clinical features. Shown in the table are P values (Q values). Thresholded by Q value < 0.25, 10 significant findings detected.
|
Clinical Features |
Time to Death |
AGE | GENDER |
KARNOFSKY PERFORMANCE SCORE |
HISTOLOGICAL TYPE |
RADIATIONS RADIATION REGIMENINDICATION |
||
| nCNV (%) | nWild-Type | logrank test | t-test | Fisher's exact test | t-test | Fisher's exact test | Fisher's exact test | |
| 10p loss | 0 (0%) | 122 |
0.000393 (0.182) |
5.71e-09 (2.69e-06) |
0.345 (1.00) |
0.358 (1.00) |
0.000112 (0.0521) |
0.74 (1.00) |
| 10p gain | 0 (0%) | 541 |
0.0028 (1.00) |
9.31e-05 (0.0435) |
0.0295 (1.00) |
0.000254 (0.118) |
0.415 (1.00) |
1 (1.00) |
| 6p gain | 0 (0%) | 545 |
0.0981 (1.00) |
0.0975 (1.00) |
1 (1.00) |
0.000254 (0.118) |
1 (1.00) |
0.445 (1.00) |
| 6q gain | 0 (0%) | 543 |
0.131 (1.00) |
0.0441 (1.00) |
0.744 (1.00) |
0.000254 (0.118) |
1 (1.00) |
0.728 (1.00) |
| 7p gain | 0 (0%) | 125 |
0.00987 (1.00) |
1.61e-05 (0.00754) |
0.917 (1.00) |
0.53 (1.00) |
0.0426 (1.00) |
0.227 (1.00) |
| 7q gain | 0 (0%) | 121 |
0.0122 (1.00) |
2.1e-05 (0.00981) |
0.528 (1.00) |
0.584 (1.00) |
0.0265 (1.00) |
0.266 (1.00) |
| 10q loss | 0 (0%) | 109 |
0.00169 (0.776) |
9.25e-07 (0.000435) |
0.514 (1.00) |
0.0968 (1.00) |
0.00302 (1.00) |
1 (1.00) |
| 1p gain | 0 (0%) | 514 |
0.626 (1.00) |
0.593 (1.00) |
0.607 (1.00) |
0.868 (1.00) |
1 (1.00) |
0.589 (1.00) |
| 1q gain | 0 (0%) | 509 |
0.964 (1.00) |
0.483 (1.00) |
1 (1.00) |
0.979 (1.00) |
0.816 (1.00) |
0.733 (1.00) |
| 2p gain | 0 (0%) | 533 |
0.385 (1.00) |
0.112 (1.00) |
0.101 (1.00) |
0.301 (1.00) |
0.144 (1.00) |
0.452 (1.00) |
| 2q gain | 0 (0%) | 535 |
0.522 (1.00) |
0.318 (1.00) |
0.314 (1.00) |
0.737 (1.00) |
0.119 (1.00) |
0.293 (1.00) |
| 3p gain | 0 (0%) | 522 |
0.118 (1.00) |
0.552 (1.00) |
1 (1.00) |
0.837 (1.00) |
1 (1.00) |
0.421 (1.00) |
| 3q gain | 0 (0%) | 522 |
0.12 (1.00) |
0.456 (1.00) |
1 (1.00) |
0.892 (1.00) |
1 (1.00) |
0.421 (1.00) |
| 4p gain | 0 (0%) | 537 |
0.0784 (1.00) |
0.0675 (1.00) |
0.791 (1.00) |
0.127 (1.00) |
0.52 (1.00) |
0.0457 (1.00) |
| 4q gain | 0 (0%) | 538 |
0.03 (1.00) |
0.334 (1.00) |
0.789 (1.00) |
0.146 (1.00) |
0.495 (1.00) |
0.00709 (1.00) |
| 5p gain | 0 (0%) | 523 |
0.681 (1.00) |
0.124 (1.00) |
0.563 (1.00) |
0.0435 (1.00) |
0.0132 (1.00) |
0.147 (1.00) |
| 5q gain | 0 (0%) | 530 |
0.491 (1.00) |
0.883 (1.00) |
0.374 (1.00) |
0.301 (1.00) |
0.0172 (1.00) |
0.242 (1.00) |
| 8p gain | 0 (0%) | 526 |
0.779 (1.00) |
0.536 (1.00) |
0.539 (1.00) |
0.402 (1.00) |
0.35 (1.00) |
0.392 (1.00) |
| 8q gain | 0 (0%) | 521 |
0.82 (1.00) |
0.197 (1.00) |
0.345 (1.00) |
0.389 (1.00) |
1 (1.00) |
0.555 (1.00) |
| 9p gain | 0 (0%) | 535 |
0.237 (1.00) |
0.0366 (1.00) |
0.314 (1.00) |
0.00622 (1.00) |
1 (1.00) |
0.603 (1.00) |
| 9q gain | 0 (0%) | 520 |
0.0326 (1.00) |
0.0457 (1.00) |
0.0612 (1.00) |
0.0256 (1.00) |
0.559 (1.00) |
0.326 (1.00) |
| 11p gain | 0 (0%) | 548 |
0.559 (1.00) |
0.38 (1.00) |
0.649 (1.00) |
0.841 (1.00) |
1 (1.00) |
1 (1.00) |
| 11q gain | 0 (0%) | 545 |
0.147 (1.00) |
0.207 (1.00) |
0.254 (1.00) |
0.0913 (1.00) |
0.288 (1.00) |
0.445 (1.00) |
| 12p gain | 0 (0%) | 511 |
0.707 (1.00) |
0.0935 (1.00) |
0.868 (1.00) |
0.93 (1.00) |
0.542 (1.00) |
0.603 (1.00) |
| 12q gain | 0 (0%) | 521 |
0.77 (1.00) |
0.448 (1.00) |
0.345 (1.00) |
0.554 (1.00) |
0.303 (1.00) |
0.424 (1.00) |
| 13q gain | 0 (0%) | 549 |
0.986 (1.00) |
0.105 (1.00) |
0.0611 (1.00) |
1 (1.00) |
0.0294 (1.00) |
|
| 14q gain | 0 (0%) | 545 |
0.542 (1.00) |
0.807 (1.00) |
0.443 (1.00) |
0.514 (1.00) |
0.0219 (1.00) |
0.682 (1.00) |
| 15q gain | 0 (0%) | 546 |
0.974 (1.00) |
0.0837 (1.00) |
0.685 (1.00) |
0.292 (1.00) |
0.0974 (1.00) |
0.38 (1.00) |
| 16p gain | 0 (0%) | 535 |
0.0426 (1.00) |
0.0235 (1.00) |
0.13 (1.00) |
0.71 (1.00) |
0.565 (1.00) |
0.0294 (1.00) |
| 16q gain | 0 (0%) | 535 |
0.0435 (1.00) |
0.0653 (1.00) |
0.0421 (1.00) |
0.971 (1.00) |
0.565 (1.00) |
0.109 (1.00) |
| 17p gain | 0 (0%) | 541 |
0.201 (1.00) |
0.325 (1.00) |
1 (1.00) |
0.0913 (1.00) |
0.19 (1.00) |
0.745 (1.00) |
| 17q gain | 0 (0%) | 533 |
0.157 (1.00) |
0.409 (1.00) |
0.815 (1.00) |
0.0318 (1.00) |
0.144 (1.00) |
1 (1.00) |
| 18p gain | 0 (0%) | 526 |
0.872 (1.00) |
0.948 (1.00) |
1 (1.00) |
0.0964 (1.00) |
1 (1.00) |
0.669 (1.00) |
| 18q gain | 0 (0%) | 524 |
0.8 (1.00) |
0.918 (1.00) |
0.697 (1.00) |
0.301 (1.00) |
0.747 (1.00) |
0.837 (1.00) |
| 19p gain | 0 (0%) | 380 |
0.126 (1.00) |
0.708 (1.00) |
0.925 (1.00) |
0.795 (1.00) |
0.425 (1.00) |
0.427 (1.00) |
| 19q gain | 0 (0%) | 403 |
0.0885 (1.00) |
0.445 (1.00) |
0.769 (1.00) |
0.773 (1.00) |
0.873 (1.00) |
0.836 (1.00) |
| 20p gain | 0 (0%) | 376 |
0.694 (1.00) |
0.00136 (0.629) |
0.642 (1.00) |
0.371 (1.00) |
0.783 (1.00) |
0.323 (1.00) |
| 20q gain | 0 (0%) | 378 |
0.485 (1.00) |
0.0026 (1.00) |
0.574 (1.00) |
0.406 (1.00) |
0.483 (1.00) |
0.276 (1.00) |
| 21q gain | 0 (0%) | 518 |
0.126 (1.00) |
0.874 (1.00) |
0.858 (1.00) |
0.634 (1.00) |
0.123 (1.00) |
1 (1.00) |
| 22q gain | 0 (0%) | 541 |
0.982 (1.00) |
0.384 (1.00) |
1 (1.00) |
0.968 (1.00) |
1 (1.00) |
0.516 (1.00) |
| Xq gain | 0 (0%) | 549 |
0.133 (1.00) |
0.59 (1.00) |
1 (1.00) |
0.135 (1.00) |
1 (1.00) |
|
| 1p loss | 0 (0%) | 547 |
0.0304 (1.00) |
0.717 (1.00) |
0.653 (1.00) |
0.868 (1.00) |
0.215 (1.00) |
1 (1.00) |
| 1q loss | 0 (0%) | 548 |
0.712 (1.00) |
0.0682 (1.00) |
0.649 (1.00) |
0.0873 (1.00) |
1 (1.00) |
1 (1.00) |
| 2p loss | 0 (0%) | 542 |
0.174 (1.00) |
0.507 (1.00) |
0.204 (1.00) |
0.76 (1.00) |
1 (1.00) |
1 (1.00) |
| 2q loss | 0 (0%) | 543 |
0.229 (1.00) |
0.733 (1.00) |
0.328 (1.00) |
0.76 (1.00) |
1 (1.00) |
0.728 (1.00) |
| 3p loss | 0 (0%) | 530 |
0.279 (1.00) |
0.0214 (1.00) |
1 (1.00) |
0.846 (1.00) |
0.661 (1.00) |
0.0313 (1.00) |
| 3q loss | 0 (0%) | 536 |
0.754 (1.00) |
0.225 (1.00) |
0.44 (1.00) |
0.708 (1.00) |
1 (1.00) |
0.412 (1.00) |
| 4p loss | 0 (0%) | 527 |
0.134 (1.00) |
0.286 (1.00) |
0.142 (1.00) |
0.825 (1.00) |
1 (1.00) |
0.122 (1.00) |
| 4q loss | 0 (0%) | 528 |
0.201 (1.00) |
0.22 (1.00) |
0.67 (1.00) |
0.167 (1.00) |
0.694 (1.00) |
0.654 (1.00) |
| 5p loss | 0 (0%) | 531 |
0.053 (1.00) |
0.268 (1.00) |
0.821 (1.00) |
0.503 (1.00) |
0.644 (1.00) |
0.0303 (1.00) |
| 5q loss | 0 (0%) | 532 |
0.0584 (1.00) |
0.286 (1.00) |
0.645 (1.00) |
0.786 (1.00) |
1 (1.00) |
0.143 (1.00) |
| 6p loss | 0 (0%) | 505 |
0.009 (1.00) |
0.729 (1.00) |
0.878 (1.00) |
0.711 (1.00) |
0.475 (1.00) |
0.87 (1.00) |
| 6q loss | 0 (0%) | 473 |
0.301 (1.00) |
0.616 (1.00) |
0.535 (1.00) |
0.581 (1.00) |
0.409 (1.00) |
0.793 (1.00) |
| 7p loss | 0 (0%) | 547 |
0.505 (1.00) |
0.654 (1.00) |
1 (1.00) |
0.61 (1.00) |
1 (1.00) |
1 (1.00) |
| 7q loss | 0 (0%) | 548 |
0.606 (1.00) |
0.36 (1.00) |
1 (1.00) |
1 (1.00) |
1 (1.00) |
|
| 8p loss | 0 (0%) | 518 |
0.945 (1.00) |
0.402 (1.00) |
0.209 (1.00) |
0.541 (1.00) |
1 (1.00) |
0.0354 (1.00) |
| 8q loss | 0 (0%) | 531 |
0.975 (1.00) |
0.414 (1.00) |
0.497 (1.00) |
0.133 (1.00) |
0.644 (1.00) |
0.00663 (1.00) |
| 9p loss | 0 (0%) | 391 |
0.665 (1.00) |
0.517 (1.00) |
0.848 (1.00) |
0.427 (1.00) |
0.159 (1.00) |
0.188 (1.00) |
| 9q loss | 0 (0%) | 489 |
0.369 (1.00) |
0.543 (1.00) |
0.0139 (1.00) |
0.384 (1.00) |
0.885 (1.00) |
0.385 (1.00) |
| 11p loss | 0 (0%) | 488 |
0.295 (1.00) |
0.208 (1.00) |
0.222 (1.00) |
0.89 (1.00) |
0.246 (1.00) |
0.389 (1.00) |
| 11q loss | 0 (0%) | 497 |
0.986 (1.00) |
0.783 (1.00) |
0.772 (1.00) |
0.934 (1.00) |
0.872 (1.00) |
0.0447 (1.00) |
| 12p loss | 0 (0%) | 514 |
0.655 (1.00) |
0.801 (1.00) |
0.864 (1.00) |
0.89 (1.00) |
0.507 (1.00) |
0.589 (1.00) |
| 12q loss | 0 (0%) | 517 |
0.64 (1.00) |
0.873 (1.00) |
0.859 (1.00) |
0.61 (1.00) |
0.47 (1.00) |
0.706 (1.00) |
| 13q loss | 0 (0%) | 416 |
0.895 (1.00) |
0.539 (1.00) |
0.545 (1.00) |
0.538 (1.00) |
0.448 (1.00) |
0.915 (1.00) |
| 14q loss | 0 (0%) | 432 |
0.959 (1.00) |
0.947 (1.00) |
0.752 (1.00) |
0.769 (1.00) |
0.393 (1.00) |
0.657 (1.00) |
| 15q loss | 0 (0%) | 490 |
0.458 (1.00) |
0.198 (1.00) |
0.132 (1.00) |
0.486 (1.00) |
0.272 (1.00) |
0.307 (1.00) |
| 16p loss | 0 (0%) | 529 |
0.161 (1.00) |
0.126 (1.00) |
0.514 (1.00) |
0.0929 (1.00) |
1 (1.00) |
1 (1.00) |
| 16q loss | 0 (0%) | 512 |
0.0879 (1.00) |
0.96 (1.00) |
1 (1.00) |
0.204 (1.00) |
1 (1.00) |
0.86 (1.00) |
| 17p loss | 0 (0%) | 517 |
0.455 (1.00) |
0.299 (1.00) |
0.722 (1.00) |
0.643 (1.00) |
0.776 (1.00) |
0.851 (1.00) |
| 17q loss | 0 (0%) | 533 |
0.92 (1.00) |
0.326 (1.00) |
0.815 (1.00) |
0.62 (1.00) |
1 (1.00) |
0.616 (1.00) |
| 18p loss | 0 (0%) | 508 |
0.207 (1.00) |
0.552 (1.00) |
1 (1.00) |
0.625 (1.00) |
0.448 (1.00) |
0.402 (1.00) |
| 18q loss | 0 (0%) | 513 |
0.265 (1.00) |
0.285 (1.00) |
0.399 (1.00) |
0.349 (1.00) |
0.391 (1.00) |
0.723 (1.00) |
| 19p loss | 0 (0%) | 539 |
0.62 (1.00) |
0.194 (1.00) |
0.775 (1.00) |
0.58 (1.00) |
1 (1.00) |
0.763 (1.00) |
| 19q loss | 0 (0%) | 534 |
0.185 (1.00) |
0.685 (1.00) |
1 (1.00) |
0.276 (1.00) |
0.206 (1.00) |
0.605 (1.00) |
| 20p loss | 0 (0%) | 541 |
0.45 (1.00) |
0.136 (1.00) |
0.357 (1.00) |
0.7 (1.00) |
1 (1.00) |
1 (1.00) |
| 20q loss | 0 (0%) | 542 |
0.468 (1.00) |
0.456 (1.00) |
0.526 (1.00) |
0.612 (1.00) |
1 (1.00) |
0.508 (1.00) |
| 21q loss | 0 (0%) | 527 |
0.828 (1.00) |
0.228 (1.00) |
0.212 (1.00) |
0.629 (1.00) |
0.709 (1.00) |
0.658 (1.00) |
| 22q loss | 0 (0%) | 412 |
0.571 (1.00) |
0.0172 (1.00) |
0.92 (1.00) |
0.613 (1.00) |
0.76 (1.00) |
0.673 (1.00) |
| Xq loss | 0 (0%) | 541 |
0.237 (1.00) |
0.0249 (1.00) |
0.759 (1.00) |
0.914 (1.00) |
1 (1.00) |
0.516 (1.00) |
P value = 0.000254 (t-test), Q value = 0.12
Table S1. Gene #11: '6p gain' versus Clinical Feature #4: 'KARNOFSKY.PERFORMANCE.SCORE'
| nPatients | Mean (Std.Dev) | |
|---|---|---|
| ALL | 409 | 77.3 (14.7) |
| 6P GAIN CNV | 4 | 80.0 (0.0) |
| 6P GAIN WILD-TYPE | 405 | 77.3 (14.8) |
Figure S1. Get High-res Image Gene #11: '6p gain' versus Clinical Feature #4: 'KARNOFSKY.PERFORMANCE.SCORE'
P value = 0.000254 (t-test), Q value = 0.12
Table S2. Gene #12: '6q gain' versus Clinical Feature #4: 'KARNOFSKY.PERFORMANCE.SCORE'
| nPatients | Mean (Std.Dev) | |
|---|---|---|
| ALL | 409 | 77.3 (14.7) |
| 6Q GAIN CNV | 5 | 80.0 (0.0) |
| 6Q GAIN WILD-TYPE | 404 | 77.3 (14.8) |
Figure S2. Get High-res Image Gene #12: '6q gain' versus Clinical Feature #4: 'KARNOFSKY.PERFORMANCE.SCORE'

P value = 1.61e-05 (t-test), Q value = 0.0075
Table S3. Gene #13: '7p gain' versus Clinical Feature #2: 'AGE'
| nPatients | Mean (Std.Dev) | |
|---|---|---|
| ALL | 552 | 57.9 (14.4) |
| 7P GAIN CNV | 427 | 59.7 (12.4) |
| 7P GAIN WILD-TYPE | 125 | 51.8 (18.6) |
Figure S3. Get High-res Image Gene #13: '7p gain' versus Clinical Feature #2: 'AGE'
P value = 2.1e-05 (t-test), Q value = 0.0098
Table S4. Gene #14: '7q gain' versus Clinical Feature #2: 'AGE'
| nPatients | Mean (Std.Dev) | |
|---|---|---|
| ALL | 552 | 57.9 (14.4) |
| 7Q GAIN CNV | 431 | 59.7 (12.2) |
| 7Q GAIN WILD-TYPE | 121 | 51.6 (19.1) |
Figure S4. Get High-res Image Gene #14: '7q gain' versus Clinical Feature #2: 'AGE'
P value = 9.31e-05 (t-test), Q value = 0.043
Table S5. Gene #19: '10p gain' versus Clinical Feature #2: 'AGE'
| nPatients | Mean (Std.Dev) | |
|---|---|---|
| ALL | 552 | 57.9 (14.4) |
| 10P GAIN CNV | 11 | 34.3 (12.9) |
| 10P GAIN WILD-TYPE | 541 | 58.4 (14.0) |
Figure S5. Get High-res Image Gene #19: '10p gain' versus Clinical Feature #2: 'AGE'
P value = 0.000254 (t-test), Q value = 0.12
Table S6. Gene #19: '10p gain' versus Clinical Feature #4: 'KARNOFSKY.PERFORMANCE.SCORE'
| nPatients | Mean (Std.Dev) | |
|---|---|---|
| ALL | 409 | 77.3 (14.7) |
| 10P GAIN CNV | 11 | 80.0 (0.0) |
| 10P GAIN WILD-TYPE | 398 | 77.2 (14.9) |
Figure S6. Get High-res Image Gene #19: '10p gain' versus Clinical Feature #4: 'KARNOFSKY.PERFORMANCE.SCORE'
P value = 0.000393 (logrank test), Q value = 0.18
Table S7. Gene #58: '10p loss' versus Clinical Feature #1: 'Time to Death'
| nPatients | nDeath | Duration Range (Median), Month | |
|---|---|---|---|
| ALL | 552 | 419 | 0.1 - 127.6 (9.6) |
| 10P LOSS CNV | 430 | 327 | 0.1 - 127.6 (9.4) |
| 10P LOSS WILD-TYPE | 122 | 92 | 0.2 - 108.8 (10.7) |
Figure S7. Get High-res Image Gene #58: '10p loss' versus Clinical Feature #1: 'Time to Death'
P value = 5.71e-09 (t-test), Q value = 2.7e-06
Table S8. Gene #58: '10p loss' versus Clinical Feature #2: 'AGE'
| nPatients | Mean (Std.Dev) | |
|---|---|---|
| ALL | 552 | 57.9 (14.4) |
| 10P LOSS CNV | 430 | 60.3 (11.9) |
| 10P LOSS WILD-TYPE | 122 | 49.4 (18.5) |
Figure S8. Get High-res Image Gene #58: '10p loss' versus Clinical Feature #2: 'AGE'
P value = 0.000112 (Fisher's exact test), Q value = 0.052
Table S9. Gene #58: '10p loss' versus Clinical Feature #5: 'HISTOLOGICAL.TYPE'
| nPatients | GLIOBLASTOMA MULTIFORME (GBM) | TREATED PRIMARY GBM | UNTREATED PRIMARY (DE NOVO) GBM |
|---|---|---|---|
| ALL | 8 | 18 | 526 |
| 10P LOSS CNV | 4 | 7 | 419 |
| 10P LOSS WILD-TYPE | 4 | 11 | 107 |
Figure S9. Get High-res Image Gene #58: '10p loss' versus Clinical Feature #5: 'HISTOLOGICAL.TYPE'
P value = 9.25e-07 (t-test), Q value = 0.00043
Table S10. Gene #59: '10q loss' versus Clinical Feature #2: 'AGE'
| nPatients | Mean (Std.Dev) | |
|---|---|---|
| ALL | 552 | 57.9 (14.4) |
| 10Q LOSS CNV | 443 | 59.8 (12.5) |
| 10Q LOSS WILD-TYPE | 109 | 50.2 (18.4) |
Figure S10. Get High-res Image Gene #59: '10q loss' versus Clinical Feature #2: 'AGE'
-
Mutation data file = broad_values_by_arm.mutsig.cluster.txt
-
Clinical data file = GBM-TP.clin.merged.picked.txt
-
Number of patients = 552
-
Number of significantly arm-level cnvs = 79
-
Number of selected clinical features = 6
-
Exclude genes that fewer than K tumors have mutations, K = 3
For survival clinical features, the Kaplan-Meier survival curves of tumors with and without gene mutations were plotted and the statistical significance P values were estimated by logrank test (Bland and Altman 2004) using the 'survdiff' function in R
For continuous numerical clinical features, two-tailed Student's t test with unequal variance (Lehmann and Romano 2005) was applied to compare the clinical values between tumors with and without gene mutations using 't.test' function in R
For binary or multi-class clinical features (nominal or ordinal), two-tailed Fisher's exact tests (Fisher 1922) were used to estimate the P values using the 'fisher.test' function in R
For multiple hypothesis correction, Q value is the False Discovery Rate (FDR) analogue of the P value (Benjamini and Hochberg 1995), defined as the minimum FDR at which the test may be called significant. We used the 'Benjamini and Hochberg' method of 'p.adjust' function in R to convert P values into Q values.
This is an experimental feature. The full results of the analysis summarized in this report can be downloaded from the TCGA Data Coordination Center.