This pipeline computes the correlation between significant copy number variation (cnv focal) genes and selected clinical features.
Testing the association between copy number variation 70 arm-level results and 6 clinical features across 552 patients, 15 significant findings detected with Q value < 0.25.
-
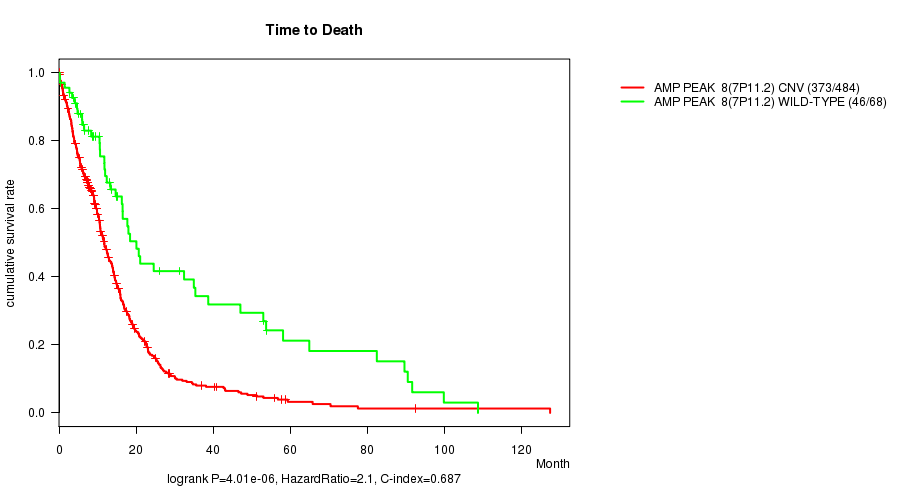
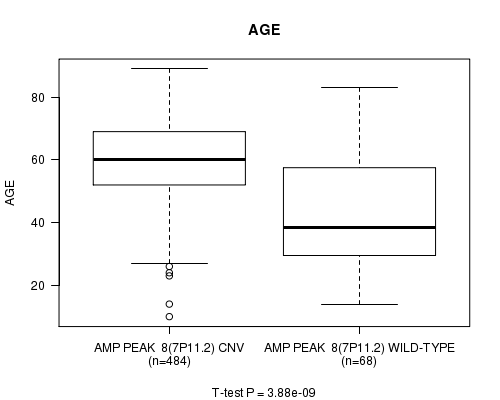
Amp Peak 8(7p11.2) cnv correlated to 'Time to Death' and 'AGE'.
-
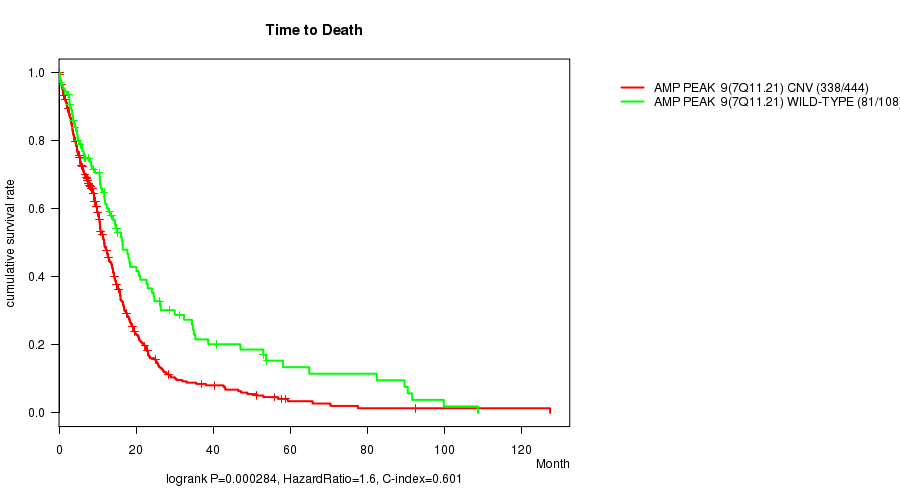
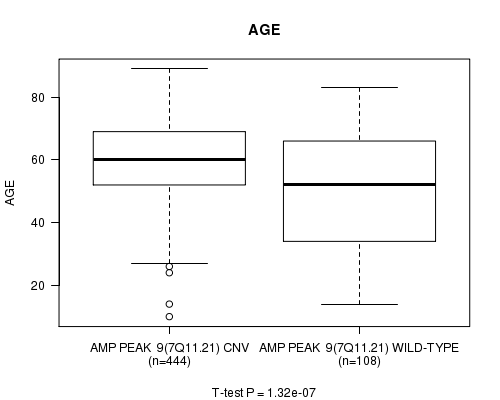
Amp Peak 9(7q11.21) cnv correlated to 'Time to Death' and 'AGE'.
-
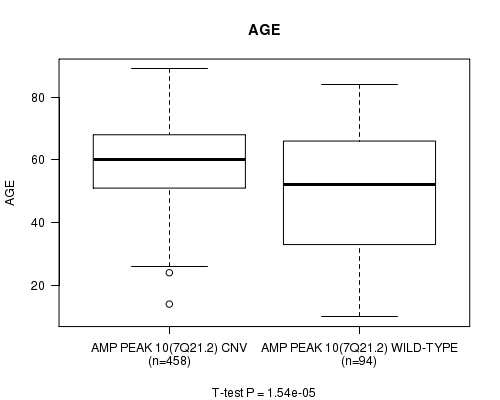
Amp Peak 10(7q21.2) cnv correlated to 'AGE'.
-
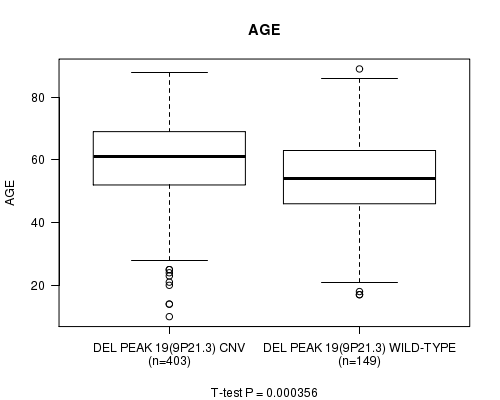
Del Peak 19(9p21.3) cnv correlated to 'AGE'.
-
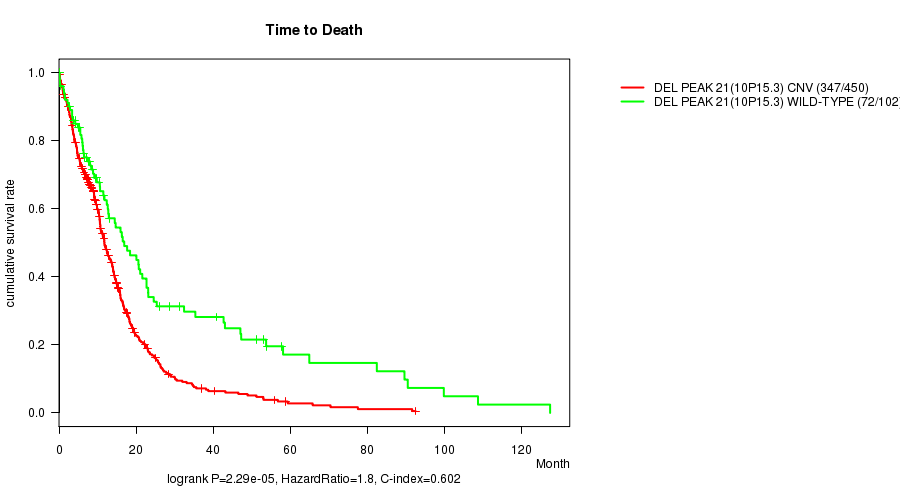
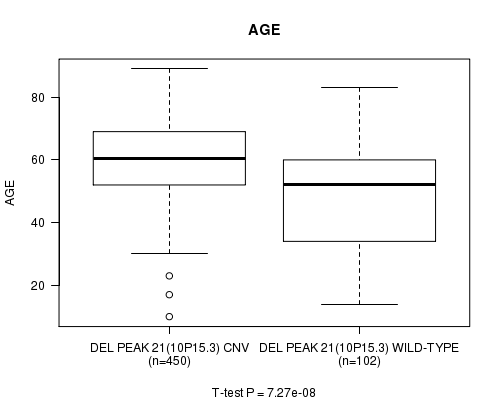
Del Peak 21(10p15.3) cnv correlated to 'Time to Death' and 'AGE'.
-
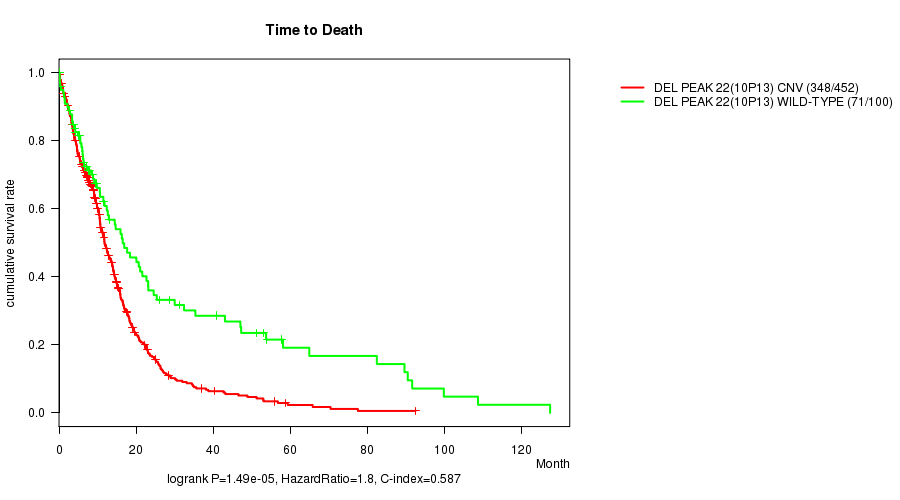
Del Peak 22(10p13) cnv correlated to 'Time to Death' and 'AGE'.
-
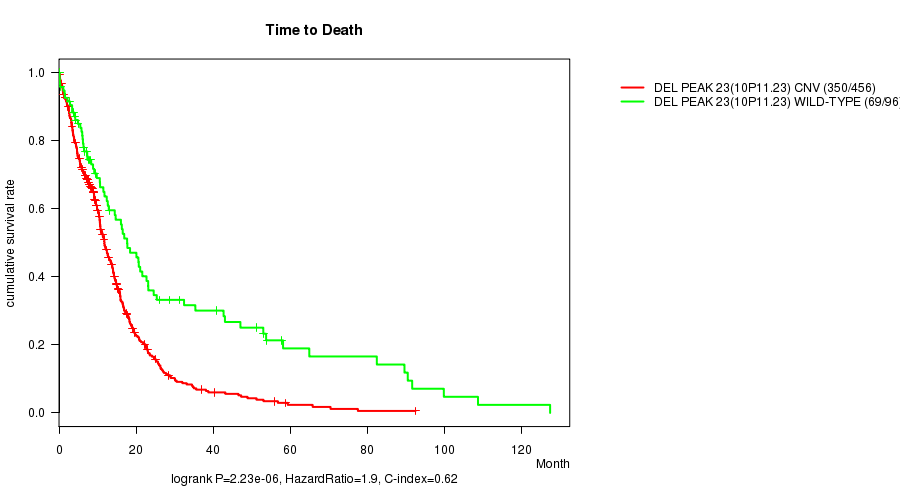
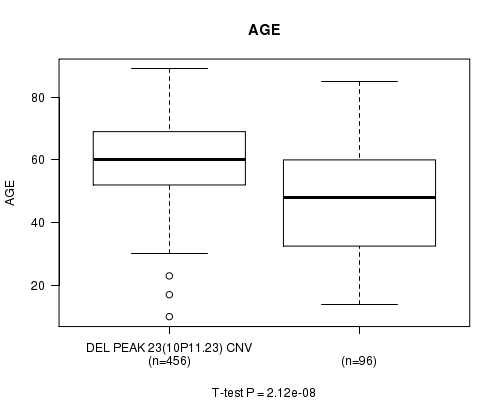
Del Peak 23(10p11.23) cnv correlated to 'Time to Death' and 'AGE'.
-
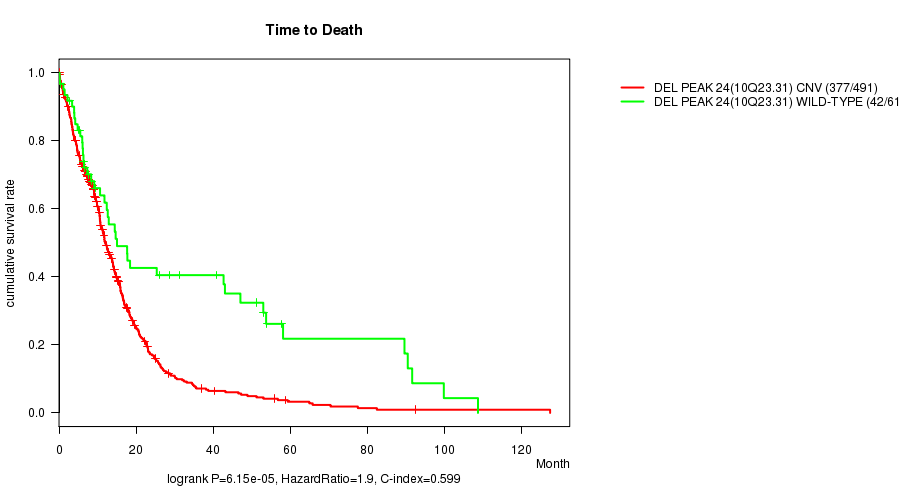
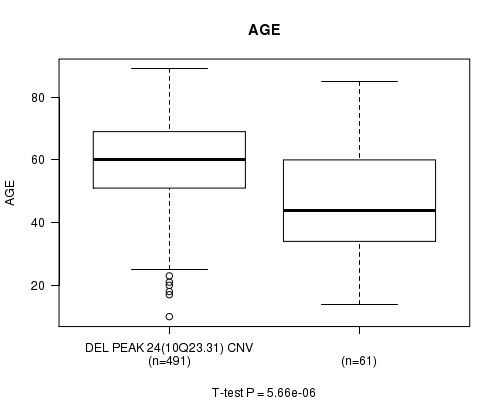
Del Peak 24(10q23.31) cnv correlated to 'Time to Death' and 'AGE'.
-
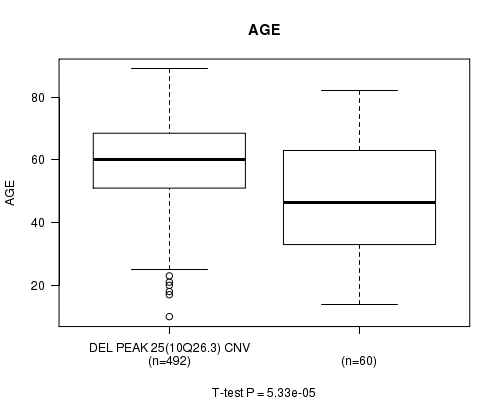
Del Peak 25(10q26.3) cnv correlated to 'AGE'.
Table 1. Get Full Table Overview of the association between significant copy number variation of 70 arm-level results and 6 clinical features. Shown in the table are P values (Q values). Thresholded by Q value < 0.25, 15 significant findings detected.
|
Clinical Features |
Time to Death |
AGE | GENDER |
KARNOFSKY PERFORMANCE SCORE |
HISTOLOGICAL TYPE |
RADIATIONS RADIATION REGIMENINDICATION |
||
| nCNV (%) | nWild-Type | logrank test | t-test | Fisher's exact test | t-test | Fisher's exact test | Fisher's exact test | |
| Amp Peak 8(7p11 2) | 0 (0%) | 68 |
4.01e-06 (0.00166) |
3.88e-09 (1.63e-06) |
0.428 (1.00) |
0.0351 (1.00) |
0.0463 (1.00) |
0.0505 (1.00) |
| Amp Peak 9(7q11 21) | 0 (0%) | 108 |
0.000284 (0.115) |
1.32e-07 (5.5e-05) |
0.273 (1.00) |
0.658 (1.00) |
0.0105 (1.00) |
0.0629 (1.00) |
| Del Peak 21(10p15 3) | 0 (0%) | 102 |
2.29e-05 (0.00939) |
7.27e-08 (3.04e-05) |
0.0927 (1.00) |
0.596 (1.00) |
0.0223 (1.00) |
0.41 (1.00) |
| Del Peak 22(10p13) | 0 (0%) | 100 |
1.49e-05 (0.00613) |
3.45e-07 (0.000143) |
0.0415 (1.00) |
0.884 (1.00) |
0.0199 (1.00) |
0.905 (1.00) |
| Del Peak 23(10p11 23) | 0 (0%) | 96 |
2.23e-06 (0.000927) |
2.12e-08 (8.86e-06) |
0.109 (1.00) |
0.232 (1.00) |
0.00327 (1.00) |
0.545 (1.00) |
| Del Peak 24(10q23 31) | 0 (0%) | 61 |
6.15e-05 (0.0251) |
5.66e-06 (0.00234) |
0.677 (1.00) |
0.0751 (1.00) |
0.00512 (1.00) |
0.661 (1.00) |
| Amp Peak 10(7q21 2) | 0 (0%) | 94 |
0.00181 (0.732) |
1.54e-05 (0.00635) |
0.563 (1.00) |
0.49 (1.00) |
0.0369 (1.00) |
0.143 (1.00) |
| Del Peak 19(9p21 3) | 0 (0%) | 149 |
0.037 (1.00) |
0.000356 (0.145) |
0.493 (1.00) |
0.0926 (1.00) |
0.195 (1.00) |
0.536 (1.00) |
| Del Peak 25(10q26 3) | 0 (0%) | 60 |
0.00319 (1.00) |
5.33e-05 (0.0218) |
0.576 (1.00) |
0.0613 (1.00) |
0.0188 (1.00) |
1 (1.00) |
| Amp Peak 1(1p36 21) | 0 (0%) | 465 |
0.0947 (1.00) |
0.348 (1.00) |
0.283 (1.00) |
0.653 (1.00) |
0.314 (1.00) |
0.801 (1.00) |
| Amp Peak 2(1q32 1) | 0 (0%) | 404 |
0.48 (1.00) |
0.299 (1.00) |
0.624 (1.00) |
0.279 (1.00) |
0.275 (1.00) |
0.917 (1.00) |
| Amp Peak 3(1q44) | 0 (0%) | 458 |
0.534 (1.00) |
0.857 (1.00) |
0.297 (1.00) |
0.599 (1.00) |
0.627 (1.00) |
0.808 (1.00) |
| Amp Peak 4(2p24 3) | 0 (0%) | 507 |
0.0986 (1.00) |
0.175 (1.00) |
0.341 (1.00) |
0.583 (1.00) |
0.69 (1.00) |
0.867 (1.00) |
| Amp Peak 5(3q26 33) | 0 (0%) | 447 |
0.312 (1.00) |
0.0358 (1.00) |
0.825 (1.00) |
0.688 (1.00) |
0.0328 (1.00) |
0.907 (1.00) |
| Amp Peak 6(4p16 3) | 0 (0%) | 507 |
0.525 (1.00) |
0.514 (1.00) |
0.526 (1.00) |
0.429 (1.00) |
1 (1.00) |
0.239 (1.00) |
| Amp Peak 7(4q12) | 0 (0%) | 449 |
0.663 (1.00) |
0.575 (1.00) |
0.22 (1.00) |
0.597 (1.00) |
0.416 (1.00) |
0.346 (1.00) |
| Amp Peak 11(7q31 2) | 0 (0%) | 101 |
0.0371 (1.00) |
0.00184 (0.742) |
0.369 (1.00) |
0.513 (1.00) |
0.143 (1.00) |
0.0565 (1.00) |
| Amp Peak 12(7q36 1) | 0 (0%) | 96 |
0.0873 (1.00) |
0.00282 (1.00) |
0.492 (1.00) |
0.732 (1.00) |
0.115 (1.00) |
0.276 (1.00) |
| Amp Peak 13(8q24 21) | 0 (0%) | 489 |
0.359 (1.00) |
0.13 (1.00) |
0.275 (1.00) |
0.804 (1.00) |
0.885 (1.00) |
0.472 (1.00) |
| Amp Peak 14(11p13) | 0 (0%) | 527 |
0.958 (1.00) |
0.217 (1.00) |
0.406 (1.00) |
0.316 (1.00) |
0.226 (1.00) |
0.513 (1.00) |
| Amp Peak 15(12p13 32) | 0 (0%) | 473 |
0.664 (1.00) |
0.0932 (1.00) |
1 (1.00) |
0.695 (1.00) |
1 (1.00) |
1 (1.00) |
| Amp Peak 16(12q14 1) | 0 (0%) | 424 |
0.201 (1.00) |
0.684 (1.00) |
0.409 (1.00) |
0.808 (1.00) |
0.745 (1.00) |
0.827 (1.00) |
| Amp Peak 17(12q15) | 0 (0%) | 463 |
0.861 (1.00) |
0.679 (1.00) |
0.346 (1.00) |
0.911 (1.00) |
0.683 (1.00) |
0.21 (1.00) |
| Amp Peak 18(13q34) | 0 (0%) | 522 |
0.803 (1.00) |
0.824 (1.00) |
0.339 (1.00) |
0.838 (1.00) |
0.529 (1.00) |
0.688 (1.00) |
| Amp Peak 19(14q32 33) | 0 (0%) | 520 |
0.159 (1.00) |
0.0224 (1.00) |
0.582 (1.00) |
0.254 (1.00) |
0.209 (1.00) |
1 (1.00) |
| Amp Peak 20(17p13 2) | 0 (0%) | 508 |
0.932 (1.00) |
0.541 (1.00) |
0.336 (1.00) |
0.109 (1.00) |
0.685 (1.00) |
0.615 (1.00) |
| Amp Peak 21(17q25 1) | 0 (0%) | 477 |
0.139 (1.00) |
0.0873 (1.00) |
0.255 (1.00) |
0.837 (1.00) |
1 (1.00) |
0.687 (1.00) |
| Amp Peak 22(19p13 2) | 0 (0%) | 318 |
0.101 (1.00) |
0.821 (1.00) |
1 (1.00) |
0.441 (1.00) |
0.517 (1.00) |
1 (1.00) |
| Amp Peak 23(19q12) | 0 (0%) | 353 |
0.261 (1.00) |
0.529 (1.00) |
0.587 (1.00) |
0.996 (1.00) |
0.718 (1.00) |
0.774 (1.00) |
| Amp Peak 24(21q21 1) | 0 (0%) | 488 |
0.526 (1.00) |
0.0198 (1.00) |
0.684 (1.00) |
0.549 (1.00) |
0.374 (1.00) |
0.566 (1.00) |
| Del Peak 1(1p36 32) | 0 (0%) | 457 |
0.374 (1.00) |
0.867 (1.00) |
0.0508 (1.00) |
0.999 (1.00) |
0.43 (1.00) |
0.808 (1.00) |
| Del Peak 2(1p36 23) | 0 (0%) | 421 |
0.943 (1.00) |
0.0255 (1.00) |
0.0104 (1.00) |
0.193 (1.00) |
0.263 (1.00) |
0.665 (1.00) |
| Del Peak 3(1p32 3) | 0 (0%) | 493 |
0.735 (1.00) |
0.0677 (1.00) |
0.159 (1.00) |
0.687 (1.00) |
1 (1.00) |
0.101 (1.00) |
| Del Peak 4(1p22 1) | 0 (0%) | 506 |
0.257 (1.00) |
0.345 (1.00) |
1 (1.00) |
0.585 (1.00) |
0.0899 (1.00) |
1 (1.00) |
| Del Peak 5(1q42 11) | 0 (0%) | 507 |
0.0965 (1.00) |
0.0679 (1.00) |
1 (1.00) |
0.0102 (1.00) |
1 (1.00) |
0.181 (1.00) |
| Del Peak 6(1q44) | 0 (0%) | 521 |
0.315 (1.00) |
0.301 (1.00) |
0.851 (1.00) |
0.0669 (1.00) |
1 (1.00) |
0.844 (1.00) |
| Del Peak 7(2q22 1) | 0 (0%) | 509 |
0.33 (1.00) |
0.102 (1.00) |
0.198 (1.00) |
0.686 (1.00) |
0.816 (1.00) |
0.123 (1.00) |
| Del Peak 8(2q37 1) | 0 (0%) | 497 |
0.73 (1.00) |
0.327 (1.00) |
0.146 (1.00) |
0.657 (1.00) |
1 (1.00) |
0.36 (1.00) |
| Del Peak 9(3p21 1) | 0 (0%) | 500 |
0.021 (1.00) |
0.0109 (1.00) |
0.883 (1.00) |
0.698 (1.00) |
0.501 (1.00) |
0.0591 (1.00) |
| Del Peak 10(3q13 31) | 0 (0%) | 497 |
0.504 (1.00) |
0.0586 (1.00) |
0.384 (1.00) |
0.306 (1.00) |
0.872 (1.00) |
0.128 (1.00) |
| Del Peak 11(3q22 1) | 0 (0%) | 497 |
0.625 (1.00) |
0.128 (1.00) |
1 (1.00) |
0.49 (1.00) |
0.872 (1.00) |
0.442 (1.00) |
| Del Peak 12(3q29) | 0 (0%) | 489 |
0.277 (1.00) |
0.233 (1.00) |
1 (1.00) |
0.459 (1.00) |
1 (1.00) |
0.246 (1.00) |
| Del Peak 13(4p16 3) | 0 (0%) | 476 |
0.295 (1.00) |
0.0281 (1.00) |
0.255 (1.00) |
0.154 (1.00) |
0.507 (1.00) |
0.084 (1.00) |
| Del Peak 14(4q34 3) | 0 (0%) | 463 |
0.149 (1.00) |
0.0849 (1.00) |
0.0585 (1.00) |
0.66 (1.00) |
0.561 (1.00) |
0.105 (1.00) |
| Del Peak 15(5q35 3) | 0 (0%) | 500 |
0.0167 (1.00) |
0.171 (1.00) |
1 (1.00) |
0.564 (1.00) |
1 (1.00) |
0.431 (1.00) |
| Del Peak 16(6q22 31) | 0 (0%) | 400 |
0.0543 (1.00) |
0.353 (1.00) |
0.0974 (1.00) |
0.454 (1.00) |
0.122 (1.00) |
0.838 (1.00) |
| Del Peak 17(6q26) | 0 (0%) | 380 |
0.214 (1.00) |
0.713 (1.00) |
0.189 (1.00) |
0.702 (1.00) |
0.128 (1.00) |
0.692 (1.00) |
| Del Peak 18(8p23 2) | 0 (0%) | 486 |
0.171 (1.00) |
0.0355 (1.00) |
0.595 (1.00) |
0.634 (1.00) |
0.782 (1.00) |
0.571 (1.00) |
| Del Peak 20(9q34 2) | 0 (0%) | 482 |
0.417 (1.00) |
0.768 (1.00) |
1 (1.00) |
0.498 (1.00) |
0.615 (1.00) |
0.681 (1.00) |
| Del Peak 26(11p15 5) | 0 (0%) | 427 |
0.0326 (1.00) |
0.00539 (1.00) |
0.177 (1.00) |
0.242 (1.00) |
0.436 (1.00) |
0.742 (1.00) |
| Del Peak 27(11p11 2) | 0 (0%) | 452 |
0.0771 (1.00) |
0.64 (1.00) |
0.144 (1.00) |
0.796 (1.00) |
0.197 (1.00) |
0.812 (1.00) |
| Del Peak 28(11q14 1) | 0 (0%) | 458 |
0.763 (1.00) |
0.815 (1.00) |
0.297 (1.00) |
0.538 (1.00) |
0.382 (1.00) |
0.0658 (1.00) |
| Del Peak 29(12p13 1) | 0 (0%) | 478 |
0.356 (1.00) |
0.859 (1.00) |
0.523 (1.00) |
0.846 (1.00) |
0.713 (1.00) |
0.893 (1.00) |
| Del Peak 30(12q12) | 0 (0%) | 477 |
0.667 (1.00) |
0.736 (1.00) |
1 (1.00) |
0.81 (1.00) |
1 (1.00) |
0.227 (1.00) |
| Del Peak 31(12q15) | 0 (0%) | 476 |
0.635 (1.00) |
0.717 (1.00) |
0.451 (1.00) |
0.186 (1.00) |
0.394 (1.00) |
0.181 (1.00) |
| Del Peak 32(13q14 2) | 0 (0%) | 320 |
0.55 (1.00) |
0.648 (1.00) |
0.792 (1.00) |
0.828 (1.00) |
0.515 (1.00) |
0.577 (1.00) |
| Del Peak 33(14q13 1) | 0 (0%) | 379 |
0.817 (1.00) |
0.591 (1.00) |
0.223 (1.00) |
0.262 (1.00) |
0.162 (1.00) |
0.767 (1.00) |
| Del Peak 34(14q24 2) | 0 (0%) | 384 |
0.806 (1.00) |
0.397 (1.00) |
0.395 (1.00) |
0.605 (1.00) |
0.112 (1.00) |
0.484 (1.00) |
| Del Peak 35(14q31 3) | 0 (0%) | 397 |
0.977 (1.00) |
0.663 (1.00) |
0.628 (1.00) |
0.647 (1.00) |
0.0532 (1.00) |
0.609 (1.00) |
| Del Peak 36(15q14) | 0 (0%) | 405 |
0.447 (1.00) |
0.0681 (1.00) |
0.695 (1.00) |
0.808 (1.00) |
0.77 (1.00) |
0.211 (1.00) |
| Del Peak 37(16p12 2) | 0 (0%) | 463 |
0.359 (1.00) |
0.339 (1.00) |
0.238 (1.00) |
0.808 (1.00) |
0.287 (1.00) |
0.534 (1.00) |
| Del Peak 38(16q23 3) | 0 (0%) | 459 |
0.243 (1.00) |
0.91 (1.00) |
0.486 (1.00) |
0.266 (1.00) |
0.569 (1.00) |
0.0141 (1.00) |
| Del Peak 39(17p13 2) | 0 (0%) | 470 |
0.626 (1.00) |
0.504 (1.00) |
0.272 (1.00) |
0.189 (1.00) |
1 (1.00) |
0.519 (1.00) |
| Del Peak 40(17p13 1) | 0 (0%) | 460 |
0.807 (1.00) |
0.164 (1.00) |
0.0802 (1.00) |
0.797 (1.00) |
1 (1.00) |
0.0832 (1.00) |
| Del Peak 41(17q11 2) | 0 (0%) | 484 |
0.585 (1.00) |
0.518 (1.00) |
0.895 (1.00) |
0.245 (1.00) |
1 (1.00) |
0.035 (1.00) |
| Del Peak 42(18q22 3) | 0 (0%) | 473 |
0.744 (1.00) |
0.63 (1.00) |
0.805 (1.00) |
0.128 (1.00) |
1 (1.00) |
0.896 (1.00) |
| Del Peak 43(19q13 41) | 0 (0%) | 454 |
0.058 (1.00) |
0.415 (1.00) |
1 (1.00) |
0.264 (1.00) |
0.441 (1.00) |
1 (1.00) |
| Del Peak 44(21q22 3) | 0 (0%) | 493 |
0.699 (1.00) |
0.0576 (1.00) |
0.325 (1.00) |
0.198 (1.00) |
0.883 (1.00) |
0.882 (1.00) |
| Del Peak 45(22q13 32) | 0 (0%) | 346 |
0.634 (1.00) |
0.307 (1.00) |
0.928 (1.00) |
0.518 (1.00) |
0.79 (1.00) |
1 (1.00) |
| Del Peak 46(Xp22 2) | 0 (0%) | 430 |
0.252 (1.00) |
0.429 (1.00) |
0.676 (1.00) |
0.825 (1.00) |
0.308 (1.00) |
0.438 (1.00) |
P value = 4.01e-06 (logrank test), Q value = 0.0017
Table S1. Gene #8: 'Amp Peak 8(7p11.2)' versus Clinical Feature #1: 'Time to Death'
| nPatients | nDeath | Duration Range (Median), Month | |
|---|---|---|---|
| ALL | 552 | 419 | 0.1 - 127.6 (9.6) |
| AMP PEAK 8(7P11.2) CNV | 484 | 373 | 0.1 - 127.6 (9.2) |
| AMP PEAK 8(7P11.2) WILD-TYPE | 68 | 46 | 0.2 - 108.8 (13.2) |
Figure S1. Get High-res Image Gene #8: 'Amp Peak 8(7p11.2)' versus Clinical Feature #1: 'Time to Death'
P value = 3.88e-09 (t-test), Q value = 1.6e-06
Table S2. Gene #8: 'Amp Peak 8(7p11.2)' versus Clinical Feature #2: 'AGE'
| nPatients | Mean (Std.Dev) | |
|---|---|---|
| ALL | 552 | 57.9 (14.4) |
| AMP PEAK 8(7P11.2) CNV | 484 | 59.8 (12.5) |
| AMP PEAK 8(7P11.2) WILD-TYPE | 68 | 44.2 (18.8) |
Figure S2. Get High-res Image Gene #8: 'Amp Peak 8(7p11.2)' versus Clinical Feature #2: 'AGE'
P value = 0.000284 (logrank test), Q value = 0.12
Table S3. Gene #9: 'Amp Peak 9(7q11.21)' versus Clinical Feature #1: 'Time to Death'
| nPatients | nDeath | Duration Range (Median), Month | |
|---|---|---|---|
| ALL | 552 | 419 | 0.1 - 127.6 (9.6) |
| AMP PEAK 9(7Q11.21) CNV | 444 | 338 | 0.1 - 127.6 (9.2) |
| AMP PEAK 9(7Q11.21) WILD-TYPE | 108 | 81 | 0.2 - 108.8 (11.9) |
Figure S3. Get High-res Image Gene #9: 'Amp Peak 9(7q11.21)' versus Clinical Feature #1: 'Time to Death'
P value = 1.32e-07 (t-test), Q value = 5.5e-05
Table S4. Gene #9: 'Amp Peak 9(7q11.21)' versus Clinical Feature #2: 'AGE'
| nPatients | Mean (Std.Dev) | |
|---|---|---|
| ALL | 552 | 57.9 (14.4) |
| AMP PEAK 9(7Q11.21) CNV | 444 | 59.9 (12.4) |
| AMP PEAK 9(7Q11.21) WILD-TYPE | 108 | 49.6 (18.3) |
Figure S4. Get High-res Image Gene #9: 'Amp Peak 9(7q11.21)' versus Clinical Feature #2: 'AGE'
P value = 1.54e-05 (t-test), Q value = 0.0063
Table S5. Gene #10: 'Amp Peak 10(7q21.2)' versus Clinical Feature #2: 'AGE'
| nPatients | Mean (Std.Dev) | |
|---|---|---|
| ALL | 552 | 57.9 (14.4) |
| AMP PEAK 10(7Q21.2) CNV | 458 | 59.5 (12.4) |
| AMP PEAK 10(7Q21.2) WILD-TYPE | 94 | 49.9 (19.9) |
Figure S5. Get High-res Image Gene #10: 'Amp Peak 10(7q21.2)' versus Clinical Feature #2: 'AGE'
P value = 0.000356 (t-test), Q value = 0.14
Table S6. Gene #43: 'Del Peak 19(9p21.3)' versus Clinical Feature #2: 'AGE'
| nPatients | Mean (Std.Dev) | |
|---|---|---|
| ALL | 552 | 57.9 (14.4) |
| DEL PEAK 19(9P21.3) CNV | 403 | 59.3 (13.6) |
| DEL PEAK 19(9P21.3) WILD-TYPE | 149 | 54.0 (15.8) |
Figure S6. Get High-res Image Gene #43: 'Del Peak 19(9p21.3)' versus Clinical Feature #2: 'AGE'
P value = 2.29e-05 (logrank test), Q value = 0.0094
Table S7. Gene #45: 'Del Peak 21(10p15.3)' versus Clinical Feature #1: 'Time to Death'
| nPatients | nDeath | Duration Range (Median), Month | |
|---|---|---|---|
| ALL | 552 | 419 | 0.1 - 127.6 (9.6) |
| DEL PEAK 21(10P15.3) CNV | 450 | 347 | 0.1 - 92.6 (9.4) |
| DEL PEAK 21(10P15.3) WILD-TYPE | 102 | 72 | 0.1 - 127.6 (10.6) |
Figure S7. Get High-res Image Gene #45: 'Del Peak 21(10p15.3)' versus Clinical Feature #1: 'Time to Death'
P value = 7.27e-08 (t-test), Q value = 3e-05
Table S8. Gene #45: 'Del Peak 21(10p15.3)' versus Clinical Feature #2: 'AGE'
| nPatients | Mean (Std.Dev) | |
|---|---|---|
| ALL | 552 | 57.9 (14.4) |
| DEL PEAK 21(10P15.3) CNV | 450 | 59.9 (12.4) |
| DEL PEAK 21(10P15.3) WILD-TYPE | 102 | 48.9 (18.4) |
Figure S8. Get High-res Image Gene #45: 'Del Peak 21(10p15.3)' versus Clinical Feature #2: 'AGE'
P value = 1.49e-05 (logrank test), Q value = 0.0061
Table S9. Gene #46: 'Del Peak 22(10p13)' versus Clinical Feature #1: 'Time to Death'
| nPatients | nDeath | Duration Range (Median), Month | |
|---|---|---|---|
| ALL | 552 | 419 | 0.1 - 127.6 (9.6) |
| DEL PEAK 22(10P13) CNV | 452 | 348 | 0.1 - 92.6 (9.4) |
| DEL PEAK 22(10P13) WILD-TYPE | 100 | 71 | 0.1 - 127.6 (10.2) |
Figure S9. Get High-res Image Gene #46: 'Del Peak 22(10p13)' versus Clinical Feature #1: 'Time to Death'
P value = 3.45e-07 (t-test), Q value = 0.00014
Table S10. Gene #46: 'Del Peak 22(10p13)' versus Clinical Feature #2: 'AGE'
| nPatients | Mean (Std.Dev) | |
|---|---|---|
| ALL | 552 | 57.9 (14.4) |
| DEL PEAK 22(10P13) CNV | 452 | 59.8 (12.4) |
| DEL PEAK 22(10P13) WILD-TYPE | 100 | 49.1 (18.9) |
Figure S10. Get High-res Image Gene #46: 'Del Peak 22(10p13)' versus Clinical Feature #2: 'AGE'

P value = 2.23e-06 (logrank test), Q value = 0.00093
Table S11. Gene #47: 'Del Peak 23(10p11.23)' versus Clinical Feature #1: 'Time to Death'
| nPatients | nDeath | Duration Range (Median), Month | |
|---|---|---|---|
| ALL | 552 | 419 | 0.1 - 127.6 (9.6) |
| DEL PEAK 23(10P11.23) CNV | 456 | 350 | 0.1 - 92.6 (9.4) |
| DEL PEAK 23(10P11.23) WILD-TYPE | 96 | 69 | 0.1 - 127.6 (11.7) |
Figure S11. Get High-res Image Gene #47: 'Del Peak 23(10p11.23)' versus Clinical Feature #1: 'Time to Death'
P value = 2.12e-08 (t-test), Q value = 8.9e-06
Table S12. Gene #47: 'Del Peak 23(10p11.23)' versus Clinical Feature #2: 'AGE'
| nPatients | Mean (Std.Dev) | |
|---|---|---|
| ALL | 552 | 57.9 (14.4) |
| DEL PEAK 23(10P11.23) CNV | 456 | 60.0 (12.3) |
| DEL PEAK 23(10P11.23) WILD-TYPE | 96 | 47.9 (18.8) |
Figure S12. Get High-res Image Gene #47: 'Del Peak 23(10p11.23)' versus Clinical Feature #2: 'AGE'
P value = 6.15e-05 (logrank test), Q value = 0.025
Table S13. Gene #48: 'Del Peak 24(10q23.31)' versus Clinical Feature #1: 'Time to Death'
| nPatients | nDeath | Duration Range (Median), Month | |
|---|---|---|---|
| ALL | 552 | 419 | 0.1 - 127.6 (9.6) |
| DEL PEAK 24(10Q23.31) CNV | 491 | 377 | 0.1 - 127.6 (9.5) |
| DEL PEAK 24(10Q23.31) WILD-TYPE | 61 | 42 | 0.2 - 108.8 (10.7) |
Figure S13. Get High-res Image Gene #48: 'Del Peak 24(10q23.31)' versus Clinical Feature #1: 'Time to Death'
P value = 5.66e-06 (t-test), Q value = 0.0023
Table S14. Gene #48: 'Del Peak 24(10q23.31)' versus Clinical Feature #2: 'AGE'
| nPatients | Mean (Std.Dev) | |
|---|---|---|
| ALL | 552 | 57.9 (14.4) |
| DEL PEAK 24(10Q23.31) CNV | 491 | 59.3 (13.1) |
| DEL PEAK 24(10Q23.31) WILD-TYPE | 61 | 47.0 (18.9) |
Figure S14. Get High-res Image Gene #48: 'Del Peak 24(10q23.31)' versus Clinical Feature #2: 'AGE'
P value = 5.33e-05 (t-test), Q value = 0.022
Table S15. Gene #49: 'Del Peak 25(10q26.3)' versus Clinical Feature #2: 'AGE'
| nPatients | Mean (Std.Dev) | |
|---|---|---|
| ALL | 552 | 57.9 (14.4) |
| DEL PEAK 25(10Q26.3) CNV | 492 | 59.1 (13.3) |
| DEL PEAK 25(10Q26.3) WILD-TYPE | 60 | 48.2 (19.0) |
Figure S15. Get High-res Image Gene #49: 'Del Peak 25(10q26.3)' versus Clinical Feature #2: 'AGE'
-
Mutation data file = all_lesions.conf_99.cnv.cluster.txt
-
Clinical data file = GBM-TP.clin.merged.picked.txt
-
Number of patients = 552
-
Number of significantly arm-level cnvs = 70
-
Number of selected clinical features = 6
-
Exclude genes that fewer than K tumors have mutations, K = 3
For survival clinical features, the Kaplan-Meier survival curves of tumors with and without gene mutations were plotted and the statistical significance P values were estimated by logrank test (Bland and Altman 2004) using the 'survdiff' function in R
For continuous numerical clinical features, two-tailed Student's t test with unequal variance (Lehmann and Romano 2005) was applied to compare the clinical values between tumors with and without gene mutations using 't.test' function in R
For binary or multi-class clinical features (nominal or ordinal), two-tailed Fisher's exact tests (Fisher 1922) were used to estimate the P values using the 'fisher.test' function in R
For multiple hypothesis correction, Q value is the False Discovery Rate (FDR) analogue of the P value (Benjamini and Hochberg 1995), defined as the minimum FDR at which the test may be called significant. We used the 'Benjamini and Hochberg' method of 'p.adjust' function in R to convert P values into Q values.
This is an experimental feature. The full results of the analysis summarized in this report can be downloaded from the TCGA Data Coordination Center.