This pipeline computes the correlation between significantly recurrent gene mutations and molecular subtypes.
Testing the association between mutation status of 10 genes and 12 molecular subtypes across 293 patients, 9 significant findings detected with P value < 0.05 and Q value < 0.25.
-
PBRM1 mutation correlated to 'CN_CNMF', 'METHLYATION_CNMF', 'MRNASEQ_CNMF', and 'MIRSEQ_CHIERARCHICAL'.
-
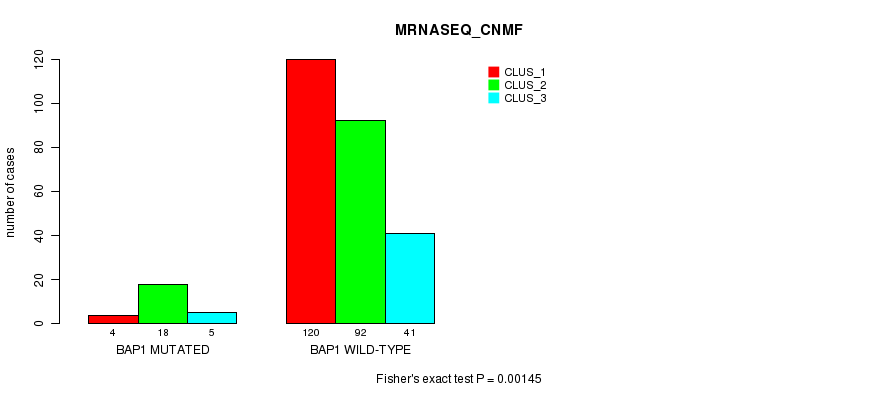
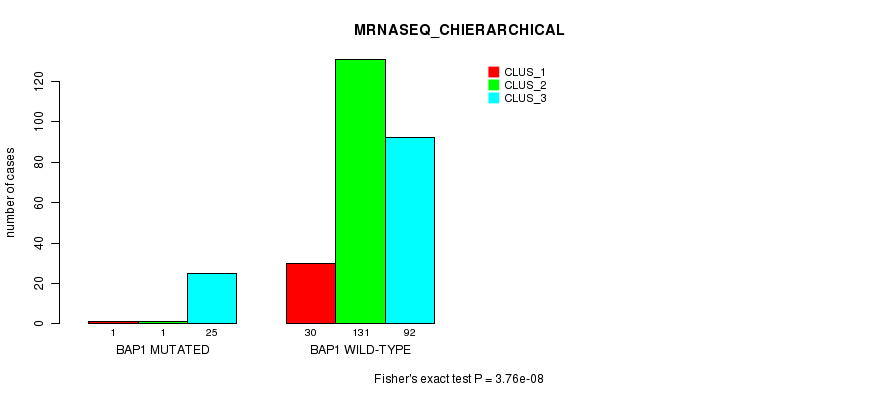
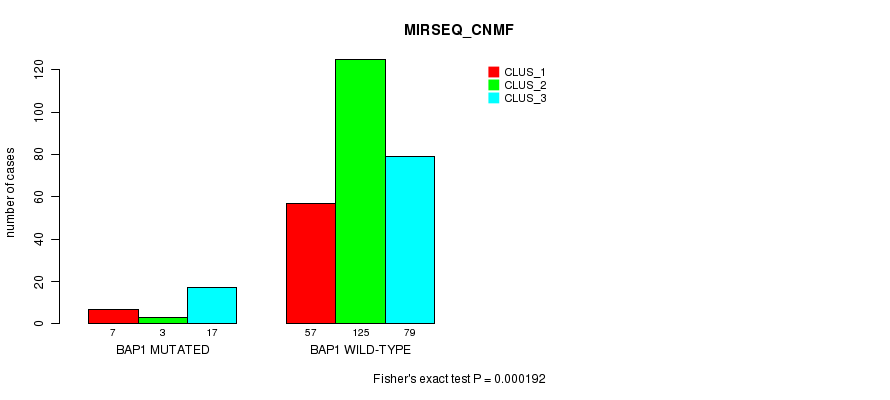
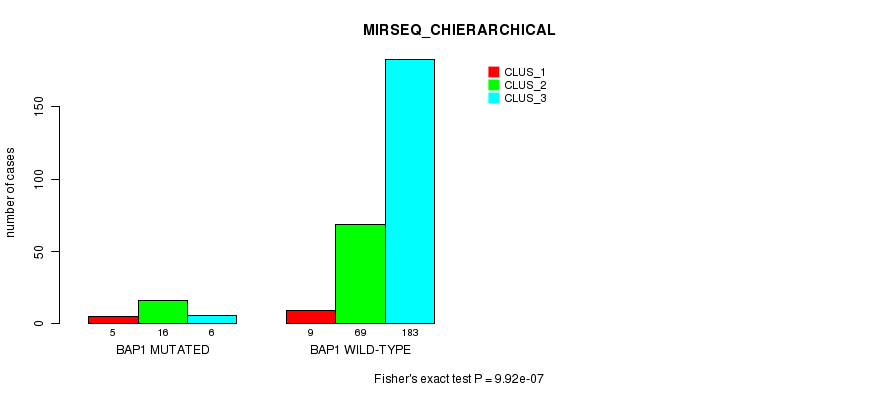
BAP1 mutation correlated to 'MRNASEQ_CNMF', 'MRNASEQ_CHIERARCHICAL', 'MIRSEQ_CNMF', and 'MIRSEQ_CHIERARCHICAL'.
-
SETD2 mutation correlated to 'METHLYATION_CNMF'.
Table 1. Get Full Table Overview of the association between mutation status of 10 genes and 12 molecular subtypes. Shown in the table are P values (Q values). Thresholded by P value < 0.05 and Q value < 0.25, 9 significant findings detected.
|
Clinical Features |
MRNA CNMF |
MRNA CHIERARCHICAL |
CN CNMF |
METHLYATION CNMF |
RPPA CNMF |
RPPA CHIERARCHICAL |
MRNASEQ CNMF |
MRNASEQ CHIERARCHICAL |
MIRSEQ CNMF |
MIRSEQ CHIERARCHICAL |
MIRSEQ MATURE CNMF |
MIRSEQ MATURE CHIERARCHICAL |
||
| nMutated (%) | nWild-Type | Fisher's exact test | Fisher's exact test | Fisher's exact test | Fisher's exact test | Chi-square test | Fisher's exact test | Fisher's exact test | Fisher's exact test | Fisher's exact test | Fisher's exact test | Fisher's exact test | Fisher's exact test | |
| PBRM1 | 107 (37%) | 186 |
0.0211 (1.00) |
0.0415 (1.00) |
0.000326 (0.0313) |
0.00124 (0.116) |
0.00738 (0.672) |
0.799 (1.00) |
0.000649 (0.0616) |
0.0822 (1.00) |
0.0456 (1.00) |
0.000141 (0.0139) |
0.088 (1.00) |
0.00812 (0.723) |
| BAP1 | 27 (9%) | 266 |
0.0212 (1.00) |
0.026 (1.00) |
0.166 (1.00) |
0.00309 (0.285) |
0.0259 (1.00) |
0.774 (1.00) |
0.00145 (0.135) |
3.76e-08 (3.8e-06) |
0.000192 (0.0186) |
9.92e-07 (9.92e-05) |
0.0217 (1.00) |
0.0261 (1.00) |
| SETD2 | 34 (12%) | 259 |
0.747 (1.00) |
0.771 (1.00) |
0.124 (1.00) |
2.69e-05 (0.00267) |
0.249 (1.00) |
0.21 (1.00) |
0.338 (1.00) |
0.655 (1.00) |
0.0978 (1.00) |
0.465 (1.00) |
0.744 (1.00) |
0.429 (1.00) |
| SV2C | 3 (1%) | 290 |
0.157 (1.00) |
0.011 (0.954) |
0.54 (1.00) |
0.79 (1.00) |
0.236 (1.00) |
0.0191 (1.00) |
||||||
| VHL | 138 (47%) | 155 |
0.0307 (1.00) |
0.0282 (1.00) |
0.611 (1.00) |
0.314 (1.00) |
0.885 (1.00) |
0.307 (1.00) |
0.00744 (0.672) |
0.0654 (1.00) |
0.311 (1.00) |
0.156 (1.00) |
0.517 (1.00) |
0.651 (1.00) |
| KDM5C | 18 (6%) | 275 |
0.598 (1.00) |
0.285 (1.00) |
0.71 (1.00) |
0.0388 (1.00) |
0.105 (1.00) |
0.671 (1.00) |
0.0516 (1.00) |
0.684 (1.00) |
0.754 (1.00) |
0.633 (1.00) |
||
| TP53 | 6 (2%) | 287 |
0.361 (1.00) |
0.538 (1.00) |
0.506 (1.00) |
0.427 (1.00) |
0.481 (1.00) |
0.245 (1.00) |
0.868 (1.00) |
0.0787 (1.00) |
1 (1.00) |
0.836 (1.00) |
||
| PTEN | 9 (3%) | 284 |
0.163 (1.00) |
0.118 (1.00) |
0.625 (1.00) |
0.321 (1.00) |
0.0869 (1.00) |
0.606 (1.00) |
0.00835 (0.735) |
0.0437 (1.00) |
0.412 (1.00) |
0.661 (1.00) |
||
| EBPL | 6 (2%) | 287 |
0.234 (1.00) |
0.795 (1.00) |
0.477 (1.00) |
0.414 (1.00) |
0.318 (1.00) |
0.174 (1.00) |
0.2 (1.00) |
0.313 (1.00) |
0.674 (1.00) |
0.673 (1.00) |
||
| TOR1A | 3 (1%) | 290 |
1 (1.00) |
0.828 (1.00) |
0.225 (1.00) |
0.563 (1.00) |
1 (1.00) |
0.8 (1.00) |
1 (1.00) |
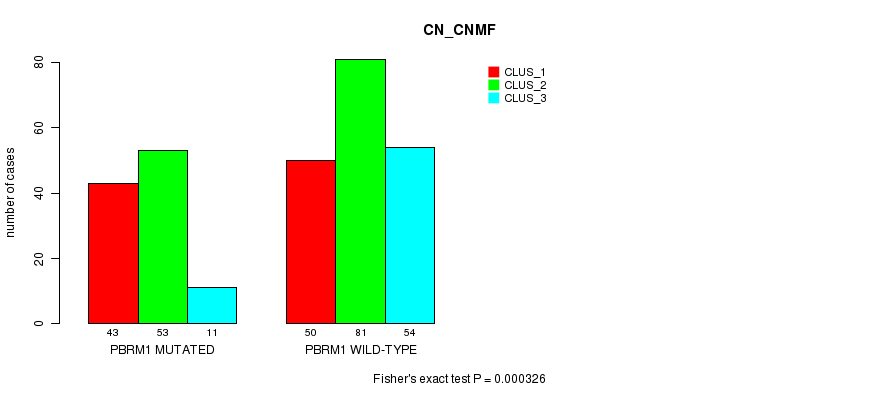
P value = 0.000326 (Fisher's exact test), Q value = 0.031
Table S1. Gene #1: 'PBRM1 MUTATION STATUS' versus Clinical Feature #3: 'CN_CNMF'
| nPatients | CLUS_1 | CLUS_2 | CLUS_3 |
|---|---|---|---|
| ALL | 93 | 134 | 65 |
| PBRM1 MUTATED | 43 | 53 | 11 |
| PBRM1 WILD-TYPE | 50 | 81 | 54 |
Figure S1. Get High-res Image Gene #1: 'PBRM1 MUTATION STATUS' versus Clinical Feature #3: 'CN_CNMF'
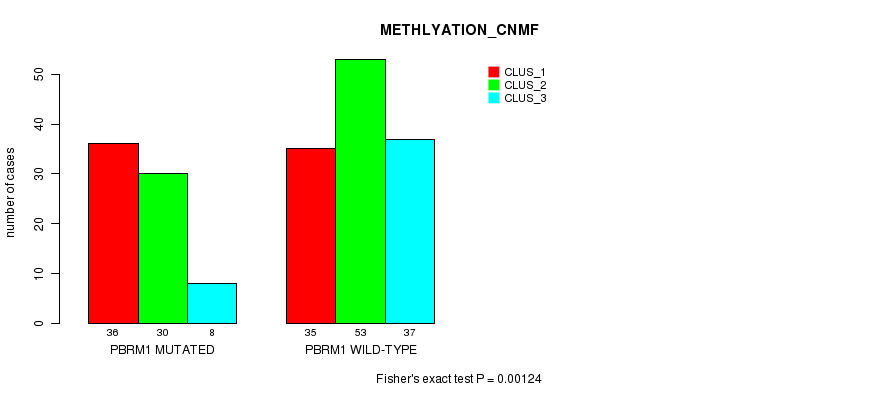
P value = 0.00124 (Fisher's exact test), Q value = 0.12
Table S2. Gene #1: 'PBRM1 MUTATION STATUS' versus Clinical Feature #4: 'METHLYATION_CNMF'
| nPatients | CLUS_1 | CLUS_2 | CLUS_3 |
|---|---|---|---|
| ALL | 71 | 83 | 45 |
| PBRM1 MUTATED | 36 | 30 | 8 |
| PBRM1 WILD-TYPE | 35 | 53 | 37 |
Figure S2. Get High-res Image Gene #1: 'PBRM1 MUTATION STATUS' versus Clinical Feature #4: 'METHLYATION_CNMF'
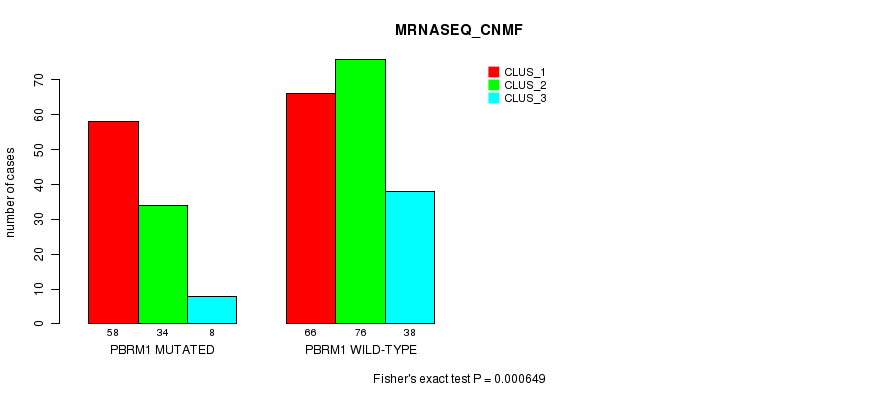
P value = 0.000649 (Fisher's exact test), Q value = 0.062
Table S3. Gene #1: 'PBRM1 MUTATION STATUS' versus Clinical Feature #7: 'MRNASEQ_CNMF'
| nPatients | CLUS_1 | CLUS_2 | CLUS_3 |
|---|---|---|---|
| ALL | 124 | 110 | 46 |
| PBRM1 MUTATED | 58 | 34 | 8 |
| PBRM1 WILD-TYPE | 66 | 76 | 38 |
Figure S3. Get High-res Image Gene #1: 'PBRM1 MUTATION STATUS' versus Clinical Feature #7: 'MRNASEQ_CNMF'
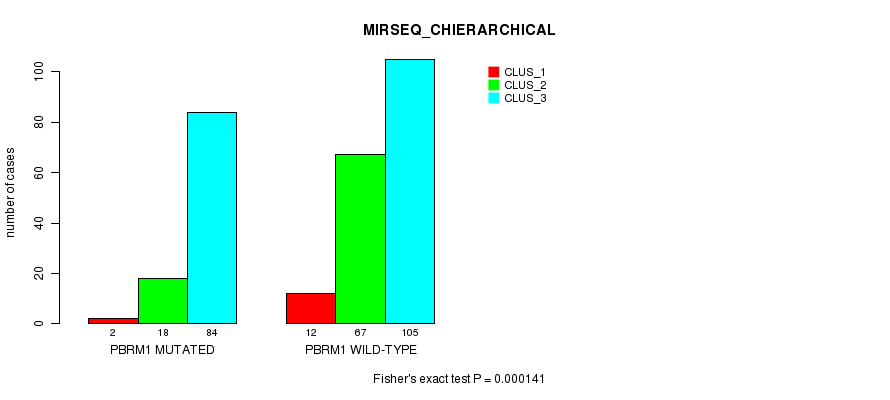
P value = 0.000141 (Fisher's exact test), Q value = 0.014
Table S4. Gene #1: 'PBRM1 MUTATION STATUS' versus Clinical Feature #10: 'MIRSEQ_CHIERARCHICAL'
| nPatients | CLUS_1 | CLUS_2 | CLUS_3 |
|---|---|---|---|
| ALL | 14 | 85 | 189 |
| PBRM1 MUTATED | 2 | 18 | 84 |
| PBRM1 WILD-TYPE | 12 | 67 | 105 |
Figure S4. Get High-res Image Gene #1: 'PBRM1 MUTATION STATUS' versus Clinical Feature #10: 'MIRSEQ_CHIERARCHICAL'
P value = 0.00145 (Fisher's exact test), Q value = 0.13
Table S5. Gene #4: 'BAP1 MUTATION STATUS' versus Clinical Feature #7: 'MRNASEQ_CNMF'
| nPatients | CLUS_1 | CLUS_2 | CLUS_3 |
|---|---|---|---|
| ALL | 124 | 110 | 46 |
| BAP1 MUTATED | 4 | 18 | 5 |
| BAP1 WILD-TYPE | 120 | 92 | 41 |
Figure S5. Get High-res Image Gene #4: 'BAP1 MUTATION STATUS' versus Clinical Feature #7: 'MRNASEQ_CNMF'
P value = 3.76e-08 (Fisher's exact test), Q value = 3.8e-06
Table S6. Gene #4: 'BAP1 MUTATION STATUS' versus Clinical Feature #8: 'MRNASEQ_CHIERARCHICAL'
| nPatients | CLUS_1 | CLUS_2 | CLUS_3 |
|---|---|---|---|
| ALL | 31 | 132 | 117 |
| BAP1 MUTATED | 1 | 1 | 25 |
| BAP1 WILD-TYPE | 30 | 131 | 92 |
Figure S6. Get High-res Image Gene #4: 'BAP1 MUTATION STATUS' versus Clinical Feature #8: 'MRNASEQ_CHIERARCHICAL'
P value = 0.000192 (Fisher's exact test), Q value = 0.019
Table S7. Gene #4: 'BAP1 MUTATION STATUS' versus Clinical Feature #9: 'MIRSEQ_CNMF'
| nPatients | CLUS_1 | CLUS_2 | CLUS_3 |
|---|---|---|---|
| ALL | 64 | 128 | 96 |
| BAP1 MUTATED | 7 | 3 | 17 |
| BAP1 WILD-TYPE | 57 | 125 | 79 |
Figure S7. Get High-res Image Gene #4: 'BAP1 MUTATION STATUS' versus Clinical Feature #9: 'MIRSEQ_CNMF'
P value = 9.92e-07 (Fisher's exact test), Q value = 9.9e-05
Table S8. Gene #4: 'BAP1 MUTATION STATUS' versus Clinical Feature #10: 'MIRSEQ_CHIERARCHICAL'
| nPatients | CLUS_1 | CLUS_2 | CLUS_3 |
|---|---|---|---|
| ALL | 14 | 85 | 189 |
| BAP1 MUTATED | 5 | 16 | 6 |
| BAP1 WILD-TYPE | 9 | 69 | 183 |
Figure S8. Get High-res Image Gene #4: 'BAP1 MUTATION STATUS' versus Clinical Feature #10: 'MIRSEQ_CHIERARCHICAL'
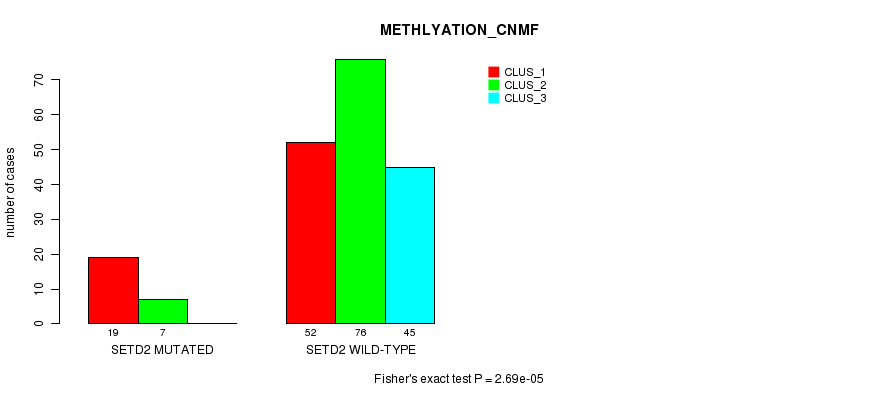
P value = 2.69e-05 (Fisher's exact test), Q value = 0.0027
Table S9. Gene #5: 'SETD2 MUTATION STATUS' versus Clinical Feature #4: 'METHLYATION_CNMF'
| nPatients | CLUS_1 | CLUS_2 | CLUS_3 |
|---|---|---|---|
| ALL | 71 | 83 | 45 |
| SETD2 MUTATED | 19 | 7 | 0 |
| SETD2 WILD-TYPE | 52 | 76 | 45 |
Figure S9. Get High-res Image Gene #5: 'SETD2 MUTATION STATUS' versus Clinical Feature #4: 'METHLYATION_CNMF'
-
Mutation data file = KIRC-TP.mutsig.cluster.txt
-
Molecular subtypes file = KIRC-TP.transferedmergedcluster.txt
-
Number of patients = 293
-
Number of significantly mutated genes = 10
-
Number of Molecular subtypes = 12
-
Exclude genes that fewer than K tumors have mutations, K = 3
For binary or multi-class clinical features (nominal or ordinal), two-tailed Fisher's exact tests (Fisher 1922) were used to estimate the P values using the 'fisher.test' function in R
For multi-class clinical features (nominal or ordinal), Chi-square tests (Greenwood and Nikulin 1996) were used to estimate the P values using the 'chisq.test' function in R
For multiple hypothesis correction, Q value is the False Discovery Rate (FDR) analogue of the P value (Benjamini and Hochberg 1995), defined as the minimum FDR at which the test may be called significant. We used the 'Benjamini and Hochberg' method of 'p.adjust' function in R to convert P values into Q values.
This is an experimental feature. The full results of the analysis summarized in this report can be downloaded from the TCGA Data Coordination Center.