This pipeline computes the correlation between significant arm-level copy number variations (cnvs) and selected clinical features.
Testing the association between copy number variation 80 arm-level results and 7 clinical features across 562 patients, 8 significant findings detected with Q value < 0.25.
-
2p gain cnv correlated to 'AGE'.
-
3q gain cnv correlated to 'AGE'.
-
10p gain cnv correlated to 'AGE'.
-
12p gain cnv correlated to 'AGE'.
-
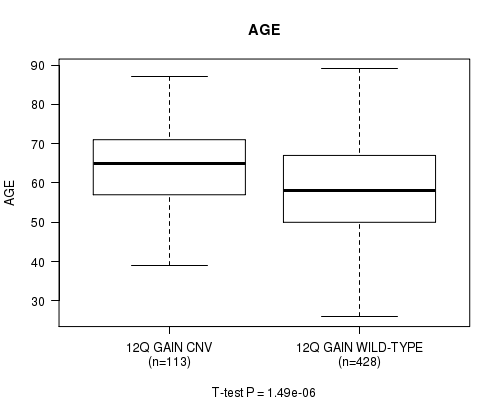
12q gain cnv correlated to 'AGE'.
-
20p gain cnv correlated to 'AGE'.
-
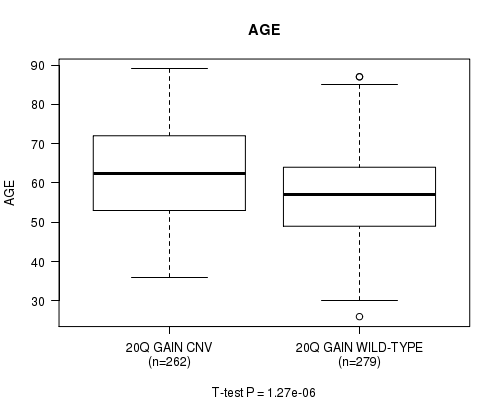
20q gain cnv correlated to 'AGE'.
-
9q loss cnv correlated to 'AGE'.
Table 1. Get Full Table Overview of the association between significant copy number variation of 80 arm-level results and 7 clinical features. Shown in the table are P values (Q values). Thresholded by Q value < 0.25, 8 significant findings detected.
|
Clinical Features |
Time to Death |
AGE |
PRIMARY SITE OF DISEASE |
KARNOFSKY PERFORMANCE SCORE |
TUMOR STAGE |
RADIATIONS RADIATION REGIMENINDICATION |
COMPLETENESS OF RESECTION |
||
| nCNV (%) | nWild-Type | logrank test | t-test | Fisher's exact test | t-test | Fisher's exact test | Fisher's exact test | Fisher's exact test | |
| 2p gain | 0 (0%) | 434 |
0.0322 (1.00) |
2.45e-07 (0.00013) |
1 (1.00) |
0.956 (1.00) |
0.474 (1.00) |
0.54 (1.00) |
1 (1.00) |
| 3q gain | 0 (0%) | 357 |
0.594 (1.00) |
7.84e-07 (0.000417) |
0.126 (1.00) |
0.671 (1.00) |
0.823 (1.00) |
0.557 (1.00) |
0.11 (1.00) |
| 10p gain | 0 (0%) | 432 |
0.217 (1.00) |
1.17e-05 (0.00614) |
0.107 (1.00) |
0.184 (1.00) |
0.787 (1.00) |
1 (1.00) |
0.529 (1.00) |
| 12p gain | 0 (0%) | 355 |
0.28 (1.00) |
3.52e-08 (1.88e-05) |
0.125 (1.00) |
0.0302 (1.00) |
0.754 (1.00) |
1 (1.00) |
0.658 (1.00) |
| 12q gain | 0 (0%) | 440 |
0.109 (1.00) |
1.49e-06 (0.000788) |
0.615 (1.00) |
0.0312 (1.00) |
1 (1.00) |
0.521 (1.00) |
0.62 (1.00) |
| 20p gain | 0 (0%) | 329 |
0.125 (1.00) |
2.92e-06 (0.00155) |
1 (1.00) |
0.105 (1.00) |
0.566 (1.00) |
0.573 (1.00) |
1 (1.00) |
| 20q gain | 0 (0%) | 290 |
0.0957 (1.00) |
1.27e-06 (0.000674) |
1 (1.00) |
0.229 (1.00) |
0.466 (1.00) |
0.613 (1.00) |
1 (1.00) |
| 9q loss | 0 (0%) | 322 |
0.507 (1.00) |
3.74e-06 (0.00198) |
0.152 (1.00) |
0.779 (1.00) |
0.787 (1.00) |
0.578 (1.00) |
0.872 (1.00) |
| 1p gain | 0 (0%) | 458 |
0.0923 (1.00) |
0.835 (1.00) |
0.155 (1.00) |
0.126 (1.00) |
0.0648 (1.00) |
0.0896 (1.00) |
0.108 (1.00) |
| 1q gain | 0 (0%) | 402 |
0.303 (1.00) |
0.0343 (1.00) |
0.068 (1.00) |
0.0331 (1.00) |
0.186 (1.00) |
1 (1.00) |
1 (1.00) |
| 2q gain | 0 (0%) | 460 |
0.111 (1.00) |
0.000516 (0.272) |
1 (1.00) |
0.69 (1.00) |
0.453 (1.00) |
0.0864 (1.00) |
1 (1.00) |
| 3p gain | 0 (0%) | 453 |
0.41 (1.00) |
0.0346 (1.00) |
0.575 (1.00) |
0.73 (1.00) |
0.259 (1.00) |
1 (1.00) |
0.567 (1.00) |
| 4p gain | 0 (0%) | 531 |
0.279 (1.00) |
0.575 (1.00) |
1 (1.00) |
0.921 (1.00) |
1 (1.00) |
1 (1.00) |
|
| 4q gain | 0 (0%) | 546 |
0.235 (1.00) |
0.0444 (1.00) |
1 (1.00) |
0.921 (1.00) |
1 (1.00) |
1 (1.00) |
|
| 5p gain | 0 (0%) | 418 |
0.528 (1.00) |
0.238 (1.00) |
0.124 (1.00) |
0.791 (1.00) |
0.48 (1.00) |
1 (1.00) |
0.0518 (1.00) |
| 5q gain | 0 (0%) | 529 |
0.309 (1.00) |
0.935 (1.00) |
0.207 (1.00) |
0.137 (1.00) |
0.417 (1.00) |
1 (1.00) |
0.251 (1.00) |
| 6p gain | 0 (0%) | 442 |
0.455 (1.00) |
0.00625 (1.00) |
0.619 (1.00) |
0.0337 (1.00) |
1 (1.00) |
1 (1.00) |
0.53 (1.00) |
| 6q gain | 0 (0%) | 500 |
0.51 (1.00) |
0.0516 (1.00) |
1 (1.00) |
0.195 (1.00) |
0.46 (1.00) |
1 (1.00) |
0.675 (1.00) |
| 7p gain | 0 (0%) | 438 |
0.205 (1.00) |
0.00153 (0.801) |
1 (1.00) |
0.292 (1.00) |
0.172 (1.00) |
1 (1.00) |
1 (1.00) |
| 7q gain | 0 (0%) | 412 |
0.19 (1.00) |
0.0107 (1.00) |
0.711 (1.00) |
0.276 (1.00) |
0.0198 (1.00) |
0.568 (1.00) |
0.76 (1.00) |
| 8p gain | 0 (0%) | 476 |
0.0823 (1.00) |
0.685 (1.00) |
1 (1.00) |
0.894 (1.00) |
0.179 (1.00) |
0.393 (1.00) |
1 (1.00) |
| 8q gain | 0 (0%) | 359 |
0.195 (1.00) |
0.589 (1.00) |
0.249 (1.00) |
0.88 (1.00) |
0.479 (1.00) |
1 (1.00) |
0.125 (1.00) |
| 9p gain | 0 (0%) | 503 |
0.74 (1.00) |
0.776 (1.00) |
1 (1.00) |
0.95 (1.00) |
0.764 (1.00) |
1 (1.00) |
0.675 (1.00) |
| 9q gain | 0 (0%) | 535 |
0.947 (1.00) |
0.656 (1.00) |
1 (1.00) |
0.351 (1.00) |
1 (1.00) |
1 (1.00) |
|
| 10q gain | 0 (0%) | 495 |
0.458 (1.00) |
0.0159 (1.00) |
0.405 (1.00) |
0.403 (1.00) |
0.684 (1.00) |
1 (1.00) |
0.576 (1.00) |
| 11p gain | 0 (0%) | 522 |
0.574 (1.00) |
0.85 (1.00) |
1 (1.00) |
0.852 (1.00) |
0.417 (1.00) |
1 (1.00) |
|
| 11q gain | 0 (0%) | 501 |
0.296 (1.00) |
0.471 (1.00) |
1 (1.00) |
0.566 (1.00) |
0.223 (1.00) |
1 (1.00) |
0.411 (1.00) |
| 13q gain | 0 (0%) | 521 |
0.708 (1.00) |
0.0264 (1.00) |
1 (1.00) |
0.476 (1.00) |
0.124 (1.00) |
0.204 (1.00) |
1 (1.00) |
| 14q gain | 0 (0%) | 529 |
0.311 (1.00) |
0.788 (1.00) |
1 (1.00) |
0.497 (1.00) |
0.532 (1.00) |
0.166 (1.00) |
0.411 (1.00) |
| 15q gain | 0 (0%) | 537 |
0.856 (1.00) |
0.353 (1.00) |
1 (1.00) |
1 (1.00) |
|||
| 16p gain | 0 (0%) | 531 |
0.612 (1.00) |
0.469 (1.00) |
1 (1.00) |
0.232 (1.00) |
0.282 (1.00) |
1 (1.00) |
0.277 (1.00) |
| 16q gain | 0 (0%) | 546 |
0.666 (1.00) |
0.751 (1.00) |
1 (1.00) |
1 (1.00) |
0.377 (1.00) |
||
| 17p gain | 0 (0%) | 551 |
0.16 (1.00) |
0.0794 (1.00) |
1 (1.00) |
0.767 (1.00) |
1 (1.00) |
||
| 17q gain | 0 (0%) | 539 |
0.169 (1.00) |
0.179 (1.00) |
1 (1.00) |
0.614 (1.00) |
1 (1.00) |
1 (1.00) |
|
| 18p gain | 0 (0%) | 488 |
0.149 (1.00) |
0.165 (1.00) |
1 (1.00) |
0.341 (1.00) |
0.544 (1.00) |
1 (1.00) |
0.778 (1.00) |
| 18q gain | 0 (0%) | 521 |
0.342 (1.00) |
0.34 (1.00) |
1 (1.00) |
0.252 (1.00) |
0.385 (1.00) |
0.204 (1.00) |
1 (1.00) |
| 19p gain | 0 (0%) | 464 |
0.333 (1.00) |
0.0145 (1.00) |
1 (1.00) |
0.996 (1.00) |
0.217 (1.00) |
0.438 (1.00) |
0.741 (1.00) |
| 19q gain | 0 (0%) | 471 |
0.147 (1.00) |
0.0146 (1.00) |
1 (1.00) |
0.649 (1.00) |
0.339 (1.00) |
0.412 (1.00) |
0.476 (1.00) |
| 21q gain | 0 (0%) | 492 |
0.00631 (1.00) |
0.0135 (1.00) |
0.405 (1.00) |
0.566 (1.00) |
0.243 (1.00) |
1 (1.00) |
0.576 (1.00) |
| 22q gain | 0 (0%) | 553 |
0.599 (1.00) |
0.293 (1.00) |
1 (1.00) |
1 (1.00) |
|||
| Xq gain | 0 (0%) | 528 |
0.0964 (1.00) |
0.203 (1.00) |
1 (1.00) |
0.137 (1.00) |
0.362 (1.00) |
1 (1.00) |
|
| 1p loss | 0 (0%) | 528 |
0.84 (1.00) |
0.415 (1.00) |
1 (1.00) |
0.296 (1.00) |
0.599 (1.00) |
0.171 (1.00) |
|
| 1q loss | 0 (0%) | 540 |
0.333 (1.00) |
0.0888 (1.00) |
1 (1.00) |
0.22 (1.00) |
0.362 (1.00) |
0.113 (1.00) |
|
| 2p loss | 0 (0%) | 536 |
0.58 (1.00) |
0.839 (1.00) |
1 (1.00) |
0.0731 (1.00) |
1 (1.00) |
1 (1.00) |
|
| 2q loss | 0 (0%) | 532 |
0.72 (1.00) |
0.458 (1.00) |
0.201 (1.00) |
0.0731 (1.00) |
1 (1.00) |
1 (1.00) |
|
| 3p loss | 0 (0%) | 503 |
0.319 (1.00) |
0.135 (1.00) |
0.365 (1.00) |
0.321 (1.00) |
0.172 (1.00) |
0.283 (1.00) |
0.0647 (1.00) |
| 3q loss | 0 (0%) | 539 |
0.137 (1.00) |
0.84 (1.00) |
0.157 (1.00) |
0.607 (1.00) |
0.282 (1.00) |
0.118 (1.00) |
|
| 4p loss | 0 (0%) | 303 |
0.271 (1.00) |
0.332 (1.00) |
0.166 (1.00) |
0.106 (1.00) |
0.627 (1.00) |
0.597 (1.00) |
1 (1.00) |
| 4q loss | 0 (0%) | 262 |
0.365 (1.00) |
0.188 (1.00) |
0.751 (1.00) |
0.952 (1.00) |
0.561 (1.00) |
1 (1.00) |
0.652 (1.00) |
| 5p loss | 0 (0%) | 479 |
0.286 (1.00) |
0.0298 (1.00) |
0.475 (1.00) |
0.227 (1.00) |
0.285 (1.00) |
1 (1.00) |
|
| 5q loss | 0 (0%) | 392 |
0.49 (1.00) |
0.131 (1.00) |
0.353 (1.00) |
0.42 (1.00) |
0.209 (1.00) |
1 (1.00) |
1 (1.00) |
| 6p loss | 0 (0%) | 437 |
0.0964 (1.00) |
0.00433 (1.00) |
0.633 (1.00) |
0.647 (1.00) |
0.849 (1.00) |
0.531 (1.00) |
0.189 (1.00) |
| 6q loss | 0 (0%) | 368 |
0.427 (1.00) |
0.00635 (1.00) |
0.116 (1.00) |
0.309 (1.00) |
0.439 (1.00) |
1 (1.00) |
1 (1.00) |
| 7p loss | 0 (0%) | 472 |
0.121 (1.00) |
0.983 (1.00) |
0.506 (1.00) |
0.0336 (1.00) |
0.362 (1.00) |
1 (1.00) |
0.277 (1.00) |
| 7q loss | 0 (0%) | 514 |
0.0391 (1.00) |
0.247 (1.00) |
0.306 (1.00) |
0.00339 (1.00) |
0.768 (1.00) |
0.235 (1.00) |
|
| 8p loss | 0 (0%) | 330 |
0.278 (1.00) |
0.0304 (1.00) |
0.146 (1.00) |
0.0388 (1.00) |
1 (1.00) |
1 (1.00) |
0.354 (1.00) |
| 8q loss | 0 (0%) | 500 |
0.38 (1.00) |
0.0258 (1.00) |
1 (1.00) |
0.331 (1.00) |
0.814 (1.00) |
1 (1.00) |
0.675 (1.00) |
| 9p loss | 0 (0%) | 350 |
0.568 (1.00) |
0.0342 (1.00) |
0.13 (1.00) |
0.479 (1.00) |
1 (1.00) |
0.56 (1.00) |
0.456 (1.00) |
| 10p loss | 0 (0%) | 496 |
0.659 (1.00) |
0.179 (1.00) |
1 (1.00) |
0.753 (1.00) |
0.242 (1.00) |
0.313 (1.00) |
0.778 (1.00) |
| 10q loss | 0 (0%) | 472 |
0.988 (1.00) |
0.331 (1.00) |
1 (1.00) |
0.809 (1.00) |
0.349 (1.00) |
0.00399 (1.00) |
1 (1.00) |
| 11p loss | 0 (0%) | 418 |
0.66 (1.00) |
0.0347 (1.00) |
1 (1.00) |
0.741 (1.00) |
0.313 (1.00) |
1 (1.00) |
1 (1.00) |
| 11q loss | 0 (0%) | 454 |
0.85 (1.00) |
0.143 (1.00) |
0.575 (1.00) |
0.17 (1.00) |
0.234 (1.00) |
0.473 (1.00) |
0.722 (1.00) |
| 12p loss | 0 (0%) | 512 |
0.815 (1.00) |
0.117 (1.00) |
1 (1.00) |
0.113 (1.00) |
0.46 (1.00) |
1 (1.00) |
|
| 12q loss | 0 (0%) | 488 |
0.295 (1.00) |
0.434 (1.00) |
1 (1.00) |
0.695 (1.00) |
0.348 (1.00) |
1 (1.00) |
1 (1.00) |
| 13q loss | 0 (0%) | 305 |
0.302 (1.00) |
0.849 (1.00) |
0.458 (1.00) |
0.683 (1.00) |
0.00742 (1.00) |
1 (1.00) |
1 (1.00) |
| 14q loss | 0 (0%) | 400 |
0.384 (1.00) |
0.123 (1.00) |
1 (1.00) |
0.706 (1.00) |
0.0695 (1.00) |
0.561 (1.00) |
0.457 (1.00) |
| 15q loss | 0 (0%) | 346 |
0.77 (1.00) |
0.0496 (1.00) |
0.273 (1.00) |
0.65 (1.00) |
0.114 (1.00) |
0.562 (1.00) |
1 (1.00) |
| 16p loss | 0 (0%) | 294 |
0.117 (1.00) |
0.97 (1.00) |
0.473 (1.00) |
0.259 (1.00) |
0.561 (1.00) |
0.608 (1.00) |
0.662 (1.00) |
| 16q loss | 0 (0%) | 206 |
0.18 (1.00) |
0.00336 (1.00) |
0.782 (1.00) |
0.0536 (1.00) |
0.285 (1.00) |
1 (1.00) |
1 (1.00) |
| 17p loss | 0 (0%) | 138 |
0.977 (1.00) |
0.0143 (1.00) |
0.255 (1.00) |
0.883 (1.00) |
0.486 (1.00) |
0.571 (1.00) |
0.47 (1.00) |
| 17q loss | 0 (0%) | 234 |
0.45 (1.00) |
0.0573 (1.00) |
1 (1.00) |
0.0547 (1.00) |
0.747 (1.00) |
0.27 (1.00) |
0.584 (1.00) |
| 18p loss | 0 (0%) | 379 |
0.433 (1.00) |
0.858 (1.00) |
0.795 (1.00) |
0.752 (1.00) |
1 (1.00) |
0.249 (1.00) |
0.875 (1.00) |
| 18q loss | 0 (0%) | 329 |
0.467 (1.00) |
0.819 (1.00) |
0.765 (1.00) |
0.65 (1.00) |
0.377 (1.00) |
0.573 (1.00) |
0.869 (1.00) |
| 19p loss | 0 (0%) | 419 |
0.907 (1.00) |
0.121 (1.00) |
0.691 (1.00) |
0.485 (1.00) |
0.583 (1.00) |
1 (1.00) |
0.139 (1.00) |
| 19q loss | 0 (0%) | 419 |
0.732 (1.00) |
0.747 (1.00) |
0.691 (1.00) |
0.407 (1.00) |
0.507 (1.00) |
0.574 (1.00) |
0.195 (1.00) |
| 20p loss | 0 (0%) | 525 |
0.0298 (1.00) |
0.205 (1.00) |
1 (1.00) |
0.00339 (1.00) |
0.819 (1.00) |
0.185 (1.00) |
|
| 20q loss | 0 (0%) | 540 |
0.0399 (1.00) |
0.789 (1.00) |
1 (1.00) |
0.00339 (1.00) |
0.749 (1.00) |
1 (1.00) |
|
| 21q loss | 0 (0%) | 414 |
0.75 (1.00) |
0.932 (1.00) |
1 (1.00) |
0.508 (1.00) |
0.867 (1.00) |
1 (1.00) |
0.423 (1.00) |
| 22q loss | 0 (0%) | 177 |
0.231 (1.00) |
0.217 (1.00) |
0.382 (1.00) |
0.954 (1.00) |
0.86 (1.00) |
0.555 (1.00) |
0.179 (1.00) |
| Xq loss | 0 (0%) | 462 |
0.297 (1.00) |
0.72 (1.00) |
0.548 (1.00) |
0.485 (1.00) |
0.185 (1.00) |
1 (1.00) |
0.167 (1.00) |
P value = 2.45e-07 (t-test), Q value = 0.00013
Table S1. Gene #3: '2p gain' versus Clinical Feature #2: 'AGE'
| nPatients | Mean (Std.Dev) | |
|---|---|---|
| ALL | 541 | 59.8 (11.6) |
| 2P GAIN CNV | 122 | 64.5 (11.0) |
| 2P GAIN WILD-TYPE | 419 | 58.4 (11.4) |
Figure S1. Get High-res Image Gene #3: '2p gain' versus Clinical Feature #2: 'AGE'

P value = 7.84e-07 (t-test), Q value = 0.00042
Table S2. Gene #6: '3q gain' versus Clinical Feature #2: 'AGE'
| nPatients | Mean (Std.Dev) | |
|---|---|---|
| ALL | 541 | 59.8 (11.6) |
| 3Q GAIN CNV | 199 | 63.0 (11.1) |
| 3Q GAIN WILD-TYPE | 342 | 57.9 (11.5) |
Figure S2. Get High-res Image Gene #6: '3q gain' versus Clinical Feature #2: 'AGE'

P value = 1.17e-05 (t-test), Q value = 0.0061
Table S3. Gene #19: '10p gain' versus Clinical Feature #2: 'AGE'
| nPatients | Mean (Std.Dev) | |
|---|---|---|
| ALL | 541 | 59.8 (11.6) |
| 10P GAIN CNV | 126 | 63.6 (10.6) |
| 10P GAIN WILD-TYPE | 415 | 58.6 (11.7) |
Figure S3. Get High-res Image Gene #19: '10p gain' versus Clinical Feature #2: 'AGE'

P value = 3.52e-08 (t-test), Q value = 1.9e-05
Table S4. Gene #23: '12p gain' versus Clinical Feature #2: 'AGE'
| nPatients | Mean (Std.Dev) | |
|---|---|---|
| ALL | 541 | 59.8 (11.6) |
| 12P GAIN CNV | 196 | 63.4 (11.2) |
| 12P GAIN WILD-TYPE | 345 | 57.7 (11.4) |
Figure S4. Get High-res Image Gene #23: '12p gain' versus Clinical Feature #2: 'AGE'

P value = 1.49e-06 (t-test), Q value = 0.00079
Table S5. Gene #24: '12q gain' versus Clinical Feature #2: 'AGE'
| nPatients | Mean (Std.Dev) | |
|---|---|---|
| ALL | 541 | 59.8 (11.6) |
| 12Q GAIN CNV | 113 | 64.3 (10.7) |
| 12Q GAIN WILD-TYPE | 428 | 58.6 (11.6) |
Figure S5. Get High-res Image Gene #24: '12q gain' versus Clinical Feature #2: 'AGE'
P value = 2.92e-06 (t-test), Q value = 0.0015
Table S6. Gene #36: '20p gain' versus Clinical Feature #2: 'AGE'
| nPatients | Mean (Std.Dev) | |
|---|---|---|
| ALL | 541 | 59.8 (11.6) |
| 20P GAIN CNV | 225 | 62.5 (11.4) |
| 20P GAIN WILD-TYPE | 316 | 57.8 (11.4) |
Figure S6. Get High-res Image Gene #36: '20p gain' versus Clinical Feature #2: 'AGE'

P value = 1.27e-06 (t-test), Q value = 0.00067
Table S7. Gene #37: '20q gain' versus Clinical Feature #2: 'AGE'
| nPatients | Mean (Std.Dev) | |
|---|---|---|
| ALL | 541 | 59.8 (11.6) |
| 20Q GAIN CNV | 262 | 62.3 (11.7) |
| 20Q GAIN WILD-TYPE | 279 | 57.5 (11.0) |
Figure S7. Get High-res Image Gene #37: '20q gain' versus Clinical Feature #2: 'AGE'
P value = 3.74e-06 (t-test), Q value = 0.002
Table S8. Gene #58: '9q loss' versus Clinical Feature #2: 'AGE'
| nPatients | Mean (Std.Dev) | |
|---|---|---|
| ALL | 541 | 59.8 (11.6) |
| 9Q LOSS CNV | 229 | 62.5 (11.3) |
| 9Q LOSS WILD-TYPE | 312 | 57.8 (11.5) |
Figure S8. Get High-res Image Gene #58: '9q loss' versus Clinical Feature #2: 'AGE'

-
Mutation data file = broad_values_by_arm.mutsig.cluster.txt
-
Clinical data file = OV-TP.clin.merged.picked.txt
-
Number of patients = 562
-
Number of significantly arm-level cnvs = 80
-
Number of selected clinical features = 7
-
Exclude genes that fewer than K tumors have mutations, K = 3
For survival clinical features, the Kaplan-Meier survival curves of tumors with and without gene mutations were plotted and the statistical significance P values were estimated by logrank test (Bland and Altman 2004) using the 'survdiff' function in R
For continuous numerical clinical features, two-tailed Student's t test with unequal variance (Lehmann and Romano 2005) was applied to compare the clinical values between tumors with and without gene mutations using 't.test' function in R
For binary or multi-class clinical features (nominal or ordinal), two-tailed Fisher's exact tests (Fisher 1922) were used to estimate the P values using the 'fisher.test' function in R
For multiple hypothesis correction, Q value is the False Discovery Rate (FDR) analogue of the P value (Benjamini and Hochberg 1995), defined as the minimum FDR at which the test may be called significant. We used the 'Benjamini and Hochberg' method of 'p.adjust' function in R to convert P values into Q values.
This is an experimental feature. The full results of the analysis summarized in this report can be downloaded from the TCGA Data Coordination Center.