This pipeline computes the correlation between significant copy number variation (cnv focal) genes and selected clinical features.
Testing the association between copy number variation 69 arm-level results and 7 clinical features across 562 patients, 10 significant findings detected with Q value < 0.25.
-
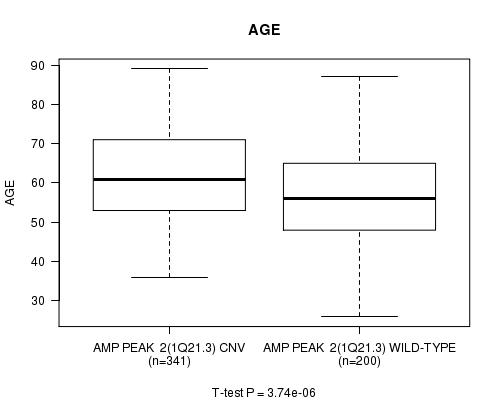
Amp Peak 2(1q21.3) cnv correlated to 'AGE'.
-
Amp Peak 12(8p11.21) cnv correlated to 'AGE'.
-
Amp Peak 14(10p15.3) cnv correlated to 'AGE'.
-
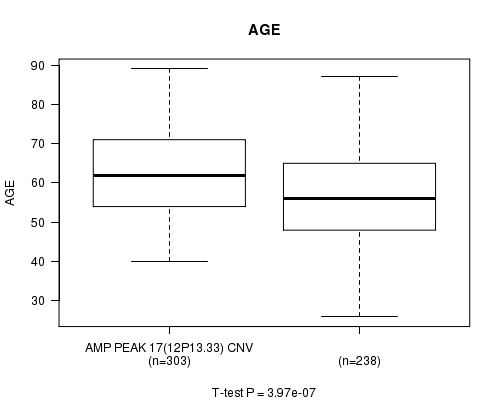
Amp Peak 17(12p13.33) cnv correlated to 'AGE'.
-
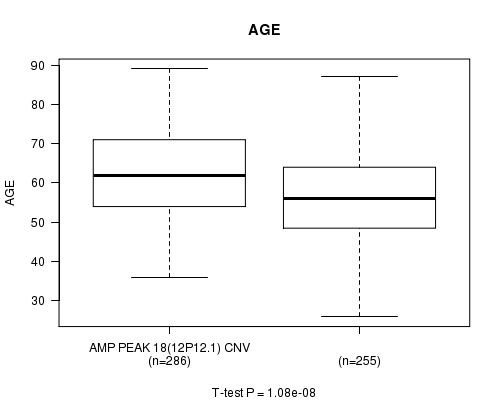
Amp Peak 18(12p12.1) cnv correlated to 'AGE'.
-
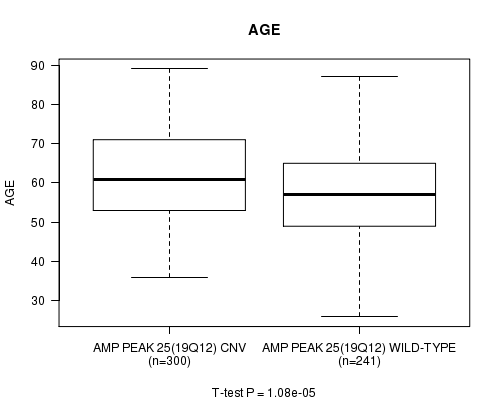
Amp Peak 25(19q12) cnv correlated to 'AGE'.
-
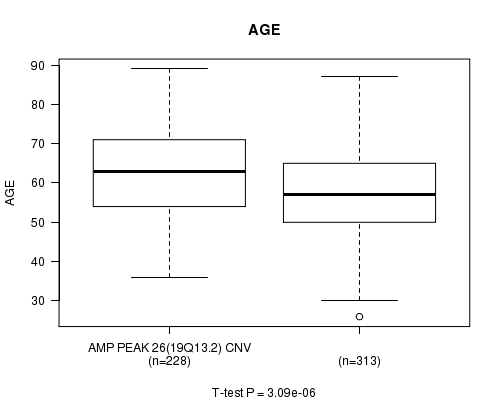
Amp Peak 26(19q13.2) cnv correlated to 'AGE'.
-
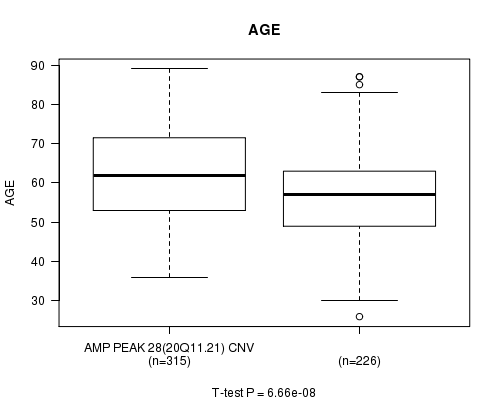
Amp Peak 28(20q11.21) cnv correlated to 'AGE'.
-
Amp Peak 29(20q13.33) cnv correlated to 'AGE'.
-
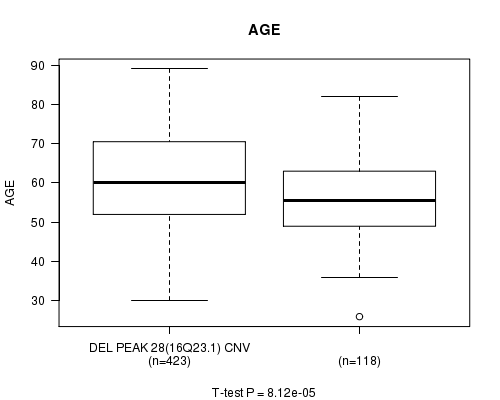
Del Peak 28(16q23.1) cnv correlated to 'AGE'.
Table 1. Get Full Table Overview of the association between significant copy number variation of 69 arm-level results and 7 clinical features. Shown in the table are P values (Q values). Thresholded by Q value < 0.25, 10 significant findings detected.
|
Clinical Features |
Time to Death |
AGE |
PRIMARY SITE OF DISEASE |
KARNOFSKY PERFORMANCE SCORE |
TUMOR STAGE |
RADIATIONS RADIATION REGIMENINDICATION |
COMPLETENESS OF RESECTION |
||
| nCNV (%) | nWild-Type | logrank test | t-test | Fisher's exact test | t-test | Fisher's exact test | Fisher's exact test | Fisher's exact test | |
| Amp Peak 2(1q21 3) | 0 (0%) | 209 |
0.272 (1.00) |
3.74e-06 (0.00179) |
0.128 (1.00) |
0.408 (1.00) |
0.21 (1.00) |
1 (1.00) |
0.345 (1.00) |
| Amp Peak 12(8p11 21) | 0 (0%) | 360 |
0.298 (1.00) |
0.000504 (0.238) |
0.121 (1.00) |
0.662 (1.00) |
0.633 (1.00) |
0.294 (1.00) |
0.152 (1.00) |
| Amp Peak 14(10p15 3) | 0 (0%) | 323 |
0.114 (1.00) |
0.000403 (0.191) |
0.154 (1.00) |
0.923 (1.00) |
0.257 (1.00) |
0.578 (1.00) |
0.721 (1.00) |
| Amp Peak 17(12p13 33) | 0 (0%) | 247 |
0.733 (1.00) |
3.97e-07 (0.00019) |
0.756 (1.00) |
0.735 (1.00) |
0.356 (1.00) |
1 (1.00) |
0.252 (1.00) |
| Amp Peak 18(12p12 1) | 0 (0%) | 262 |
0.0821 (1.00) |
1.08e-08 (5.2e-06) |
0.251 (1.00) |
0.335 (1.00) |
0.244 (1.00) |
0.601 (1.00) |
1 (1.00) |
| Amp Peak 25(19q12) | 0 (0%) | 252 |
0.567 (1.00) |
1.08e-05 (0.00512) |
0.162 (1.00) |
0.51 (1.00) |
0.876 (1.00) |
1 (1.00) |
1 (1.00) |
| Amp Peak 26(19q13 2) | 0 (0%) | 327 |
0.0168 (1.00) |
3.09e-06 (0.00148) |
0.15 (1.00) |
0.989 (1.00) |
0.505 (1.00) |
0.574 (1.00) |
0.189 (1.00) |
| Amp Peak 28(20q11 21) | 0 (0%) | 234 |
0.0949 (1.00) |
6.66e-08 (3.2e-05) |
1 (1.00) |
0.264 (1.00) |
0.673 (1.00) |
1 (1.00) |
0.616 (1.00) |
| Amp Peak 29(20q13 33) | 0 (0%) | 173 |
0.313 (1.00) |
9.79e-06 (0.00467) |
1 (1.00) |
0.752 (1.00) |
1 (1.00) |
1 (1.00) |
0.0548 (1.00) |
| Del Peak 28(16q23 1) | 0 (0%) | 125 |
0.153 (1.00) |
8.12e-05 (0.0386) |
0.636 (1.00) |
0.0778 (1.00) |
0.0432 (1.00) |
1 (1.00) |
0.195 (1.00) |
| Amp Peak 1(1p34 3) | 0 (0%) | 282 |
0.0291 (1.00) |
0.00905 (1.00) |
1 (1.00) |
0.985 (1.00) |
0.764 (1.00) |
0.123 (1.00) |
0.379 (1.00) |
| Amp Peak 3(1q42 2) | 0 (0%) | 256 |
0.267 (1.00) |
0.000591 (0.279) |
0.252 (1.00) |
0.736 (1.00) |
0.66 (1.00) |
0.594 (1.00) |
0.836 (1.00) |
| Amp Peak 4(2p23 2) | 0 (0%) | 327 |
0.954 (1.00) |
0.0822 (1.00) |
0.762 (1.00) |
0.988 (1.00) |
0.506 (1.00) |
1 (1.00) |
0.585 (1.00) |
| Amp Peak 5(2q31 2) | 0 (0%) | 314 |
0.157 (1.00) |
0.0142 (1.00) |
0.756 (1.00) |
0.693 (1.00) |
0.907 (1.00) |
0.0853 (1.00) |
0.873 (1.00) |
| Amp Peak 6(3q26 2) | 0 (0%) | 96 |
0.918 (1.00) |
0.000788 (0.37) |
0.527 (1.00) |
0.00131 (0.613) |
0.35 (1.00) |
1 (1.00) |
0.778 (1.00) |
| Amp Peak 7(4p16 3) | 0 (0%) | 407 |
0.479 (1.00) |
0.67 (1.00) |
0.723 (1.00) |
0.0728 (1.00) |
0.668 (1.00) |
1 (1.00) |
0.529 (1.00) |
| Amp Peak 8(4q13 3) | 0 (0%) | 456 |
0.216 (1.00) |
0.204 (1.00) |
0.571 (1.00) |
0.42 (1.00) |
0.764 (1.00) |
1 (1.00) |
0.411 (1.00) |
| Amp Peak 9(5p15 33) | 0 (0%) | 266 |
0.0615 (1.00) |
0.00255 (1.00) |
0.751 (1.00) |
0.798 (1.00) |
0.523 (1.00) |
0.605 (1.00) |
0.0391 (1.00) |
| Amp Peak 10(6p22 3) | 0 (0%) | 277 |
0.148 (1.00) |
0.00508 (1.00) |
1 (1.00) |
0.545 (1.00) |
0.333 (1.00) |
0.619 (1.00) |
0.45 (1.00) |
| Amp Peak 11(7q36 3) | 0 (0%) | 262 |
0.264 (1.00) |
0.841 (1.00) |
1 (1.00) |
0.1 (1.00) |
0.7 (1.00) |
0.601 (1.00) |
0.152 (1.00) |
| Amp Peak 13(8q24 21) | 0 (0%) | 121 |
0.621 (1.00) |
0.0972 (1.00) |
1 (1.00) |
0.628 (1.00) |
0.192 (1.00) |
0.518 (1.00) |
0.391 (1.00) |
| Amp Peak 15(10q22 3) | 0 (0%) | 388 |
0.499 (1.00) |
0.216 (1.00) |
0.0934 (1.00) |
0.989 (1.00) |
0.359 (1.00) |
1 (1.00) |
0.415 (1.00) |
| Amp Peak 16(11q14 1) | 0 (0%) | 314 |
0.331 (1.00) |
0.326 (1.00) |
0.256 (1.00) |
0.474 (1.00) |
0.648 (1.00) |
1 (1.00) |
1 (1.00) |
| Amp Peak 19(14q11 2) | 0 (0%) | 420 |
0.777 (1.00) |
0.0633 (1.00) |
0.124 (1.00) |
0.378 (1.00) |
0.112 (1.00) |
1 (1.00) |
0.812 (1.00) |
| Amp Peak 20(14q32 33) | 0 (0%) | 412 |
0.204 (1.00) |
0.0168 (1.00) |
0.711 (1.00) |
0.113 (1.00) |
0.13 (1.00) |
0.175 (1.00) |
1 (1.00) |
| Amp Peak 21(15q26 3) | 0 (0%) | 408 |
0.0666 (1.00) |
0.291 (1.00) |
0.728 (1.00) |
0.42 (1.00) |
0.479 (1.00) |
0.565 (1.00) |
1 (1.00) |
| Amp Peak 22(17q25 3) | 0 (0%) | 358 |
0.0266 (1.00) |
0.77 (1.00) |
1 (1.00) |
0.685 (1.00) |
0.293 (1.00) |
1 (1.00) |
0.0807 (1.00) |
| Amp Peak 23(18q11 2) | 0 (0%) | 426 |
0.995 (1.00) |
0.0427 (1.00) |
0.114 (1.00) |
0.18 (1.00) |
0.666 (1.00) |
0.565 (1.00) |
0.837 (1.00) |
| Amp Peak 24(19p13 12) | 0 (0%) | 258 |
0.219 (1.00) |
0.0684 (1.00) |
0.461 (1.00) |
0.597 (1.00) |
0.75 (1.00) |
0.596 (1.00) |
0.404 (1.00) |
| Amp Peak 27(20p13) | 0 (0%) | 253 |
0.3 (1.00) |
0.00193 (0.904) |
0.754 (1.00) |
0.11 (1.00) |
0.872 (1.00) |
1 (1.00) |
0.381 (1.00) |
| Amp Peak 30(22q12 2) | 0 (0%) | 474 |
0.53 (1.00) |
0.0234 (1.00) |
1 (1.00) |
0.419 (1.00) |
0.583 (1.00) |
1 (1.00) |
1 (1.00) |
| Amp Peak 31(Xp11 23) | 0 (0%) | 399 |
0.156 (1.00) |
0.0215 (1.00) |
0.0781 (1.00) |
0.275 (1.00) |
0.609 (1.00) |
0.56 (1.00) |
0.192 (1.00) |
| Amp Peak 32(Xq28) | 0 (0%) | 341 |
0.332 (1.00) |
0.956 (1.00) |
0.77 (1.00) |
0.654 (1.00) |
0.0887 (1.00) |
0.0603 (1.00) |
0.818 (1.00) |
| Del Peak 1(1p36 11) | 0 (0%) | 301 |
0.153 (1.00) |
0.194 (1.00) |
0.751 (1.00) |
0.427 (1.00) |
0.399 (1.00) |
1 (1.00) |
0.818 (1.00) |
| Del Peak 2(1q32 3) | 0 (0%) | 470 |
0.94 (1.00) |
0.512 (1.00) |
1 (1.00) |
0.287 (1.00) |
0.309 (1.00) |
0.416 (1.00) |
|
| Del Peak 3(2p25 3) | 0 (0%) | 444 |
0.899 (1.00) |
0.452 (1.00) |
0.615 (1.00) |
0.875 (1.00) |
1 (1.00) |
0.508 (1.00) |
0.0216 (1.00) |
| Del Peak 4(2q22 1) | 0 (0%) | 431 |
0.265 (1.00) |
0.378 (1.00) |
0.656 (1.00) |
0.595 (1.00) |
1 (1.00) |
1 (1.00) |
0.427 (1.00) |
| Del Peak 5(2q37 3) | 0 (0%) | 391 |
0.434 (1.00) |
0.0991 (1.00) |
0.359 (1.00) |
0.432 (1.00) |
0.816 (1.00) |
0.221 (1.00) |
0.253 (1.00) |
| Del Peak 6(3p26 2) | 0 (0%) | 355 |
0.853 (1.00) |
0.00233 (1.00) |
0.126 (1.00) |
0.246 (1.00) |
0.429 (1.00) |
0.0495 (1.00) |
0.287 (1.00) |
| Del Peak 7(4q22 1) | 0 (0%) | 183 |
0.538 (1.00) |
0.938 (1.00) |
1 (1.00) |
0.925 (1.00) |
0.0917 (1.00) |
1 (1.00) |
0.363 (1.00) |
| Del Peak 8(4q34 3) | 0 (0%) | 155 |
0.826 (1.00) |
0.353 (1.00) |
0.728 (1.00) |
0.171 (1.00) |
0.0969 (1.00) |
0.565 (1.00) |
0.386 (1.00) |
| Del Peak 9(5q11 2) | 0 (0%) | 227 |
0.685 (1.00) |
0.641 (1.00) |
0.767 (1.00) |
0.325 (1.00) |
0.0943 (1.00) |
0.568 (1.00) |
0.23 (1.00) |
| Del Peak 10(5q13 2) | 0 (0%) | 162 |
0.224 (1.00) |
0.934 (1.00) |
0.747 (1.00) |
0.216 (1.00) |
0.675 (1.00) |
0.201 (1.00) |
0.265 (1.00) |
| Del Peak 11(6q27) | 0 (0%) | 187 |
0.27 (1.00) |
0.00067 (0.315) |
1 (1.00) |
0.508 (1.00) |
0.107 (1.00) |
1 (1.00) |
0.794 (1.00) |
| Del Peak 12(7p22 1) | 0 (0%) | 318 |
0.0812 (1.00) |
0.0274 (1.00) |
0.758 (1.00) |
0.497 (1.00) |
0.81 (1.00) |
1 (1.00) |
0.123 (1.00) |
| Del Peak 13(8p23 3) | 0 (0%) | 185 |
0.29 (1.00) |
0.0597 (1.00) |
1 (1.00) |
0.95 (1.00) |
0.858 (1.00) |
1 (1.00) |
0.859 (1.00) |
| Del Peak 14(8p21 2) | 0 (0%) | 170 |
0.646 (1.00) |
0.0667 (1.00) |
1 (1.00) |
0.647 (1.00) |
0.403 (1.00) |
1 (1.00) |
0.592 (1.00) |
| Del Peak 15(9p24 3) | 0 (0%) | 309 |
0.892 (1.00) |
0.0238 (1.00) |
0.45 (1.00) |
0.928 (1.00) |
1 (1.00) |
0.591 (1.00) |
0.53 (1.00) |
| Del Peak 16(9q34 13) | 0 (0%) | 226 |
0.749 (1.00) |
0.0421 (1.00) |
0.767 (1.00) |
0.623 (1.00) |
1 (1.00) |
0.277 (1.00) |
0.148 (1.00) |
| Del Peak 17(10p15 3) | 0 (0%) | 444 |
0.322 (1.00) |
0.839 (1.00) |
0.608 (1.00) |
0.72 (1.00) |
0.0374 (1.00) |
0.508 (1.00) |
1 (1.00) |
| Del Peak 18(10q23 31) | 0 (0%) | 343 |
0.307 (1.00) |
0.995 (1.00) |
1 (1.00) |
0.393 (1.00) |
0.268 (1.00) |
0.563 (1.00) |
0.601 (1.00) |
| Del Peak 19(10q26 3) | 0 (0%) | 373 |
0.0765 (1.00) |
0.817 (1.00) |
0.8 (1.00) |
0.77 (1.00) |
0.305 (1.00) |
1 (1.00) |
1 (1.00) |
| Del Peak 20(11p15 5) | 0 (0%) | 230 |
0.0435 (1.00) |
0.55 (1.00) |
0.0267 (1.00) |
0.267 (1.00) |
0.638 (1.00) |
1 (1.00) |
0.585 (1.00) |
| Del Peak 21(11q25) | 0 (0%) | 369 |
0.544 (1.00) |
0.0771 (1.00) |
0.225 (1.00) |
0.631 (1.00) |
0.147 (1.00) |
0.272 (1.00) |
0.253 (1.00) |
| Del Peak 22(12q24 33) | 0 (0%) | 351 |
0.688 (1.00) |
0.106 (1.00) |
0.13 (1.00) |
0.652 (1.00) |
0.468 (1.00) |
0.295 (1.00) |
0.0793 (1.00) |
| Del Peak 23(13q14 2) | 0 (0%) | 213 |
0.0607 (1.00) |
0.549 (1.00) |
0.777 (1.00) |
0.592 (1.00) |
0.213 (1.00) |
0.56 (1.00) |
0.205 (1.00) |
| Del Peak 24(14q23 3) | 0 (0%) | 267 |
0.488 (1.00) |
0.604 (1.00) |
0.475 (1.00) |
0.0123 (1.00) |
0.323 (1.00) |
0.107 (1.00) |
0.379 (1.00) |
| Del Peak 25(15q15 1) | 0 (0%) | 209 |
0.631 (1.00) |
0.00534 (1.00) |
0.411 (1.00) |
0.253 (1.00) |
0.61 (1.00) |
0.298 (1.00) |
0.803 (1.00) |
| Del Peak 26(16p13 3) | 0 (0%) | 263 |
0.843 (1.00) |
0.867 (1.00) |
0.751 (1.00) |
0.578 (1.00) |
0.908 (1.00) |
0.602 (1.00) |
0.733 (1.00) |
| Del Peak 27(16q22 1) | 0 (0%) | 115 |
0.625 (1.00) |
0.00438 (1.00) |
0.193 (1.00) |
0.275 (1.00) |
0.0762 (1.00) |
1 (1.00) |
0.329 (1.00) |
| Del Peak 29(17p12) | 0 (0%) | 87 |
0.818 (1.00) |
0.99 (1.00) |
0.493 (1.00) |
0.73 (1.00) |
0.588 (1.00) |
1 (1.00) |
0.47 (1.00) |
| Del Peak 30(17q11 2) | 0 (0%) | 102 |
0.618 (1.00) |
0.0323 (1.00) |
0.0666 (1.00) |
0.686 (1.00) |
0.756 (1.00) |
1 (1.00) |
0.873 (1.00) |
| Del Peak 31(18q23) | 0 (0%) | 194 |
0.704 (1.00) |
0.464 (1.00) |
0.225 (1.00) |
0.544 (1.00) |
1 (1.00) |
1 (1.00) |
1 (1.00) |
| Del Peak 32(19p13 3) | 0 (0%) | 67 |
0.244 (1.00) |
0.0168 (1.00) |
1 (1.00) |
0.00833 (1.00) |
0.655 (1.00) |
1 (1.00) |
0.423 (1.00) |
| Del Peak 33(19q13 33) | 0 (0%) | 271 |
0.563 (1.00) |
0.343 (1.00) |
1 (1.00) |
0.311 (1.00) |
0.0136 (1.00) |
0.25 (1.00) |
0.292 (1.00) |
| Del Peak 34(19q13 43) | 0 (0%) | 286 |
0.359 (1.00) |
0.03 (1.00) |
1 (1.00) |
0.283 (1.00) |
0.0105 (1.00) |
1 (1.00) |
0.252 (1.00) |
| Del Peak 35(21q22 3) | 0 (0%) | 345 |
0.554 (1.00) |
0.341 (1.00) |
0.774 (1.00) |
0.665 (1.00) |
0.778 (1.00) |
1 (1.00) |
0.585 (1.00) |
| Del Peak 36(22q13 32) | 0 (0%) | 75 |
0.861 (1.00) |
0.909 (1.00) |
0.443 (1.00) |
0.752 (1.00) |
0.375 (1.00) |
1 (1.00) |
0.675 (1.00) |
| Del Peak 37(Xp21 1) | 0 (0%) | 202 |
0.804 (1.00) |
0.384 (1.00) |
1 (1.00) |
0.987 (1.00) |
0.178 (1.00) |
0.556 (1.00) |
0.733 (1.00) |
P value = 3.74e-06 (t-test), Q value = 0.0018
Table S1. Gene #2: 'Amp Peak 2(1q21.3)' versus Clinical Feature #2: 'AGE'
| nPatients | Mean (Std.Dev) | |
|---|---|---|
| ALL | 541 | 59.8 (11.6) |
| AMP PEAK 2(1Q21.3) CNV | 341 | 61.6 (11.0) |
| AMP PEAK 2(1Q21.3) WILD-TYPE | 200 | 56.7 (12.0) |
Figure S1. Get High-res Image Gene #2: 'Amp Peak 2(1q21.3)' versus Clinical Feature #2: 'AGE'
P value = 0.000504 (t-test), Q value = 0.24
Table S2. Gene #12: 'Amp Peak 12(8p11.21)' versus Clinical Feature #2: 'AGE'
| nPatients | Mean (Std.Dev) | |
|---|---|---|
| ALL | 541 | 59.8 (11.6) |
| AMP PEAK 12(8P11.21) CNV | 192 | 62.1 (10.8) |
| AMP PEAK 12(8P11.21) WILD-TYPE | 349 | 58.5 (11.8) |
Figure S2. Get High-res Image Gene #12: 'Amp Peak 12(8p11.21)' versus Clinical Feature #2: 'AGE'

P value = 0.000403 (t-test), Q value = 0.19
Table S3. Gene #14: 'Amp Peak 14(10p15.3)' versus Clinical Feature #2: 'AGE'
| nPatients | Mean (Std.Dev) | |
|---|---|---|
| ALL | 541 | 59.8 (11.6) |
| AMP PEAK 14(10P15.3) CNV | 233 | 61.8 (11.2) |
| AMP PEAK 14(10P15.3) WILD-TYPE | 308 | 58.3 (11.7) |
Figure S3. Get High-res Image Gene #14: 'Amp Peak 14(10p15.3)' versus Clinical Feature #2: 'AGE'

P value = 3.97e-07 (t-test), Q value = 0.00019
Table S4. Gene #17: 'Amp Peak 17(12p13.33)' versus Clinical Feature #2: 'AGE'
| nPatients | Mean (Std.Dev) | |
|---|---|---|
| ALL | 541 | 59.8 (11.6) |
| AMP PEAK 17(12P13.33) CNV | 303 | 62.0 (10.8) |
| AMP PEAK 17(12P13.33) WILD-TYPE | 238 | 56.9 (12.0) |
Figure S4. Get High-res Image Gene #17: 'Amp Peak 17(12p13.33)' versus Clinical Feature #2: 'AGE'
P value = 1.08e-08 (t-test), Q value = 5.2e-06
Table S5. Gene #18: 'Amp Peak 18(12p12.1)' versus Clinical Feature #2: 'AGE'
| nPatients | Mean (Std.Dev) | |
|---|---|---|
| ALL | 541 | 59.8 (11.6) |
| AMP PEAK 18(12P12.1) CNV | 286 | 62.5 (11.2) |
| AMP PEAK 18(12P12.1) WILD-TYPE | 255 | 56.8 (11.4) |
Figure S5. Get High-res Image Gene #18: 'Amp Peak 18(12p12.1)' versus Clinical Feature #2: 'AGE'
P value = 1.08e-05 (t-test), Q value = 0.0051
Table S6. Gene #25: 'Amp Peak 25(19q12)' versus Clinical Feature #2: 'AGE'
| nPatients | Mean (Std.Dev) | |
|---|---|---|
| ALL | 541 | 59.8 (11.6) |
| AMP PEAK 25(19Q12) CNV | 300 | 61.8 (11.1) |
| AMP PEAK 25(19Q12) WILD-TYPE | 241 | 57.3 (11.8) |
Figure S6. Get High-res Image Gene #25: 'Amp Peak 25(19q12)' versus Clinical Feature #2: 'AGE'
P value = 3.09e-06 (t-test), Q value = 0.0015
Table S7. Gene #26: 'Amp Peak 26(19q13.2)' versus Clinical Feature #2: 'AGE'
| nPatients | Mean (Std.Dev) | |
|---|---|---|
| ALL | 541 | 59.8 (11.6) |
| AMP PEAK 26(19Q13.2) CNV | 228 | 62.5 (11.2) |
| AMP PEAK 26(19Q13.2) WILD-TYPE | 313 | 57.8 (11.5) |
Figure S7. Get High-res Image Gene #26: 'Amp Peak 26(19q13.2)' versus Clinical Feature #2: 'AGE'
P value = 6.66e-08 (t-test), Q value = 3.2e-05
Table S8. Gene #28: 'Amp Peak 28(20q11.21)' versus Clinical Feature #2: 'AGE'
| nPatients | Mean (Std.Dev) | |
|---|---|---|
| ALL | 541 | 59.8 (11.6) |
| AMP PEAK 28(20Q11.21) CNV | 315 | 62.0 (11.5) |
| AMP PEAK 28(20Q11.21) WILD-TYPE | 226 | 56.7 (11.0) |
Figure S8. Get High-res Image Gene #28: 'Amp Peak 28(20q11.21)' versus Clinical Feature #2: 'AGE'
P value = 9.79e-06 (t-test), Q value = 0.0047
Table S9. Gene #29: 'Amp Peak 29(20q13.33)' versus Clinical Feature #2: 'AGE'
| nPatients | Mean (Std.Dev) | |
|---|---|---|
| ALL | 541 | 59.8 (11.6) |
| AMP PEAK 29(20Q13.33) CNV | 376 | 61.2 (11.5) |
| AMP PEAK 29(20Q13.33) WILD-TYPE | 165 | 56.5 (11.1) |
Figure S9. Get High-res Image Gene #29: 'Amp Peak 29(20q13.33)' versus Clinical Feature #2: 'AGE'

P value = 8.12e-05 (t-test), Q value = 0.039
Table S10. Gene #60: 'Del Peak 28(16q23.1)' versus Clinical Feature #2: 'AGE'
| nPatients | Mean (Std.Dev) | |
|---|---|---|
| ALL | 541 | 59.8 (11.6) |
| DEL PEAK 28(16Q23.1) CNV | 423 | 60.8 (11.5) |
| DEL PEAK 28(16Q23.1) WILD-TYPE | 118 | 56.1 (11.2) |
Figure S10. Get High-res Image Gene #60: 'Del Peak 28(16q23.1)' versus Clinical Feature #2: 'AGE'
-
Mutation data file = all_lesions.conf_99.cnv.cluster.txt
-
Clinical data file = OV-TP.clin.merged.picked.txt
-
Number of patients = 562
-
Number of significantly arm-level cnvs = 69
-
Number of selected clinical features = 7
-
Exclude genes that fewer than K tumors have mutations, K = 3
For survival clinical features, the Kaplan-Meier survival curves of tumors with and without gene mutations were plotted and the statistical significance P values were estimated by logrank test (Bland and Altman 2004) using the 'survdiff' function in R
For continuous numerical clinical features, two-tailed Student's t test with unequal variance (Lehmann and Romano 2005) was applied to compare the clinical values between tumors with and without gene mutations using 't.test' function in R
For binary or multi-class clinical features (nominal or ordinal), two-tailed Fisher's exact tests (Fisher 1922) were used to estimate the P values using the 'fisher.test' function in R
For multiple hypothesis correction, Q value is the False Discovery Rate (FDR) analogue of the P value (Benjamini and Hochberg 1995), defined as the minimum FDR at which the test may be called significant. We used the 'Benjamini and Hochberg' method of 'p.adjust' function in R to convert P values into Q values.
This is an experimental feature. The full results of the analysis summarized in this report can be downloaded from the TCGA Data Coordination Center.