This pipeline computes the correlation between significant arm-level copy number variations (cnvs) and subtypes.
Testing the association between copy number variation 19 arm-level results and 8 molecular subtypes across 50 patients, 5 significant findings detected with Q value < 0.25.
-
6q loss cnv correlated to 'METHLYATION_CNMF'.
-
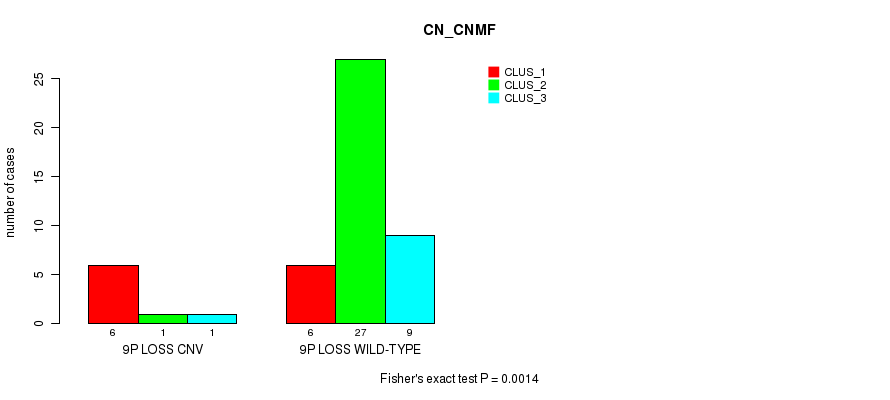
9p loss cnv correlated to 'CN_CNMF'.
-
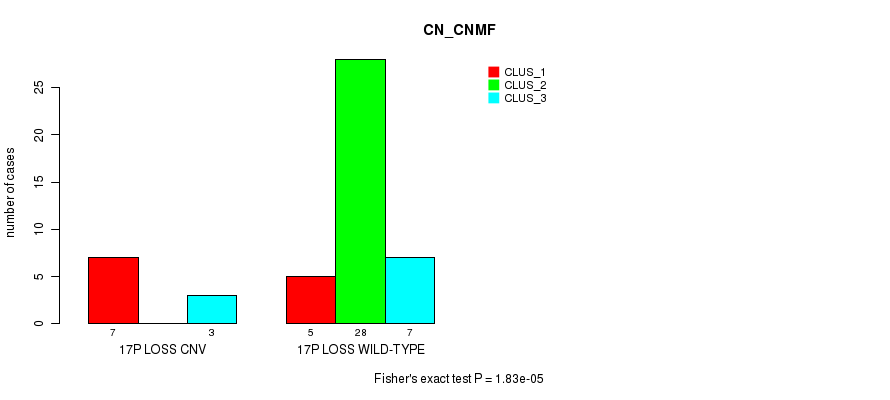
17p loss cnv correlated to 'CN_CNMF'.
-
18q loss cnv correlated to 'CN_CNMF'.
-
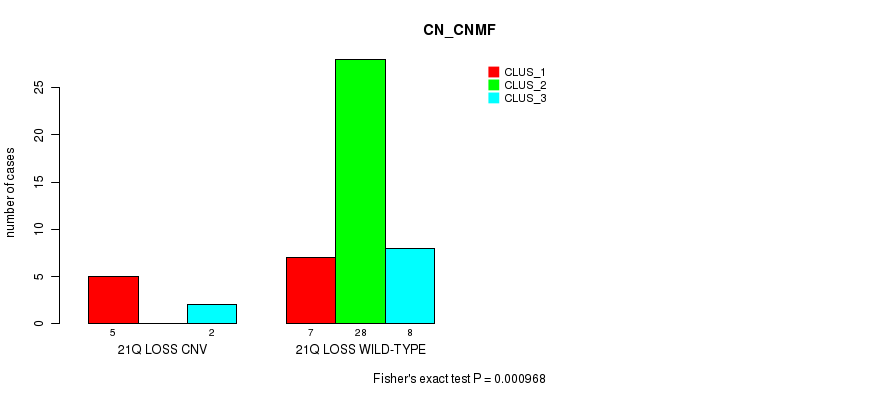
21q loss cnv correlated to 'CN_CNMF'.
Table 1. Get Full Table Overview of the association between significant copy number variation of 19 arm-level results and 8 molecular subtypes. Shown in the table are P values (Q values). Thresholded by Q value < 0.25, 5 significant findings detected.
|
Molecular subtypes |
CN CNMF |
METHLYATION CNMF |
MRNASEQ CNMF |
MRNASEQ CHIERARCHICAL |
MIRSEQ CNMF |
MIRSEQ CHIERARCHICAL |
MIRSEQ MATURE CNMF |
MIRSEQ MATURE CHIERARCHICAL |
||
| nCNV (%) | nWild-Type | Fisher's exact test | Fisher's exact test | Fisher's exact test | Fisher's exact test | Chi-square test | Fisher's exact test | Fisher's exact test | Fisher's exact test | |
| 6q loss | 0 (0%) | 42 |
0.014 (1.00) |
0.000163 (0.0228) |
0.0212 (1.00) |
0.0341 (1.00) |
0.00374 (0.49) |
0.00756 (0.944) |
0.0211 (1.00) |
0.00756 (0.944) |
| 9p loss | 0 (0%) | 42 |
0.0014 (0.192) |
0.00254 (0.343) |
0.186 (1.00) |
0.0341 (1.00) |
0.0649 (1.00) |
0.119 (1.00) |
0.0211 (1.00) |
0.119 (1.00) |
| 17p loss | 0 (0%) | 40 |
1.83e-05 (0.00258) |
0.00202 (0.275) |
0.412 (1.00) |
0.0101 (1.00) |
0.184 (1.00) |
0.0367 (1.00) |
0.0212 (1.00) |
0.0367 (1.00) |
| 18q loss | 0 (0%) | 43 |
0.000968 (0.135) |
0.00694 (0.882) |
0.664 (1.00) |
0.0341 (1.00) |
0.0461 (1.00) |
0.396 (1.00) |
0.185 (1.00) |
0.396 (1.00) |
| 21q loss | 0 (0%) | 43 |
0.000968 (0.135) |
0.00694 (0.882) |
0.0212 (1.00) |
0.0341 (1.00) |
0.0625 (1.00) |
0.119 (1.00) |
0.0211 (1.00) |
0.119 (1.00) |
| 1q gain | 0 (0%) | 47 |
0.0449 (1.00) |
0.0562 (1.00) |
0.488 (1.00) |
0.488 (1.00) |
||||
| 8q gain | 0 (0%) | 43 |
0.00605 (0.774) |
0.0405 (1.00) |
0.186 (1.00) |
0.258 (1.00) |
0.219 (1.00) |
0.0305 (1.00) |
0.0946 (1.00) |
0.0305 (1.00) |
| 18p gain | 0 (0%) | 45 |
0.0105 (1.00) |
0.12 (1.00) |
0.233 (1.00) |
0.313 (1.00) |
0.404 (1.00) |
0.0637 (1.00) |
0.108 (1.00) |
0.0637 (1.00) |
| 20q gain | 0 (0%) | 46 |
0.00306 (0.41) |
0.538 (1.00) |
1 (1.00) |
1 (1.00) |
0.353 (1.00) |
0.515 (1.00) |
0.607 (1.00) |
0.515 (1.00) |
| 6p loss | 0 (0%) | 45 |
0.0152 (1.00) |
0.00491 (0.638) |
0.0486 (1.00) |
0.0605 (1.00) |
0.0184 (1.00) |
0.018 (1.00) |
0.0485 (1.00) |
0.018 (1.00) |
| 9q loss | 0 (0%) | 47 |
0.237 (1.00) |
0.0562 (1.00) |
1 (1.00) |
1 (1.00) |
||||
| 10p loss | 0 (0%) | 47 |
0.0173 (1.00) |
0.0562 (1.00) |
0.488 (1.00) |
0.0309 (1.00) |
0.217 (1.00) |
0.233 (1.00) |
0.217 (1.00) |
|
| 10q loss | 0 (0%) | 47 |
0.0786 (1.00) |
0.0562 (1.00) |
0.488 (1.00) |
0.198 (1.00) |
0.217 (1.00) |
0.233 (1.00) |
0.217 (1.00) |
|
| 12p loss | 0 (0%) | 47 |
0.0449 (1.00) |
0.0562 (1.00) |
0.233 (1.00) |
0.313 (1.00) |
0.198 (1.00) |
0.217 (1.00) |
0.233 (1.00) |
0.217 (1.00) |
| 12q loss | 0 (0%) | 45 |
0.0152 (1.00) |
0.00491 (0.638) |
0.607 (1.00) |
0.184 (1.00) |
0.422 (1.00) |
0.515 (1.00) |
0.108 (1.00) |
0.515 (1.00) |
| 13q loss | 0 (0%) | 47 |
0.0173 (1.00) |
0.341 (1.00) |
0.488 (1.00) |
0.0309 (1.00) |
0.217 (1.00) |
0.233 (1.00) |
0.217 (1.00) |
|
| 17q loss | 0 (0%) | 46 |
0.00306 (0.41) |
0.0168 (1.00) |
1 (1.00) |
0.313 (1.00) |
0.114 (1.00) |
0.515 (1.00) |
0.108 (1.00) |
0.515 (1.00) |
| 18p loss | 0 (0%) | 46 |
0.0318 (1.00) |
0.0168 (1.00) |
1 (1.00) |
0.313 (1.00) |
0.568 (1.00) |
0.79 (1.00) |
1 (1.00) |
0.79 (1.00) |
| 22q loss | 0 (0%) | 46 |
0.00306 (0.41) |
0.12 (1.00) |
0.233 (1.00) |
0.313 (1.00) |
0.198 (1.00) |
0.217 (1.00) |
0.233 (1.00) |
0.217 (1.00) |
P value = 0.000163 (Fisher's exact test), Q value = 0.023
Table S1. Gene #6: '6q loss' versus Molecular Subtype #2: 'METHLYATION_CNMF'
| nPatients | CLUS_1 | CLUS_2 | CLUS_3 |
|---|---|---|---|
| ALL | 18 | 19 | 12 |
| 6Q LOSS CNV | 8 | 0 | 0 |
| 6Q LOSS WILD-TYPE | 10 | 19 | 12 |
Figure S1. Get High-res Image Gene #6: '6q loss' versus Molecular Subtype #2: 'METHLYATION_CNMF'

P value = 0.0014 (Fisher's exact test), Q value = 0.19
Table S2. Gene #7: '9p loss' versus Molecular Subtype #1: 'CN_CNMF'
| nPatients | CLUS_1 | CLUS_2 | CLUS_3 |
|---|---|---|---|
| ALL | 12 | 28 | 10 |
| 9P LOSS CNV | 6 | 1 | 1 |
| 9P LOSS WILD-TYPE | 6 | 27 | 9 |
Figure S2. Get High-res Image Gene #7: '9p loss' versus Molecular Subtype #1: 'CN_CNMF'
P value = 1.83e-05 (Fisher's exact test), Q value = 0.0026
Table S3. Gene #14: '17p loss' versus Molecular Subtype #1: 'CN_CNMF'
| nPatients | CLUS_1 | CLUS_2 | CLUS_3 |
|---|---|---|---|
| ALL | 12 | 28 | 10 |
| 17P LOSS CNV | 7 | 0 | 3 |
| 17P LOSS WILD-TYPE | 5 | 28 | 7 |
Figure S3. Get High-res Image Gene #14: '17p loss' versus Molecular Subtype #1: 'CN_CNMF'
P value = 0.000968 (Fisher's exact test), Q value = 0.13
Table S4. Gene #17: '18q loss' versus Molecular Subtype #1: 'CN_CNMF'
| nPatients | CLUS_1 | CLUS_2 | CLUS_3 |
|---|---|---|---|
| ALL | 12 | 28 | 10 |
| 18Q LOSS CNV | 5 | 0 | 2 |
| 18Q LOSS WILD-TYPE | 7 | 28 | 8 |
Figure S4. Get High-res Image Gene #17: '18q loss' versus Molecular Subtype #1: 'CN_CNMF'

P value = 0.000968 (Fisher's exact test), Q value = 0.13
Table S5. Gene #18: '21q loss' versus Molecular Subtype #1: 'CN_CNMF'
| nPatients | CLUS_1 | CLUS_2 | CLUS_3 |
|---|---|---|---|
| ALL | 12 | 28 | 10 |
| 21Q LOSS CNV | 5 | 0 | 2 |
| 21Q LOSS WILD-TYPE | 7 | 28 | 8 |
Figure S5. Get High-res Image Gene #18: '21q loss' versus Molecular Subtype #1: 'CN_CNMF'
-
Mutation data file = broad_values_by_arm.mutsig.cluster.txt
-
Molecular subtypes file = PAAD-TP.transferedmergedcluster.txt
-
Number of patients = 50
-
Number of significantly arm-level cnvs = 19
-
Number of molecular subtypes = 8
-
Exclude genes that fewer than K tumors have mutations, K = 3
For binary or multi-class clinical features (nominal or ordinal), two-tailed Fisher's exact tests (Fisher 1922) were used to estimate the P values using the 'fisher.test' function in R
For multi-class clinical features (nominal or ordinal), Chi-square tests (Greenwood and Nikulin 1996) were used to estimate the P values using the 'chisq.test' function in R
For multiple hypothesis correction, Q value is the False Discovery Rate (FDR) analogue of the P value (Benjamini and Hochberg 1995), defined as the minimum FDR at which the test may be called significant. We used the 'Benjamini and Hochberg' method of 'p.adjust' function in R to convert P values into Q values.
This is an experimental feature. The full results of the analysis summarized in this report can be downloaded from the TCGA Data Coordination Center.