This pipeline computes the correlation between significantly recurrent gene mutations and selected clinical features.
Testing the association between mutation status of 87 genes and 8 clinical features across 161 patients, 9 significant findings detected with Q value < 0.25.
-
OXA1L mutation correlated to 'LYMPH.NODE.METASTASIS'.
-
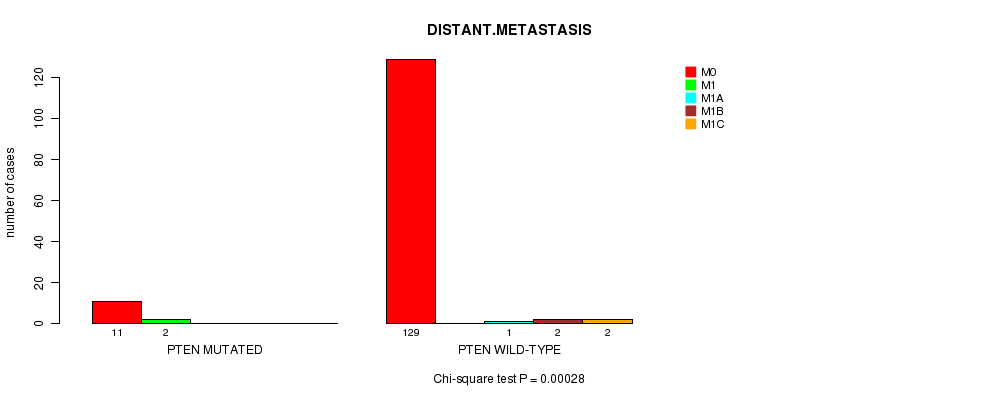
PTEN mutation correlated to 'DISTANT.METASTASIS'.
-
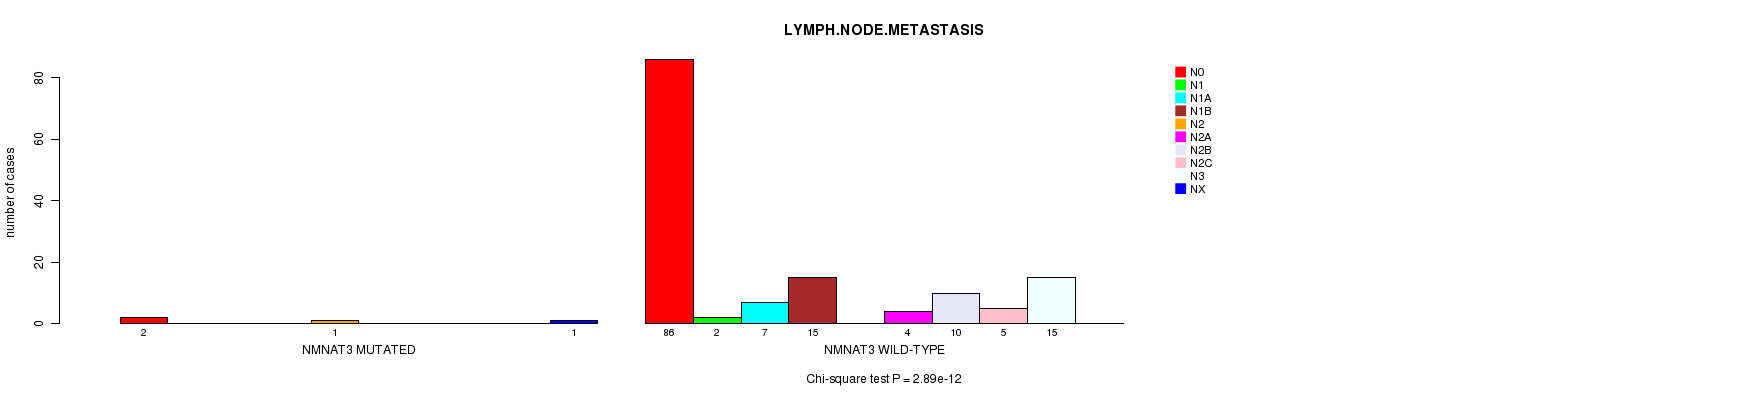
NMNAT3 mutation correlated to 'LYMPH.NODE.METASTASIS'.
-
RAPGEF5 mutation correlated to 'LYMPH.NODE.METASTASIS'.
-
ANKRD20A4 mutation correlated to 'LYMPH.NODE.METASTASIS'.
-
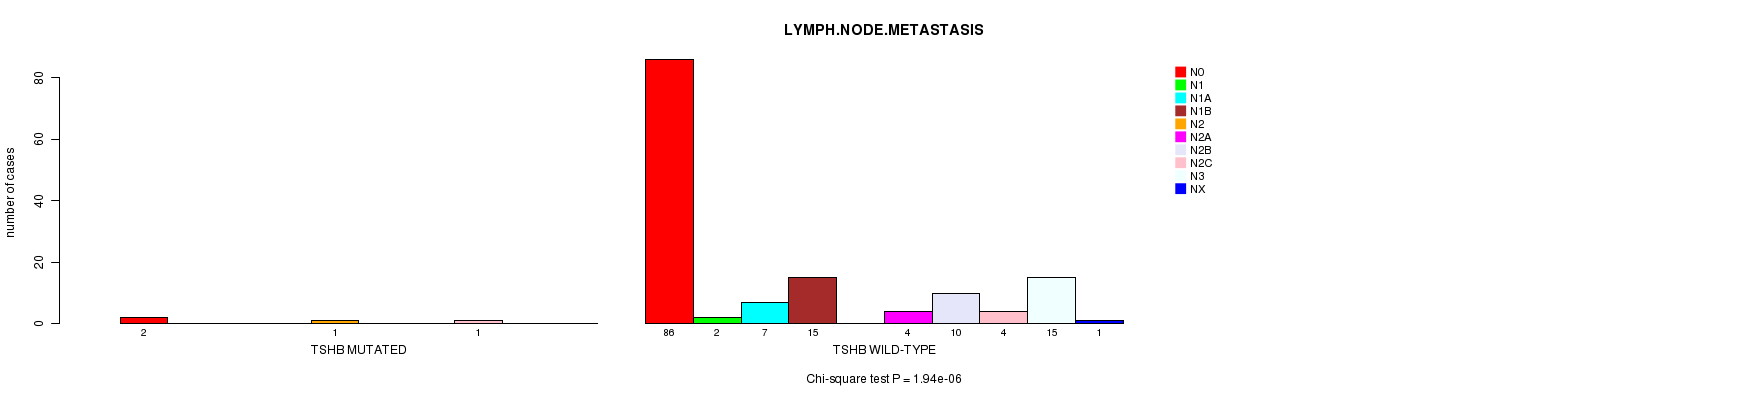
TSHB mutation correlated to 'LYMPH.NODE.METASTASIS'.
-
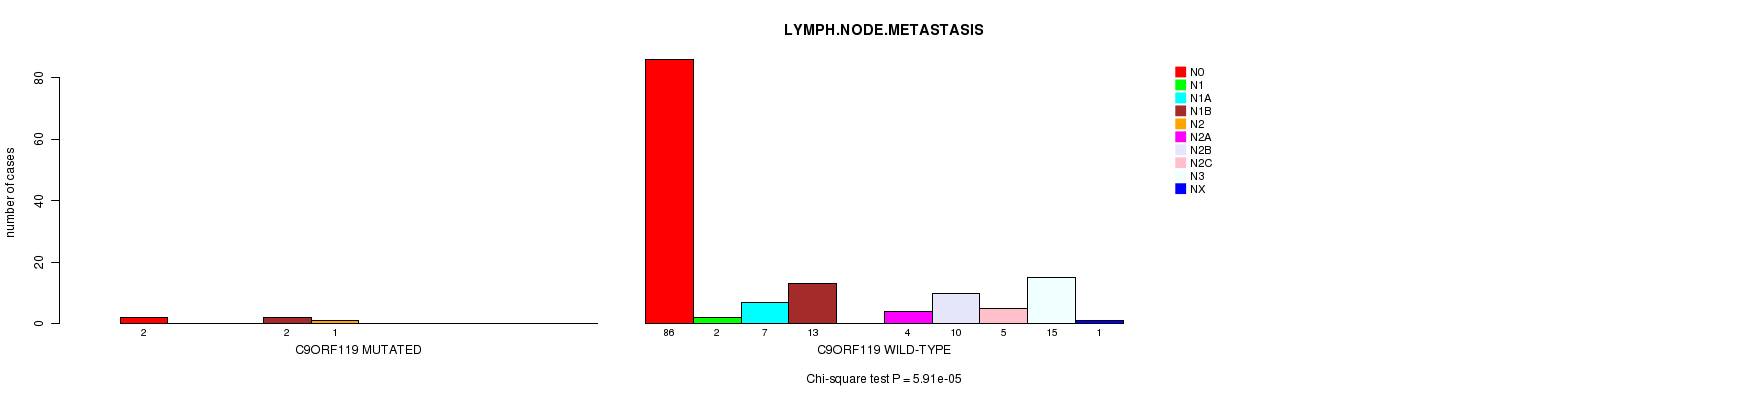
C9ORF119 mutation correlated to 'LYMPH.NODE.METASTASIS'.
-
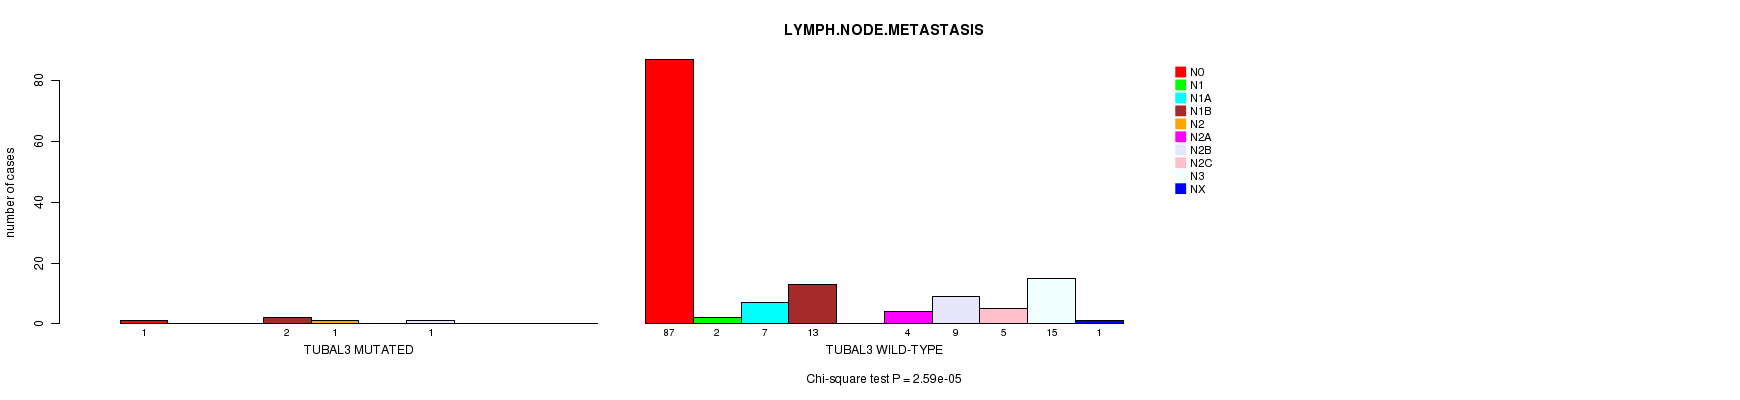
TUBAL3 mutation correlated to 'LYMPH.NODE.METASTASIS'.
-
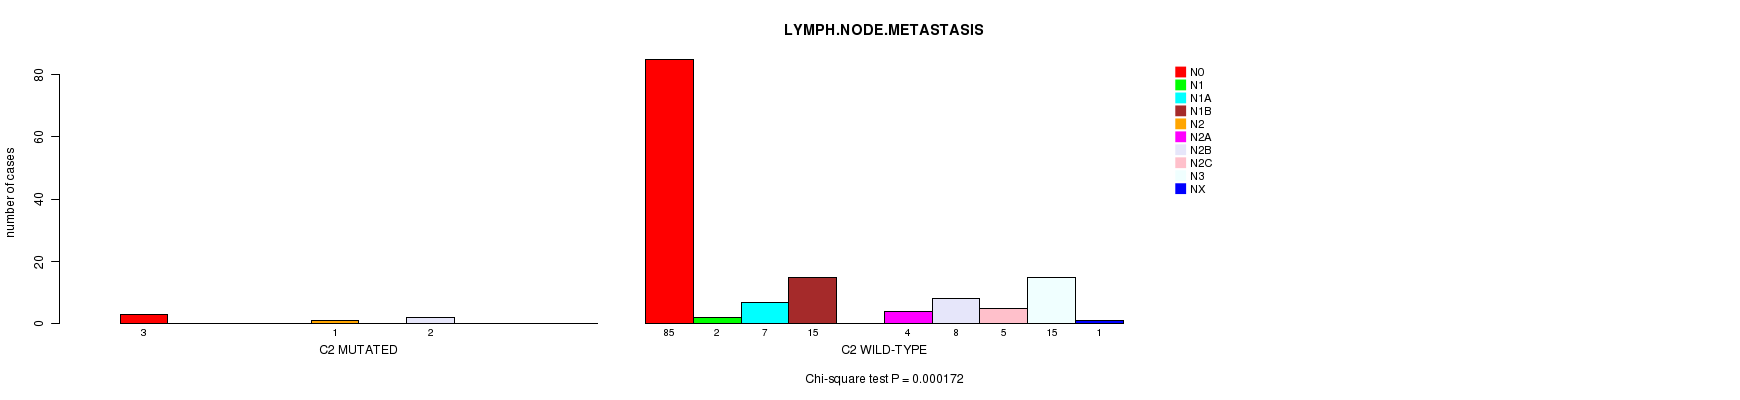
C2 mutation correlated to 'LYMPH.NODE.METASTASIS'.
Table 1. Get Full Table Overview of the association between mutation status of 87 genes and 8 clinical features. Shown in the table are P values (Q values). Thresholded by Q value < 0.25, 9 significant findings detected.
|
Clinical Features |
Time to Death |
AGE |
PRIMARY SITE OF DISEASE |
GENDER |
DISTANT METASTASIS |
LYMPH NODE METASTASIS |
TUMOR STAGECODE |
NEOPLASM DISEASESTAGE |
||
| nMutated (%) | nWild-Type | logrank test | t-test | Fisher's exact test | Fisher's exact test | Chi-square test | Chi-square test | t-test | Chi-square test | |
| OXA1L | 5 (3%) | 156 |
0.695 (1.00) |
0.613 (1.00) |
0.656 (1.00) |
1 (1.00) |
0.992 (1.00) |
0.00012 (0.0711) |
0.48 (1.00) |
|
| PTEN | 13 (8%) | 148 |
0.703 (1.00) |
0.234 (1.00) |
0.473 (1.00) |
0.551 (1.00) |
0.00028 (0.165) |
0.835 (1.00) |
0.0325 (1.00) |
|
| NMNAT3 | 5 (3%) | 156 |
0.933 (1.00) |
0.545 (1.00) |
0.0478 (1.00) |
1 (1.00) |
0.995 (1.00) |
2.89e-12 (1.73e-09) |
0.12 (1.00) |
|
| RAPGEF5 | 8 (5%) | 153 |
0.997 (1.00) |
0.36 (1.00) |
0.1 (1.00) |
0.26 (1.00) |
0.989 (1.00) |
0.000279 (0.165) |
0.331 (1.00) |
|
| ANKRD20A4 | 4 (2%) | 157 |
0.449 (1.00) |
0.531 (1.00) |
0.778 (1.00) |
0.297 (1.00) |
0.995 (1.00) |
1.62e-05 (0.00966) |
0.564 (1.00) |
|
| TSHB | 4 (2%) | 157 |
0.471 (1.00) |
0.95 (1.00) |
0.0305 (1.00) |
1 (1.00) |
0.995 (1.00) |
1.94e-06 (0.00116) |
0.319 (1.00) |
|
| C9ORF119 | 5 (3%) | 156 |
0.333 (1.00) |
0.34 (1.00) |
1 (1.00) |
0.159 (1.00) |
0.992 (1.00) |
5.91e-05 (0.0351) |
0.817 (1.00) |
|
| TUBAL3 | 8 (5%) | 153 |
0.811 (1.00) |
0.632 (1.00) |
0.388 (1.00) |
0.711 (1.00) |
0.992 (1.00) |
2.59e-05 (0.0154) |
0.621 (1.00) |
|
| C2 | 7 (4%) | 154 |
0.485 (1.00) |
0.883 (1.00) |
0.742 (1.00) |
1 (1.00) |
0.989 (1.00) |
0.000172 (0.102) |
0.349 (1.00) |
|
| C15ORF23 | 11 (7%) | 150 |
0.579 (1.00) |
0.67 (1.00) |
0.819 (1.00) |
0.747 (1.00) |
0.97 (1.00) |
0.488 (1.00) |
0.679 (1.00) |
|
| CDKN2A | 27 (17%) | 134 |
0.571 (1.00) |
0.995 (1.00) |
0.671 (1.00) |
1 (1.00) |
0.826 (1.00) |
0.746 (1.00) |
0.366 (1.00) |
|
| NRAS | 49 (30%) | 112 |
0.7 (1.00) |
0.394 (1.00) |
0.454 (1.00) |
1 (1.00) |
0.618 (1.00) |
0.91 (1.00) |
0.591 (1.00) |
|
| BRAF | 82 (51%) | 79 |
0.256 (1.00) |
0.0963 (1.00) |
0.126 (1.00) |
0.746 (1.00) |
0.568 (1.00) |
0.835 (1.00) |
0.635 (1.00) |
|
| TP53 | 26 (16%) | 135 |
0.687 (1.00) |
0.07 (1.00) |
0.221 (1.00) |
0.828 (1.00) |
0.59 (1.00) |
0.0964 (1.00) |
0.464 (1.00) |
|
| STK19 | 10 (6%) | 151 |
0.415 (1.00) |
0.335 (1.00) |
1 (1.00) |
0.5 (1.00) |
0.975 (1.00) |
0.965 (1.00) |
0.76 (1.00) |
|
| DSG1 | 26 (16%) | 135 |
0.0907 (1.00) |
0.956 (1.00) |
0.662 (1.00) |
1 (1.00) |
0.838 (1.00) |
0.254 (1.00) |
0.422 (1.00) |
|
| PPP6C | 15 (9%) | 146 |
0.00412 (1.00) |
0.647 (1.00) |
0.646 (1.00) |
1 (1.00) |
0.402 (1.00) |
0.0481 (1.00) |
0.755 (1.00) |
|
| RAC1 | 12 (7%) | 149 |
0.0898 (1.00) |
0.415 (1.00) |
0.579 (1.00) |
1 (1.00) |
0.97 (1.00) |
0.895 (1.00) |
0.303 (1.00) |
|
| AOAH | 17 (11%) | 144 |
0.695 (1.00) |
0.1 (1.00) |
0.0108 (1.00) |
0.791 (1.00) |
0.362 (1.00) |
0.0219 (1.00) |
0.735 (1.00) |
|
| IDH1 | 8 (5%) | 153 |
0.697 (1.00) |
0.00483 (1.00) |
1 (1.00) |
0.466 (1.00) |
0.981 (1.00) |
0.981 (1.00) |
0.703 (1.00) |
|
| OR51S1 | 17 (11%) | 144 |
0.668 (1.00) |
0.424 (1.00) |
0.197 (1.00) |
1 (1.00) |
0.934 (1.00) |
0.0496 (1.00) |
0.201 (1.00) |
|
| IL32 | 7 (4%) | 154 |
0.0335 (1.00) |
0.702 (1.00) |
0.538 (1.00) |
0.708 (1.00) |
0.985 (1.00) |
0.833 (1.00) |
0.00832 (1.00) |
|
| PPIAL4G | 11 (7%) | 150 |
0.0917 (1.00) |
0.0373 (1.00) |
0.741 (1.00) |
0.331 (1.00) |
0.97 (1.00) |
0.0327 (1.00) |
0.97 (1.00) |
|
| UGT2B15 | 17 (11%) | 144 |
0.647 (1.00) |
0.36 (1.00) |
0.773 (1.00) |
0.112 (1.00) |
0.117 (1.00) |
0.126 (1.00) |
0.14 (1.00) |
|
| TTN | 127 (79%) | 34 |
0.186 (1.00) |
0.837 (1.00) |
1 (1.00) |
0.166 (1.00) |
0.496 (1.00) |
0.353 (1.00) |
0.376 (1.00) |
|
| THEMIS | 16 (10%) | 145 |
0.717 (1.00) |
0.409 (1.00) |
0.576 (1.00) |
1 (1.00) |
0.925 (1.00) |
0.223 (1.00) |
0.619 (1.00) |
|
| LRTM1 | 16 (10%) | 145 |
0.886 (1.00) |
0.654 (1.00) |
0.712 (1.00) |
0.0527 (1.00) |
0.0381 (1.00) |
0.186 (1.00) |
0.611 (1.00) |
|
| TCEB3C | 23 (14%) | 138 |
0.334 (1.00) |
0.472 (1.00) |
0.864 (1.00) |
0.16 (1.00) |
0.862 (1.00) |
0.533 (1.00) |
0.458 (1.00) |
|
| ELF5 | 4 (2%) | 157 |
0.562 (1.00) |
0.775 (1.00) |
0.6 (1.00) |
1 (1.00) |
0.997 (1.00) |
0.28 (1.00) |
0.97 (1.00) |
|
| GPR141 | 12 (7%) | 149 |
0.61 (1.00) |
0.993 (1.00) |
0.308 (1.00) |
0.538 (1.00) |
0.957 (1.00) |
0.057 (1.00) |
0.288 (1.00) |
|
| EIF2B1 | 8 (5%) | 153 |
0.782 (1.00) |
0.772 (1.00) |
0.0838 (1.00) |
1 (1.00) |
0.985 (1.00) |
0.938 (1.00) |
0.975 (1.00) |
|
| CHGB | 18 (11%) | 143 |
0.128 (1.00) |
0.918 (1.00) |
0.519 (1.00) |
1 (1.00) |
0.925 (1.00) |
0.154 (1.00) |
0.173 (1.00) |
|
| COPG2 | 3 (2%) | 158 |
0.454 (1.00) |
0.997 (1.00) |
0.725 (1.00) |
1 (1.00) |
0.997 (1.00) |
0.99 (1.00) |
0.0442 (1.00) |
|
| MS4A2 | 8 (5%) | 153 |
0.58 (1.00) |
0.528 (1.00) |
0.136 (1.00) |
0.26 (1.00) |
0.985 (1.00) |
0.0094 (1.00) |
0.867 (1.00) |
|
| MPP7 | 19 (12%) | 142 |
0.992 (1.00) |
0.023 (1.00) |
0.891 (1.00) |
0.448 (1.00) |
0.471 (1.00) |
0.0976 (1.00) |
0.935 (1.00) |
|
| C1QTNF9 | 10 (6%) | 151 |
0.176 (1.00) |
0.636 (1.00) |
0.0664 (1.00) |
0.328 (1.00) |
0.97 (1.00) |
0.902 (1.00) |
0.702 (1.00) |
|
| DNAH7 | 60 (37%) | 101 |
0.414 (1.00) |
0.073 (1.00) |
0.552 (1.00) |
0.128 (1.00) |
0.247 (1.00) |
0.28 (1.00) |
0.939 (1.00) |
|
| FAM58A | 3 (2%) | 158 |
0.467 (1.00) |
0.41 (1.00) |
0.725 (1.00) |
0.299 (1.00) |
0.997 (1.00) |
0.41 (1.00) |
||
| LCE1B | 9 (6%) | 152 |
0.0619 (1.00) |
0.75 (1.00) |
0.0817 (1.00) |
0.726 (1.00) |
0.981 (1.00) |
0.933 (1.00) |
0.674 (1.00) |
|
| SCN5A | 40 (25%) | 121 |
0.635 (1.00) |
0.199 (1.00) |
0.451 (1.00) |
0.575 (1.00) |
0.267 (1.00) |
0.481 (1.00) |
0.439 (1.00) |
|
| C6ORF223 | 3 (2%) | 158 |
0.661 (1.00) |
0.603 (1.00) |
1 (1.00) |
0.299 (1.00) |
0.997 (1.00) |
0.697 (1.00) |
0.341 (1.00) |
|
| LOC649330 | 20 (12%) | 141 |
0.444 (1.00) |
0.031 (1.00) |
0.643 (1.00) |
0.324 (1.00) |
0.916 (1.00) |
0.235 (1.00) |
0.604 (1.00) |
|
| KLRC3 | 4 (2%) | 157 |
0.471 (1.00) |
0.683 (1.00) |
0.778 (1.00) |
0.624 (1.00) |
0.995 (1.00) |
0.379 (1.00) |
0.848 (1.00) |
|
| UNC119B | 3 (2%) | 158 |
0.999 (1.00) |
0.375 (1.00) |
1 (1.00) |
1 (1.00) |
0.997 (1.00) |
0.99 (1.00) |
0.555 (1.00) |
|
| PENK | 15 (9%) | 146 |
0.723 (1.00) |
0.611 (1.00) |
0.0764 (1.00) |
0.575 (1.00) |
0.95 (1.00) |
0.106 (1.00) |
0.372 (1.00) |
|
| OR4E2 | 16 (10%) | 145 |
0.131 (1.00) |
0.587 (1.00) |
0.394 (1.00) |
0.416 (1.00) |
0.402 (1.00) |
0.144 (1.00) |
0.556 (1.00) |
|
| PRC1 | 9 (6%) | 152 |
0.635 (1.00) |
0.445 (1.00) |
0.551 (1.00) |
0.488 (1.00) |
0.981 (1.00) |
0.717 (1.00) |
0.931 (1.00) |
|
| SORT1 | 5 (3%) | 156 |
0.34 (1.00) |
0.6 (1.00) |
0.0592 (1.00) |
0.653 (1.00) |
0.992 (1.00) |
0.696 (1.00) |
0.147 (1.00) |
|
| PCDP1 | 12 (7%) | 149 |
0.364 (1.00) |
0.58 (1.00) |
0.688 (1.00) |
0.538 (1.00) |
0.97 (1.00) |
0.0327 (1.00) |
0.148 (1.00) |
|
| ZFP106 | 6 (4%) | 155 |
0.524 (1.00) |
0.000615 (0.363) |
0.491 (1.00) |
0.0864 (1.00) |
0.989 (1.00) |
0.81 (1.00) |
0.382 (1.00) |
|
| TCHHL1 | 25 (16%) | 136 |
0.774 (1.00) |
0.031 (1.00) |
0.192 (1.00) |
0.658 (1.00) |
0.15 (1.00) |
0.207 (1.00) |
0.106 (1.00) |
|
| OR2W1 | 13 (8%) | 148 |
0.546 (1.00) |
0.0459 (1.00) |
0.848 (1.00) |
0.551 (1.00) |
0.957 (1.00) |
0.0116 (1.00) |
0.931 (1.00) |
|
| LRRC4C | 25 (16%) | 136 |
0.359 (1.00) |
0.0553 (1.00) |
0.161 (1.00) |
0.658 (1.00) |
0.862 (1.00) |
0.421 (1.00) |
0.928 (1.00) |
|
| SERPINB10 | 7 (4%) | 154 |
0.437 (1.00) |
0.327 (1.00) |
0.236 (1.00) |
0.424 (1.00) |
0.989 (1.00) |
0.00245 (1.00) |
0.845 (1.00) |
|
| C18ORF26 | 13 (8%) | 148 |
0.608 (1.00) |
0.61 (1.00) |
0.0387 (1.00) |
0.135 (1.00) |
0.964 (1.00) |
0.0668 (1.00) |
0.872 (1.00) |
|
| TBC1D3B | 3 (2%) | 158 |
0.00198 (1.00) |
0.404 (1.00) |
0.285 (1.00) |
1 (1.00) |
||||
| CCNE2 | 10 (6%) | 151 |
0.0324 (1.00) |
0.879 (1.00) |
0.141 (1.00) |
1 (1.00) |
0.97 (1.00) |
0.946 (1.00) |
0.476 (1.00) |
|
| CAPZA3 | 13 (8%) | 148 |
0.859 (1.00) |
0.0973 (1.00) |
0.515 (1.00) |
1 (1.00) |
0.319 (1.00) |
0.114 (1.00) |
0.782 (1.00) |
|
| PROL1 | 15 (9%) | 146 |
0.907 (1.00) |
0.224 (1.00) |
0.169 (1.00) |
0.26 (1.00) |
0.0277 (1.00) |
0.127 (1.00) |
0.807 (1.00) |
|
| CYP4X1 | 12 (7%) | 149 |
0.552 (1.00) |
0.543 (1.00) |
0.834 (1.00) |
0.76 (1.00) |
0.964 (1.00) |
0.0173 (1.00) |
0.924 (1.00) |
|
| GCOM1 | 17 (11%) | 144 |
0.363 (1.00) |
0.165 (1.00) |
0.25 (1.00) |
0.602 (1.00) |
0.438 (1.00) |
0.255 (1.00) |
0.135 (1.00) |
|
| DGAT2L6 | 9 (6%) | 152 |
0.368 (1.00) |
0.349 (1.00) |
0.0312 (1.00) |
1 (1.00) |
0.975 (1.00) |
0.0113 (1.00) |
0.762 (1.00) |
|
| EIF3D | 3 (2%) | 158 |
0.0444 (1.00) |
0.481 (1.00) |
0.725 (1.00) |
0.299 (1.00) |
0.997 (1.00) |
0.979 (1.00) |
0.628 (1.00) |
|
| B2M | 4 (2%) | 157 |
0.577 (1.00) |
0.401 (1.00) |
0.778 (1.00) |
0.297 (1.00) |
0.997 (1.00) |
0.99 (1.00) |
0.655 (1.00) |
|
| KCNB2 | 43 (27%) | 118 |
0.716 (1.00) |
0.533 (1.00) |
0.459 (1.00) |
1 (1.00) |
0.293 (1.00) |
0.144 (1.00) |
0.106 (1.00) |
|
| KIAA2022 | 31 (19%) | 130 |
0.514 (1.00) |
0.0144 (1.00) |
0.272 (1.00) |
0.409 (1.00) |
0.813 (1.00) |
0.122 (1.00) |
0.349 (1.00) |
|
| KIAA1486 | 19 (12%) | 142 |
0.332 (1.00) |
0.0274 (1.00) |
0.116 (1.00) |
0.0733 (1.00) |
0.438 (1.00) |
0.233 (1.00) |
0.701 (1.00) |
|
| APCS | 9 (6%) | 152 |
0.722 (1.00) |
0.291 (1.00) |
0.263 (1.00) |
1 (1.00) |
0.0895 (1.00) |
0.00511 (1.00) |
0.393 (1.00) |
|
| SIRPB1 | 15 (9%) | 146 |
0.841 (1.00) |
0.128 (1.00) |
0.241 (1.00) |
0.26 (1.00) |
0.95 (1.00) |
0.00318 (1.00) |
0.524 (1.00) |
|
| CYP7B1 | 14 (9%) | 147 |
0.716 (1.00) |
0.733 (1.00) |
0.732 (1.00) |
0.259 (1.00) |
0.957 (1.00) |
0.111 (1.00) |
0.935 (1.00) |
|
| SGCZ | 19 (12%) | 142 |
0.243 (1.00) |
0.897 (1.00) |
0.945 (1.00) |
1 (1.00) |
0.942 (1.00) |
0.0482 (1.00) |
0.183 (1.00) |
|
| PDE1A | 26 (16%) | 135 |
0.666 (1.00) |
0.13 (1.00) |
0.0187 (1.00) |
0.657 (1.00) |
0.838 (1.00) |
0.136 (1.00) |
0.708 (1.00) |
|
| CYP4Z1 | 13 (8%) | 148 |
0.192 (1.00) |
0.239 (1.00) |
1 (1.00) |
1 (1.00) |
0.274 (1.00) |
0.0659 (1.00) |
0.684 (1.00) |
|
| FAM113B | 16 (10%) | 145 |
0.327 (1.00) |
0.278 (1.00) |
0.00353 (1.00) |
0.0527 (1.00) |
0.925 (1.00) |
0.169 (1.00) |
0.162 (1.00) |
|
| SLC10A2 | 15 (9%) | 146 |
0.494 (1.00) |
0.238 (1.00) |
0.154 (1.00) |
0.784 (1.00) |
0.942 (1.00) |
0.032 (1.00) |
0.0825 (1.00) |
|
| CX3CL1 | 3 (2%) | 158 |
0.427 (1.00) |
0.938 (1.00) |
0.469 (1.00) |
1 (1.00) |
||||
| C2ORF39 | 8 (5%) | 153 |
0.583 (1.00) |
0.22 (1.00) |
1 (1.00) |
0.711 (1.00) |
0.053 (1.00) |
0.00709 (1.00) |
0.576 (1.00) |
|
| IGF2BP3 | 3 (2%) | 158 |
0.854 (1.00) |
0.687 (1.00) |
0.469 (1.00) |
1 (1.00) |
||||
| SLC9A11 | 28 (17%) | 133 |
0.766 (1.00) |
0.71 (1.00) |
0.732 (1.00) |
0.0845 (1.00) |
0.62 (1.00) |
0.422 (1.00) |
0.42 (1.00) |
|
| HRNR | 37 (23%) | 124 |
0.346 (1.00) |
0.39 (1.00) |
0.913 (1.00) |
0.0116 (1.00) |
0.674 (1.00) |
0.451 (1.00) |
0.602 (1.00) |
|
| DDX3X | 16 (10%) | 145 |
0.57 (1.00) |
0.538 (1.00) |
0.54 (1.00) |
0.172 (1.00) |
0.00456 (1.00) |
0.991 (1.00) |
0.704 (1.00) |
|
| TRHDE | 33 (20%) | 128 |
0.616 (1.00) |
0.138 (1.00) |
0.103 (1.00) |
0.231 (1.00) |
0.674 (1.00) |
0.325 (1.00) |
0.449 (1.00) |
|
| SPTLC3 | 15 (9%) | 146 |
0.214 (1.00) |
0.546 (1.00) |
0.348 (1.00) |
0.575 (1.00) |
0.934 (1.00) |
0.119 (1.00) |
0.177 (1.00) |
|
| ACD | 7 (4%) | 154 |
0.912 (1.00) |
0.563 (1.00) |
0.0286 (1.00) |
0.424 (1.00) |
0.985 (1.00) |
0.00442 (1.00) |
0.384 (1.00) |
|
| ARL16 | 5 (3%) | 156 |
0.212 (1.00) |
0.0271 (1.00) |
0.0592 (1.00) |
0.653 (1.00) |
0.992 (1.00) |
0.885 (1.00) |
0.157 (1.00) |
|
| PHGDH | 8 (5%) | 153 |
0.776 (1.00) |
0.695 (1.00) |
0.588 (1.00) |
0.0273 (1.00) |
0.989 (1.00) |
0.00217 (1.00) |
0.143 (1.00) |
|
| DNER | 15 (9%) | 146 |
0.479 (1.00) |
0.107 (1.00) |
0.485 (1.00) |
0.0536 (1.00) |
0.942 (1.00) |
0.212 (1.00) |
0.385 (1.00) |
P value = 0.00012 (Chi-square test), Q value = 0.071
Table S1. Gene #5: 'OXA1L MUTATION STATUS' versus Clinical Feature #6: 'LYMPH.NODE.METASTASIS'
| nPatients | N0 | N1 | N1A | N1B | N2 | N2A | N2B | N2C | N3 | NX |
|---|---|---|---|---|---|---|---|---|---|---|
| ALL | 88 | 2 | 7 | 15 | 1 | 4 | 10 | 5 | 15 | 1 |
| OXA1L MUTATED | 2 | 0 | 1 | 1 | 1 | 0 | 0 | 0 | 0 | 0 |
| OXA1L WILD-TYPE | 86 | 2 | 6 | 14 | 0 | 4 | 10 | 5 | 15 | 1 |
Figure S1. Get High-res Image Gene #5: 'OXA1L MUTATION STATUS' versus Clinical Feature #6: 'LYMPH.NODE.METASTASIS'

P value = 0.00028 (Chi-square test), Q value = 0.17
Table S2. Gene #8: 'PTEN MUTATION STATUS' versus Clinical Feature #5: 'DISTANT.METASTASIS'
| nPatients | M0 | M1 | M1A | M1B | M1C |
|---|---|---|---|---|---|
| ALL | 140 | 2 | 1 | 2 | 2 |
| PTEN MUTATED | 11 | 2 | 0 | 0 | 0 |
| PTEN WILD-TYPE | 129 | 0 | 1 | 2 | 2 |
Figure S2. Get High-res Image Gene #8: 'PTEN MUTATION STATUS' versus Clinical Feature #5: 'DISTANT.METASTASIS'
P value = 2.89e-12 (Chi-square test), Q value = 1.7e-09
Table S3. Gene #24: 'NMNAT3 MUTATION STATUS' versus Clinical Feature #6: 'LYMPH.NODE.METASTASIS'
| nPatients | N0 | N1 | N1A | N1B | N2 | N2A | N2B | N2C | N3 | NX |
|---|---|---|---|---|---|---|---|---|---|---|
| ALL | 88 | 2 | 7 | 15 | 1 | 4 | 10 | 5 | 15 | 1 |
| NMNAT3 MUTATED | 2 | 0 | 0 | 0 | 1 | 0 | 0 | 0 | 0 | 1 |
| NMNAT3 WILD-TYPE | 86 | 2 | 7 | 15 | 0 | 4 | 10 | 5 | 15 | 0 |
Figure S3. Get High-res Image Gene #24: 'NMNAT3 MUTATION STATUS' versus Clinical Feature #6: 'LYMPH.NODE.METASTASIS'
P value = 0.000279 (Chi-square test), Q value = 0.17
Table S4. Gene #28: 'RAPGEF5 MUTATION STATUS' versus Clinical Feature #6: 'LYMPH.NODE.METASTASIS'
| nPatients | N0 | N1 | N1A | N1B | N2 | N2A | N2B | N2C | N3 | NX |
|---|---|---|---|---|---|---|---|---|---|---|
| ALL | 88 | 2 | 7 | 15 | 1 | 4 | 10 | 5 | 15 | 1 |
| RAPGEF5 MUTATED | 2 | 0 | 1 | 2 | 1 | 0 | 0 | 0 | 0 | 0 |
| RAPGEF5 WILD-TYPE | 86 | 2 | 6 | 13 | 0 | 4 | 10 | 5 | 15 | 1 |
Figure S4. Get High-res Image Gene #28: 'RAPGEF5 MUTATION STATUS' versus Clinical Feature #6: 'LYMPH.NODE.METASTASIS'

P value = 1.62e-05 (Chi-square test), Q value = 0.0097
Table S5. Gene #37: 'ANKRD20A4 MUTATION STATUS' versus Clinical Feature #6: 'LYMPH.NODE.METASTASIS'
| nPatients | N0 | N1 | N1A | N1B | N2 | N2A | N2B | N2C | N3 | NX |
|---|---|---|---|---|---|---|---|---|---|---|
| ALL | 88 | 2 | 7 | 15 | 1 | 4 | 10 | 5 | 15 | 1 |
| ANKRD20A4 MUTATED | 2 | 0 | 0 | 1 | 1 | 0 | 0 | 0 | 0 | 0 |
| ANKRD20A4 WILD-TYPE | 86 | 2 | 7 | 14 | 0 | 4 | 10 | 5 | 15 | 1 |
Figure S5. Get High-res Image Gene #37: 'ANKRD20A4 MUTATION STATUS' versus Clinical Feature #6: 'LYMPH.NODE.METASTASIS'

P value = 1.94e-06 (Chi-square test), Q value = 0.0012
Table S6. Gene #43: 'TSHB MUTATION STATUS' versus Clinical Feature #6: 'LYMPH.NODE.METASTASIS'
| nPatients | N0 | N1 | N1A | N1B | N2 | N2A | N2B | N2C | N3 | NX |
|---|---|---|---|---|---|---|---|---|---|---|
| ALL | 88 | 2 | 7 | 15 | 1 | 4 | 10 | 5 | 15 | 1 |
| TSHB MUTATED | 2 | 0 | 0 | 0 | 1 | 0 | 0 | 1 | 0 | 0 |
| TSHB WILD-TYPE | 86 | 2 | 7 | 15 | 0 | 4 | 10 | 4 | 15 | 1 |
Figure S6. Get High-res Image Gene #43: 'TSHB MUTATION STATUS' versus Clinical Feature #6: 'LYMPH.NODE.METASTASIS'
P value = 5.91e-05 (Chi-square test), Q value = 0.035
Table S7. Gene #64: 'C9ORF119 MUTATION STATUS' versus Clinical Feature #6: 'LYMPH.NODE.METASTASIS'
| nPatients | N0 | N1 | N1A | N1B | N2 | N2A | N2B | N2C | N3 | NX |
|---|---|---|---|---|---|---|---|---|---|---|
| ALL | 88 | 2 | 7 | 15 | 1 | 4 | 10 | 5 | 15 | 1 |
| C9ORF119 MUTATED | 2 | 0 | 0 | 2 | 1 | 0 | 0 | 0 | 0 | 0 |
| C9ORF119 WILD-TYPE | 86 | 2 | 7 | 13 | 0 | 4 | 10 | 5 | 15 | 1 |
Figure S7. Get High-res Image Gene #64: 'C9ORF119 MUTATION STATUS' versus Clinical Feature #6: 'LYMPH.NODE.METASTASIS'
P value = 2.59e-05 (Chi-square test), Q value = 0.015
Table S8. Gene #65: 'TUBAL3 MUTATION STATUS' versus Clinical Feature #6: 'LYMPH.NODE.METASTASIS'
| nPatients | N0 | N1 | N1A | N1B | N2 | N2A | N2B | N2C | N3 | NX |
|---|---|---|---|---|---|---|---|---|---|---|
| ALL | 88 | 2 | 7 | 15 | 1 | 4 | 10 | 5 | 15 | 1 |
| TUBAL3 MUTATED | 1 | 0 | 0 | 2 | 1 | 0 | 1 | 0 | 0 | 0 |
| TUBAL3 WILD-TYPE | 87 | 2 | 7 | 13 | 0 | 4 | 9 | 5 | 15 | 1 |
Figure S8. Get High-res Image Gene #65: 'TUBAL3 MUTATION STATUS' versus Clinical Feature #6: 'LYMPH.NODE.METASTASIS'
P value = 0.000172 (Chi-square test), Q value = 0.1
Table S9. Gene #66: 'C2 MUTATION STATUS' versus Clinical Feature #6: 'LYMPH.NODE.METASTASIS'
| nPatients | N0 | N1 | N1A | N1B | N2 | N2A | N2B | N2C | N3 | NX |
|---|---|---|---|---|---|---|---|---|---|---|
| ALL | 88 | 2 | 7 | 15 | 1 | 4 | 10 | 5 | 15 | 1 |
| C2 MUTATED | 3 | 0 | 0 | 0 | 1 | 0 | 2 | 0 | 0 | 0 |
| C2 WILD-TYPE | 85 | 2 | 7 | 15 | 0 | 4 | 8 | 5 | 15 | 1 |
Figure S9. Get High-res Image Gene #66: 'C2 MUTATION STATUS' versus Clinical Feature #6: 'LYMPH.NODE.METASTASIS'
-
Mutation data file = SKCM-TM.mutsig.cluster.txt
-
Clinical data file = SKCM-TM.clin.merged.picked.txt
-
Number of patients = 161
-
Number of significantly mutated genes = 87
-
Number of selected clinical features = 8
-
Exclude genes that fewer than K tumors have mutations, K = 3
For survival clinical features, the Kaplan-Meier survival curves of tumors with and without gene mutations were plotted and the statistical significance P values were estimated by logrank test (Bland and Altman 2004) using the 'survdiff' function in R
For continuous numerical clinical features, two-tailed Student's t test with unequal variance (Lehmann and Romano 2005) was applied to compare the clinical values between tumors with and without gene mutations using 't.test' function in R
For binary or multi-class clinical features (nominal or ordinal), two-tailed Fisher's exact tests (Fisher 1922) were used to estimate the P values using the 'fisher.test' function in R
For multi-class clinical features (nominal or ordinal), Chi-square tests (Greenwood and Nikulin 1996) were used to estimate the P values using the 'chisq.test' function in R
For multiple hypothesis correction, Q value is the False Discovery Rate (FDR) analogue of the P value (Benjamini and Hochberg 1995), defined as the minimum FDR at which the test may be called significant. We used the 'Benjamini and Hochberg' method of 'p.adjust' function in R to convert P values into Q values.
This is an experimental feature. The full results of the analysis summarized in this report can be downloaded from the TCGA Data Coordination Center.