This pipeline computes the correlation between significantly recurrent gene mutations and molecular subtypes.
Testing the association between mutation status of 24 genes and 8 molecular subtypes across 223 patients, 9 significant findings detected with P value < 0.05 and Q value < 0.25.
-
FBXW7 mutation correlated to 'CN_CNMF'.
-
BRAF mutation correlated to 'MRNA_CNMF', 'MRNA_CHIERARCHICAL', and 'CN_CNMF'.
-
KRAS mutation correlated to 'MRNA_CNMF' and 'MRNA_CHIERARCHICAL'.
-
TP53 mutation correlated to 'MRNA_CHIERARCHICAL' and 'CN_CNMF'.
-
PIK3CA mutation correlated to 'CN_CNMF'.
Table 1. Get Full Table Overview of the association between mutation status of 24 genes and 8 molecular subtypes. Shown in the table are P values (Q values). Thresholded by P value < 0.05 and Q value < 0.25, 9 significant findings detected.
|
Clinical Features |
MRNA CNMF |
MRNA CHIERARCHICAL |
CN CNMF |
METHLYATION CNMF |
RPPA CNMF |
RPPA CHIERARCHICAL |
MIRSEQ CNMF |
MIRSEQ CHIERARCHICAL |
||
| nMutated (%) | nWild-Type | Fisher's exact test | Fisher's exact test | Fisher's exact test | Fisher's exact test | Fisher's exact test | Fisher's exact test | Fisher's exact test | Fisher's exact test | |
| BRAF | 22 (10%) | 201 |
9.13e-07 (0.000147) |
2.31e-08 (3.74e-06) |
9.56e-05 (0.015) |
0.482 (1.00) |
0.304 (1.00) |
1 (1.00) |
0.684 (1.00) |
|
| KRAS | 96 (43%) | 127 |
7.45e-05 (0.0118) |
4.05e-05 (0.00644) |
0.43 (1.00) |
0.107 (1.00) |
0.572 (1.00) |
1 (1.00) |
0.0218 (1.00) |
0.0431 (1.00) |
| TP53 | 119 (53%) | 104 |
0.00202 (0.311) |
0.000482 (0.0752) |
2.01e-12 (3.28e-10) |
0.568 (1.00) |
0.782 (1.00) |
0.0307 (1.00) |
0.567 (1.00) |
|
| FBXW7 | 38 (17%) | 185 |
0.0592 (1.00) |
0.0437 (1.00) |
0.000494 (0.0766) |
0.0112 (1.00) |
0.0362 (1.00) |
0.416 (1.00) |
0.156 (1.00) |
|
| PIK3CA | 33 (15%) | 190 |
0.205 (1.00) |
0.57 (1.00) |
2.13e-05 (0.00341) |
0.062 (1.00) |
0.129 (1.00) |
0.165 (1.00) |
1 (1.00) |
|
| APC | 160 (72%) | 63 |
0.0076 (1.00) |
0.0267 (1.00) |
0.072 (1.00) |
0.467 (1.00) |
0.452 (1.00) |
0.34 (1.00) |
0.837 (1.00) |
|
| NRAS | 20 (9%) | 203 |
0.0465 (1.00) |
0.125 (1.00) |
0.0957 (1.00) |
0.909 (1.00) |
0.474 (1.00) |
0.268 (1.00) |
1 (1.00) |
|
| SMAD4 | 26 (12%) | 197 |
0.0308 (1.00) |
0.288 (1.00) |
0.128 (1.00) |
0.859 (1.00) |
0.339 (1.00) |
1 (1.00) |
1 (1.00) |
|
| FAM123B | 25 (11%) | 198 |
0.0723 (1.00) |
0.0918 (1.00) |
0.00558 (0.843) |
0.344 (1.00) |
0.588 (1.00) |
1 (1.00) |
1 (1.00) |
|
| SMAD2 | 15 (7%) | 208 |
0.133 (1.00) |
0.518 (1.00) |
0.353 (1.00) |
0.592 (1.00) |
0.133 (1.00) |
1 (1.00) |
1 (1.00) |
|
| TCF7L2 | 18 (8%) | 205 |
1 (1.00) |
0.413 (1.00) |
0.00723 (1.00) |
0.836 (1.00) |
0.896 (1.00) |
1 (1.00) |
1 (1.00) |
|
| ACVR2A | 9 (4%) | 214 |
0.00717 (1.00) |
0.184 (1.00) |
0.0207 (1.00) |
0.0952 (1.00) |
0.469 (1.00) |
0.173 (1.00) |
1 (1.00) |
|
| SOX9 | 10 (4%) | 213 |
0.129 (1.00) |
0.123 (1.00) |
0.00502 (0.763) |
0.189 (1.00) |
0.694 (1.00) |
1 (1.00) |
1 (1.00) |
|
| ELF3 | 6 (3%) | 217 |
0.363 (1.00) |
0.811 (1.00) |
0.521 (1.00) |
0.544 (1.00) |
0.436 (1.00) |
1 (1.00) |
1 (1.00) |
|
| CRTC1 | 6 (3%) | 217 |
0.123 (1.00) |
0.165 (1.00) |
0.898 (1.00) |
0.175 (1.00) |
0.482 (1.00) |
1 (1.00) |
1 (1.00) |
|
| TNFRSF10C | 6 (3%) | 217 |
0.317 (1.00) |
0.287 (1.00) |
0.165 (1.00) |
0.278 (1.00) |
0.378 (1.00) |
1 (1.00) |
1 (1.00) |
|
| KIAA1804 | 15 (7%) | 208 |
0.267 (1.00) |
0.397 (1.00) |
0.0789 (1.00) |
0.506 (1.00) |
0.474 (1.00) |
1 (1.00) |
1 (1.00) |
|
| KRTAP5-5 | 4 (2%) | 219 |
0.327 (1.00) |
0.482 (1.00) |
0.849 (1.00) |
0.385 (1.00) |
1 (1.00) |
1 (1.00) |
1 (1.00) |
|
| PTEN | 7 (3%) | 216 |
0.0276 (1.00) |
0.337 (1.00) |
0.0517 (1.00) |
0.544 (1.00) |
0.436 (1.00) |
0.347 (1.00) |
0.298 (1.00) |
|
| ACOT4 | 3 (1%) | 220 |
0.255 (1.00) |
0.49 (1.00) |
0.515 (1.00) |
1 (1.00) |
1 (1.00) |
|||
| MYO1B | 13 (6%) | 210 |
0.00862 (1.00) |
0.00879 (1.00) |
0.00463 (0.709) |
0.0215 (1.00) |
0.469 (1.00) |
1 (1.00) |
1 (1.00) |
|
| PCBP1 | 6 (3%) | 217 |
0.234 (1.00) |
0.811 (1.00) |
0.707 (1.00) |
0.648 (1.00) |
0.482 (1.00) |
1 (1.00) |
1 (1.00) |
|
| GGT1 | 3 (1%) | 220 |
0.175 (1.00) |
1 (1.00) |
1 (1.00) |
|||||
| ACVR1B | 14 (6%) | 209 |
0.374 (1.00) |
0.316 (1.00) |
0.0924 (1.00) |
0.735 (1.00) |
0.376 (1.00) |
0.581 (1.00) |
1 (1.00) |
P value = 0.000494 (Fisher's exact test), Q value = 0.077
Table S1. Gene #2: 'FBXW7 MUTATION STATUS' versus Clinical Feature #3: 'CN_CNMF'
| nPatients | CLUS_1 | CLUS_2 | CLUS_3 | CLUS_4 |
|---|---|---|---|---|
| ALL | 77 | 82 | 56 | 5 |
| FBXW7 MUTATED | 4 | 24 | 9 | 1 |
| FBXW7 WILD-TYPE | 73 | 58 | 47 | 4 |
Figure S1. Get High-res Image Gene #2: 'FBXW7 MUTATION STATUS' versus Clinical Feature #3: 'CN_CNMF'
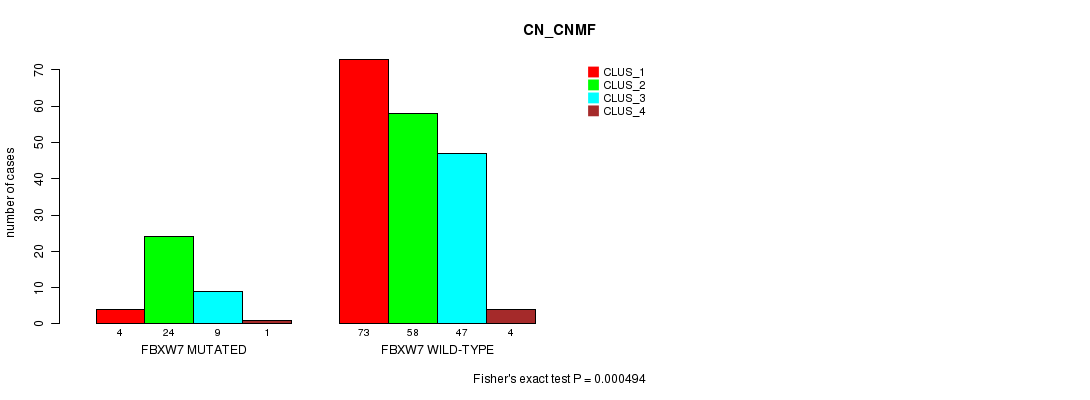
P value = 9.13e-07 (Fisher's exact test), Q value = 0.00015
Table S2. Gene #4: 'BRAF MUTATION STATUS' versus Clinical Feature #1: 'MRNA_CNMF'
| nPatients | CLUS_1 | CLUS_2 | CLUS_3 | CLUS_4 |
|---|---|---|---|---|
| ALL | 42 | 57 | 67 | 39 |
| BRAF MUTATED | 13 | 1 | 1 | 5 |
| BRAF WILD-TYPE | 29 | 56 | 66 | 34 |
Figure S2. Get High-res Image Gene #4: 'BRAF MUTATION STATUS' versus Clinical Feature #1: 'MRNA_CNMF'
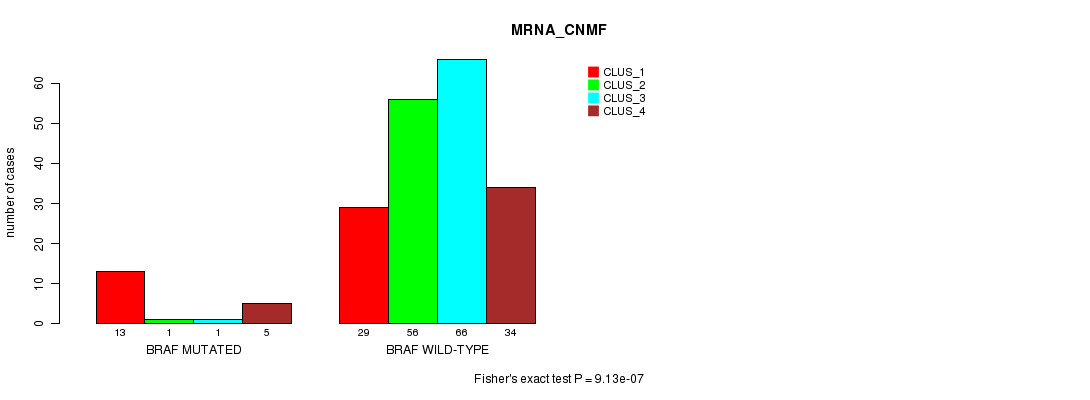
P value = 2.31e-08 (Fisher's exact test), Q value = 3.7e-06
Table S3. Gene #4: 'BRAF MUTATION STATUS' versus Clinical Feature #2: 'MRNA_CHIERARCHICAL'
| nPatients | CLUS_1 | CLUS_2 | CLUS_3 | CLUS_4 |
|---|---|---|---|---|
| ALL | 40 | 48 | 61 | 56 |
| BRAF MUTATED | 1 | 0 | 18 | 1 |
| BRAF WILD-TYPE | 39 | 48 | 43 | 55 |
Figure S3. Get High-res Image Gene #4: 'BRAF MUTATION STATUS' versus Clinical Feature #2: 'MRNA_CHIERARCHICAL'
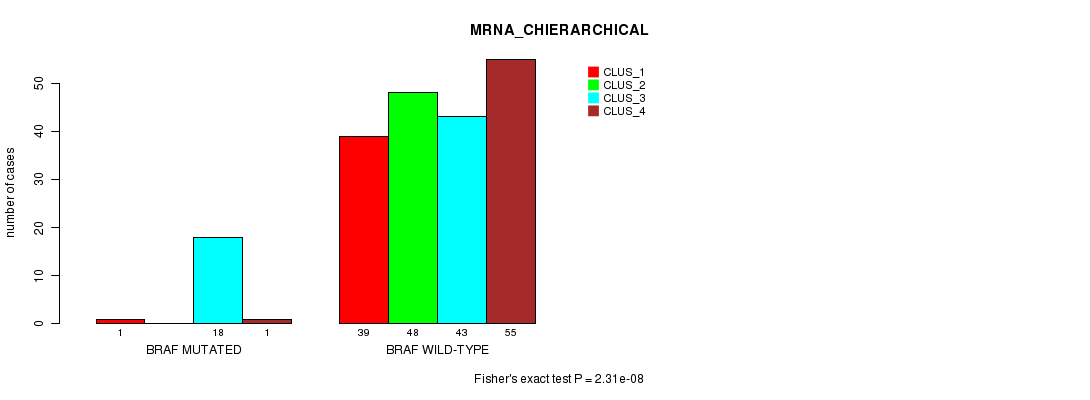
P value = 9.56e-05 (Fisher's exact test), Q value = 0.015
Table S4. Gene #4: 'BRAF MUTATION STATUS' versus Clinical Feature #3: 'CN_CNMF'
| nPatients | CLUS_1 | CLUS_2 | CLUS_3 | CLUS_4 |
|---|---|---|---|---|
| ALL | 77 | 82 | 56 | 5 |
| BRAF MUTATED | 1 | 18 | 3 | 0 |
| BRAF WILD-TYPE | 76 | 64 | 53 | 5 |
Figure S4. Get High-res Image Gene #4: 'BRAF MUTATION STATUS' versus Clinical Feature #3: 'CN_CNMF'
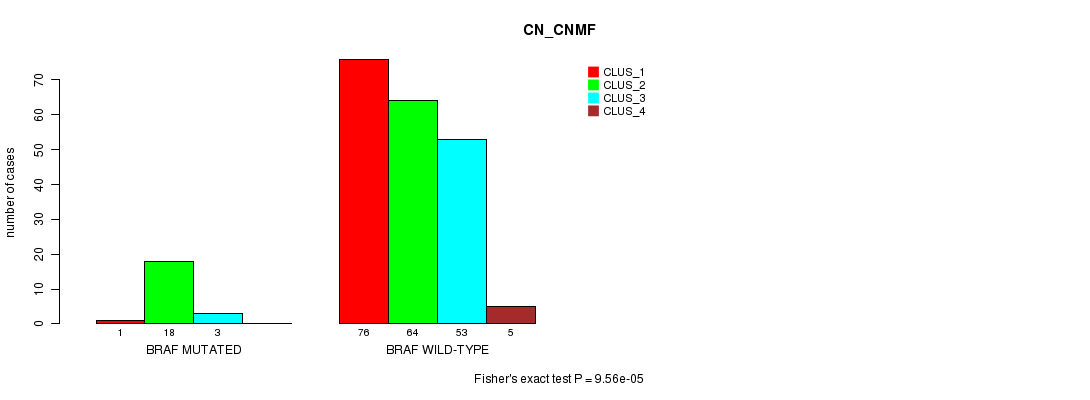
P value = 7.45e-05 (Fisher's exact test), Q value = 0.012
Table S5. Gene #5: 'KRAS MUTATION STATUS' versus Clinical Feature #1: 'MRNA_CNMF'
| nPatients | CLUS_1 | CLUS_2 | CLUS_3 | CLUS_4 |
|---|---|---|---|---|
| ALL | 42 | 57 | 67 | 39 |
| KRAS MUTATED | 13 | 14 | 31 | 27 |
| KRAS WILD-TYPE | 29 | 43 | 36 | 12 |
Figure S5. Get High-res Image Gene #5: 'KRAS MUTATION STATUS' versus Clinical Feature #1: 'MRNA_CNMF'
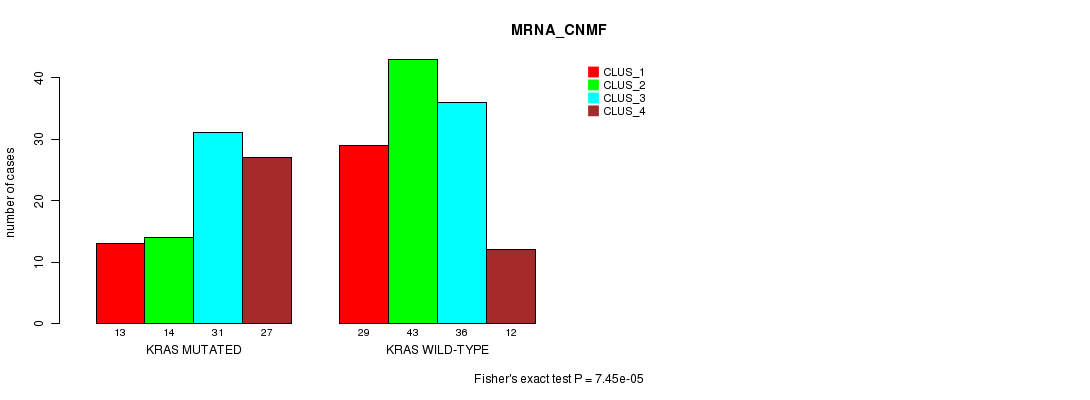
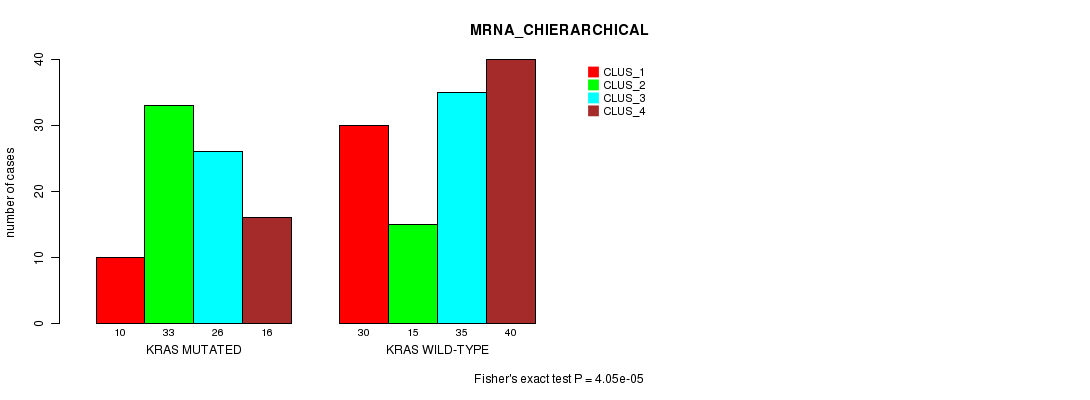
P value = 4.05e-05 (Fisher's exact test), Q value = 0.0064
Table S6. Gene #5: 'KRAS MUTATION STATUS' versus Clinical Feature #2: 'MRNA_CHIERARCHICAL'
| nPatients | CLUS_1 | CLUS_2 | CLUS_3 | CLUS_4 |
|---|---|---|---|---|
| ALL | 40 | 48 | 61 | 56 |
| KRAS MUTATED | 10 | 33 | 26 | 16 |
| KRAS WILD-TYPE | 30 | 15 | 35 | 40 |
Figure S6. Get High-res Image Gene #5: 'KRAS MUTATION STATUS' versus Clinical Feature #2: 'MRNA_CHIERARCHICAL'
P value = 0.000482 (Fisher's exact test), Q value = 0.075
Table S7. Gene #6: 'TP53 MUTATION STATUS' versus Clinical Feature #2: 'MRNA_CHIERARCHICAL'
| nPatients | CLUS_1 | CLUS_2 | CLUS_3 | CLUS_4 |
|---|---|---|---|---|
| ALL | 40 | 48 | 61 | 56 |
| TP53 MUTATED | 30 | 19 | 25 | 36 |
| TP53 WILD-TYPE | 10 | 29 | 36 | 20 |
Figure S7. Get High-res Image Gene #6: 'TP53 MUTATION STATUS' versus Clinical Feature #2: 'MRNA_CHIERARCHICAL'
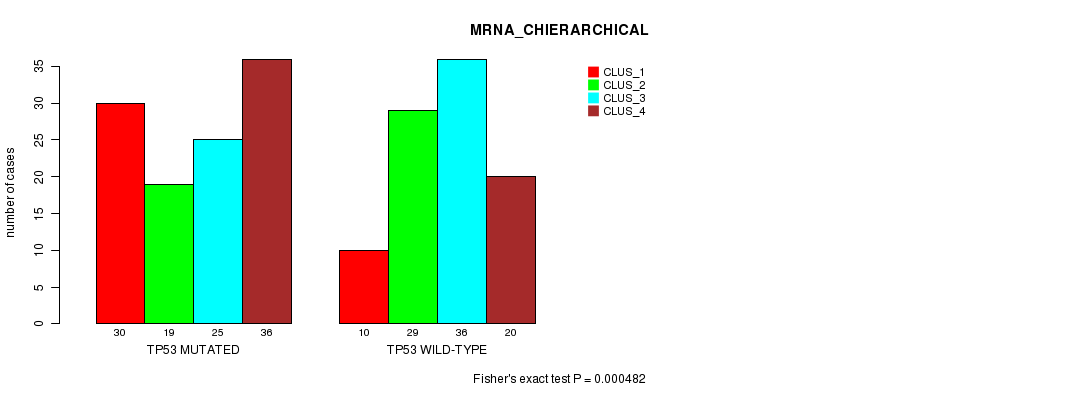
P value = 2.01e-12 (Fisher's exact test), Q value = 3.3e-10
Table S8. Gene #6: 'TP53 MUTATION STATUS' versus Clinical Feature #3: 'CN_CNMF'
| nPatients | CLUS_1 | CLUS_2 | CLUS_3 | CLUS_4 |
|---|---|---|---|---|
| ALL | 77 | 82 | 56 | 5 |
| TP53 MUTATED | 61 | 19 | 35 | 2 |
| TP53 WILD-TYPE | 16 | 63 | 21 | 3 |
Figure S8. Get High-res Image Gene #6: 'TP53 MUTATION STATUS' versus Clinical Feature #3: 'CN_CNMF'
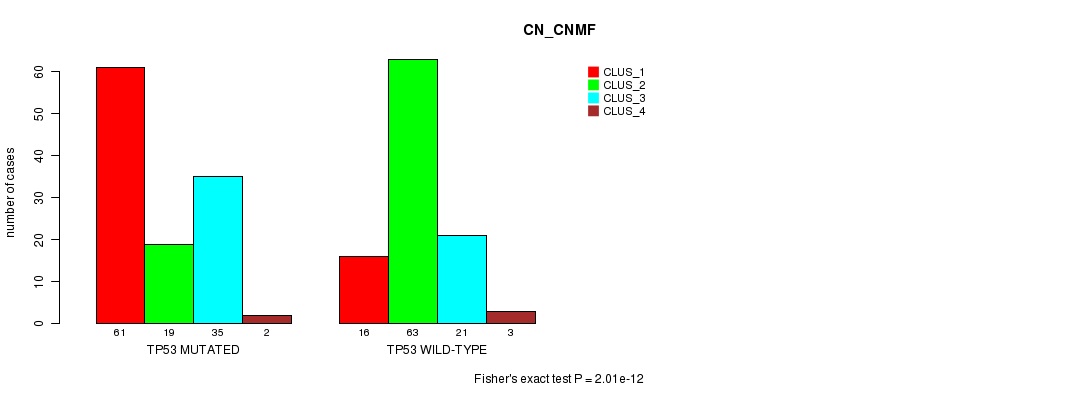
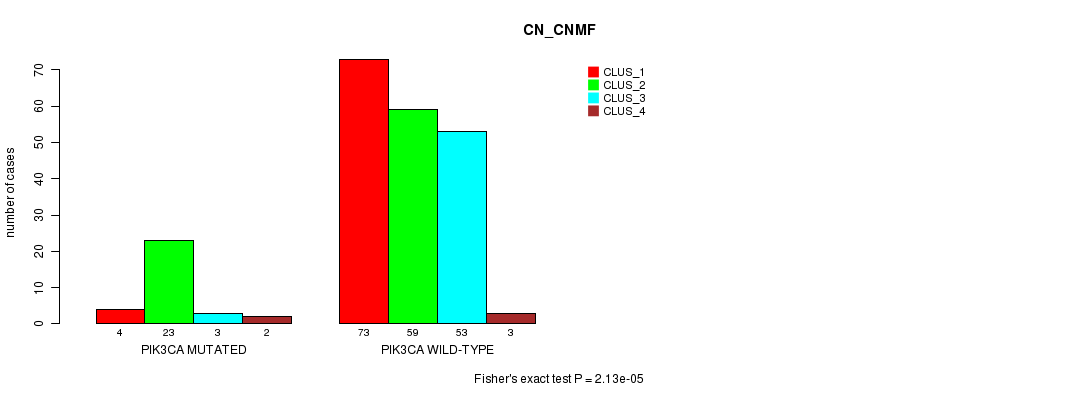
P value = 2.13e-05 (Fisher's exact test), Q value = 0.0034
Table S9. Gene #9: 'PIK3CA MUTATION STATUS' versus Clinical Feature #3: 'CN_CNMF'
| nPatients | CLUS_1 | CLUS_2 | CLUS_3 | CLUS_4 |
|---|---|---|---|---|
| ALL | 77 | 82 | 56 | 5 |
| PIK3CA MUTATED | 4 | 23 | 3 | 2 |
| PIK3CA WILD-TYPE | 73 | 59 | 53 | 3 |
Figure S9. Get High-res Image Gene #9: 'PIK3CA MUTATION STATUS' versus Clinical Feature #3: 'CN_CNMF'
-
Mutation data file = COADREAD-TP.mutsig.cluster.txt
-
Molecular subtypes file = COADREAD-TP.transferedmergedcluster.txt
-
Number of patients = 223
-
Number of significantly mutated genes = 24
-
Number of Molecular subtypes = 8
-
Exclude genes that fewer than K tumors have mutations, K = 3
For binary or multi-class clinical features (nominal or ordinal), two-tailed Fisher's exact tests (Fisher 1922) were used to estimate the P values using the 'fisher.test' function in R
For multiple hypothesis correction, Q value is the False Discovery Rate (FDR) analogue of the P value (Benjamini and Hochberg 1995), defined as the minimum FDR at which the test may be called significant. We used the 'Benjamini and Hochberg' method of 'p.adjust' function in R to convert P values into Q values.
In addition to the links below, the full results of the analysis summarized in this report can also be downloaded programmatically using firehose_get, or interactively from either the Broad GDAC website or TCGA Data Coordination Center Portal.