This pipeline computes the correlation between significantly recurrent gene mutations and selected clinical features.
Testing the association between mutation status of 48 genes and 10 clinical features across 306 patients, 5 significant findings detected with Q value < 0.25.
-
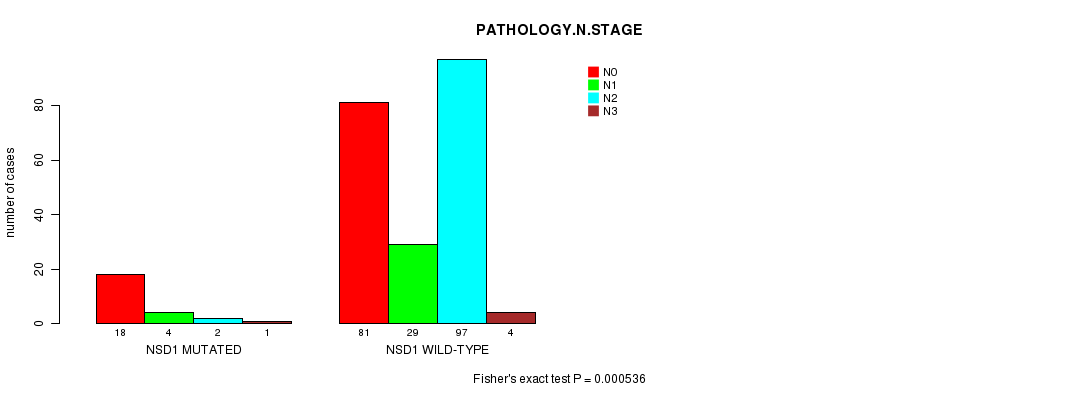
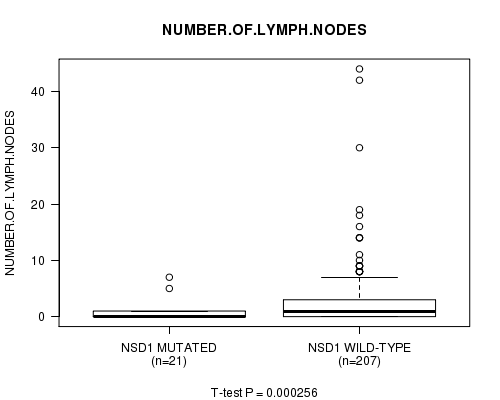
NSD1 mutation correlated to 'PATHOLOGY.N.STAGE' and 'NUMBER.OF.LYMPH.NODES'.
-
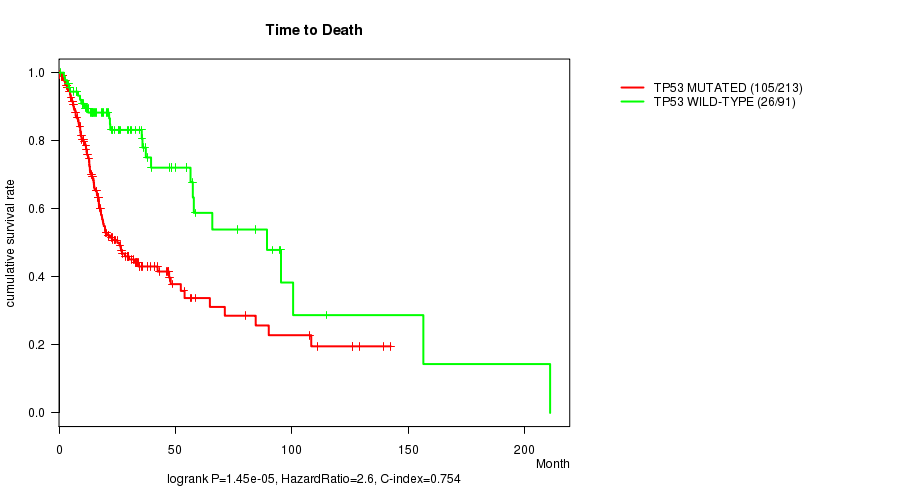
TP53 mutation correlated to 'Time to Death'.
-
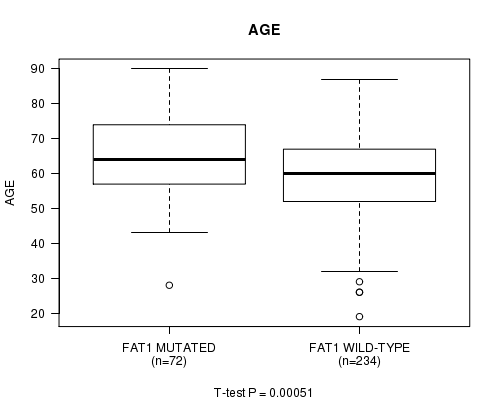
FAT1 mutation correlated to 'AGE'.
-
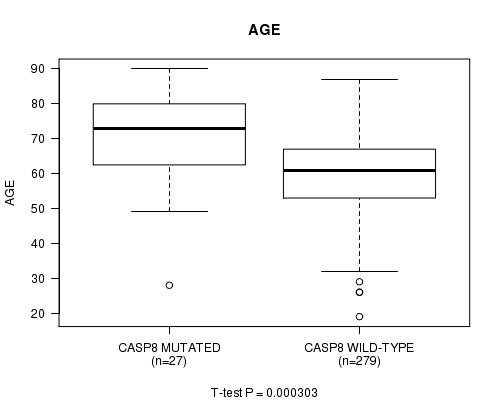
CASP8 mutation correlated to 'AGE'.
Table 1. Get Full Table Overview of the association between mutation status of 48 genes and 10 clinical features. Shown in the table are P values (Q values). Thresholded by Q value < 0.25, 5 significant findings detected.
|
Clinical Features |
Time to Death |
AGE |
NEOPLASM DISEASESTAGE |
PATHOLOGY T STAGE |
PATHOLOGY N STAGE |
GENDER |
RADIATIONS RADIATION REGIMENINDICATION |
NUMBERPACKYEARSSMOKED | YEAROFTOBACCOSMOKINGONSET |
NUMBER OF LYMPH NODES |
||
| nMutated (%) | nWild-Type | logrank test | t-test | Chi-square test | Fisher's exact test | Fisher's exact test | Fisher's exact test | Fisher's exact test | t-test | t-test | t-test | |
| NSD1 | 33 (11%) | 273 |
0.0974 (1.00) |
0.0819 (1.00) |
0.0577 (1.00) |
0.778 (1.00) |
0.000536 (0.246) |
0.301 (1.00) |
0.304 (1.00) |
0.21 (1.00) |
0.94 (1.00) |
0.000256 (0.118) |
| TP53 | 214 (70%) | 92 |
1.45e-05 (0.00671) |
0.769 (1.00) |
0.00795 (1.00) |
0.00577 (1.00) |
0.0156 (1.00) |
0.781 (1.00) |
0.478 (1.00) |
0.109 (1.00) |
0.798 (1.00) |
0.0201 (1.00) |
| FAT1 | 72 (24%) | 234 |
0.521 (1.00) |
0.00051 (0.235) |
0.61 (1.00) |
0.537 (1.00) |
0.792 (1.00) |
0.131 (1.00) |
1 (1.00) |
0.509 (1.00) |
0.13 (1.00) |
0.867 (1.00) |
| CASP8 | 27 (9%) | 279 |
0.831 (1.00) |
0.000303 (0.139) |
0.266 (1.00) |
0.559 (1.00) |
0.0852 (1.00) |
0.00127 (0.583) |
0.492 (1.00) |
0.229 (1.00) |
0.13 (1.00) |
0.0942 (1.00) |
| POLDIP2 | 6 (2%) | 300 |
0.703 (1.00) |
0.0379 (1.00) |
0.142 (1.00) |
0.159 (1.00) |
0.315 (1.00) |
1 (1.00) |
0.346 (1.00) |
0.97 (1.00) |
0.0135 (1.00) |
0.000719 (0.329) |
| NUDT11 | 6 (2%) | 300 |
0.891 (1.00) |
0.992 (1.00) |
0.67 (1.00) |
1 (1.00) |
0.668 (1.00) |
0.193 (1.00) |
1 (1.00) |
0.313 (1.00) |
0.287 (1.00) |
|
| PIK3CA | 64 (21%) | 242 |
0.259 (1.00) |
0.832 (1.00) |
0.49 (1.00) |
0.742 (1.00) |
0.465 (1.00) |
0.114 (1.00) |
1 (1.00) |
0.709 (1.00) |
0.917 (1.00) |
0.38 (1.00) |
| CDKN2A | 66 (22%) | 240 |
0.586 (1.00) |
0.681 (1.00) |
0.324 (1.00) |
0.665 (1.00) |
0.971 (1.00) |
0.876 (1.00) |
0.636 (1.00) |
0.0807 (1.00) |
0.405 (1.00) |
0.928 (1.00) |
| HRAS | 10 (3%) | 296 |
0.0676 (1.00) |
0.227 (1.00) |
0.0975 (1.00) |
0.241 (1.00) |
0.0486 (1.00) |
1 (1.00) |
0.463 (1.00) |
0.146 (1.00) |
0.216 (1.00) |
0.211 (1.00) |
| NFE2L2 | 17 (6%) | 289 |
0.0934 (1.00) |
0.00698 (1.00) |
0.699 (1.00) |
0.772 (1.00) |
1 (1.00) |
0.261 (1.00) |
0.255 (1.00) |
0.917 (1.00) |
0.308 (1.00) |
0.677 (1.00) |
| NOTCH1 | 59 (19%) | 247 |
0.457 (1.00) |
0.142 (1.00) |
0.832 (1.00) |
0.786 (1.00) |
0.822 (1.00) |
0.256 (1.00) |
0.323 (1.00) |
0.00955 (1.00) |
0.824 (1.00) |
0.158 (1.00) |
| MLL2 | 56 (18%) | 250 |
0.742 (1.00) |
0.993 (1.00) |
0.271 (1.00) |
0.242 (1.00) |
0.893 (1.00) |
0.869 (1.00) |
0.406 (1.00) |
0.381 (1.00) |
0.357 (1.00) |
0.0691 (1.00) |
| JUB | 18 (6%) | 288 |
0.18 (1.00) |
0.0802 (1.00) |
0.709 (1.00) |
0.455 (1.00) |
0.296 (1.00) |
1 (1.00) |
1 (1.00) |
0.519 (1.00) |
0.0649 (1.00) |
0.929 (1.00) |
| FBXW7 | 15 (5%) | 291 |
0.687 (1.00) |
0.0958 (1.00) |
0.472 (1.00) |
0.635 (1.00) |
0.295 (1.00) |
0.372 (1.00) |
1 (1.00) |
0.405 (1.00) |
0.371 (1.00) |
0.373 (1.00) |
| EPHA2 | 14 (5%) | 292 |
0.0463 (1.00) |
0.891 (1.00) |
0.649 (1.00) |
0.932 (1.00) |
0.188 (1.00) |
0.221 (1.00) |
1 (1.00) |
0.00774 (1.00) |
0.06 (1.00) |
0.342 (1.00) |
| ZNF750 | 13 (4%) | 293 |
0.848 (1.00) |
0.845 (1.00) |
0.478 (1.00) |
0.0594 (1.00) |
0.749 (1.00) |
0.123 (1.00) |
0.526 (1.00) |
0.917 (1.00) |
0.16 (1.00) |
0.767 (1.00) |
| FLG | 48 (16%) | 258 |
0.947 (1.00) |
0.605 (1.00) |
0.67 (1.00) |
0.599 (1.00) |
0.0736 (1.00) |
1 (1.00) |
0.595 (1.00) |
0.785 (1.00) |
0.449 (1.00) |
0.353 (1.00) |
| B2M | 7 (2%) | 299 |
0.229 (1.00) |
0.483 (1.00) |
0.874 (1.00) |
0.61 (1.00) |
1 (1.00) |
0.681 (1.00) |
||||
| HLA-A | 14 (5%) | 292 |
0.92 (1.00) |
0.59 (1.00) |
0.963 (1.00) |
0.491 (1.00) |
0.933 (1.00) |
1 (1.00) |
0.0569 (1.00) |
0.643 (1.00) |
0.731 (1.00) |
0.00284 (1.00) |
| EP300 | 25 (8%) | 281 |
0.469 (1.00) |
0.536 (1.00) |
0.77 (1.00) |
0.951 (1.00) |
0.606 (1.00) |
0.641 (1.00) |
1 (1.00) |
0.12 (1.00) |
0.726 (1.00) |
0.533 (1.00) |
| IL32 | 4 (1%) | 302 |
0.132 (1.00) |
0.932 (1.00) |
0.0107 (1.00) |
0.878 (1.00) |
0.065 (1.00) |
0.303 (1.00) |
0.576 (1.00) |
0.802 (1.00) |
||
| RHOA | 4 (1%) | 302 |
0.299 (1.00) |
0.916 (1.00) |
0.843 (1.00) |
0.224 (1.00) |
0.406 (1.00) |
0.303 (1.00) |
0.576 (1.00) |
0.00203 (0.926) |
0.545 (1.00) |
0.148 (1.00) |
| CTCF | 11 (4%) | 295 |
0.543 (1.00) |
0.0444 (1.00) |
0.468 (1.00) |
0.935 (1.00) |
0.658 (1.00) |
0.181 (1.00) |
0.486 (1.00) |
0.155 (1.00) |
0.19 (1.00) |
0.244 (1.00) |
| RB1 | 10 (3%) | 296 |
0.233 (1.00) |
0.714 (1.00) |
0.0938 (1.00) |
0.24 (1.00) |
0.668 (1.00) |
0.145 (1.00) |
1 (1.00) |
0.86 (1.00) |
0.646 (1.00) |
0.772 (1.00) |
| CSMD3 | 70 (23%) | 236 |
0.871 (1.00) |
0.973 (1.00) |
0.0452 (1.00) |
0.202 (1.00) |
0.00528 (1.00) |
1 (1.00) |
1 (1.00) |
0.0799 (1.00) |
0.503 (1.00) |
0.348 (1.00) |
| TGFBR2 | 10 (3%) | 296 |
0.799 (1.00) |
0.0292 (1.00) |
0.886 (1.00) |
0.71 (1.00) |
0.341 (1.00) |
0.47 (1.00) |
0.0684 (1.00) |
0.285 (1.00) |
0.00837 (1.00) |
0.0464 (1.00) |
| NECAB1 | 6 (2%) | 300 |
0.812 (1.00) |
0.00999 (1.00) |
0.607 (1.00) |
0.517 (1.00) |
1 (1.00) |
0.351 (1.00) |
1 (1.00) |
0.815 (1.00) |
0.0423 (1.00) |
0.287 (1.00) |
| MAPK1 | 4 (1%) | 302 |
0.419 (1.00) |
0.292 (1.00) |
0.553 (1.00) |
0.514 (1.00) |
0.562 (1.00) |
1 (1.00) |
0.576 (1.00) |
0.993 (1.00) |
||
| PLSCR1 | 5 (2%) | 301 |
0.0743 (1.00) |
0.395 (1.00) |
0.762 (1.00) |
0.834 (1.00) |
0.432 (1.00) |
1 (1.00) |
1 (1.00) |
0.303 (1.00) |
0.913 (1.00) |
|
| CNPY3 | 3 (1%) | 303 |
0.754 (1.00) |
0.0807 (1.00) |
0.688 (1.00) |
0.84 (1.00) |
1 (1.00) |
0.564 (1.00) |
1 (1.00) |
0.891 (1.00) |
0.0979 (1.00) |
0.541 (1.00) |
| EPB41L3 | 16 (5%) | 290 |
0.794 (1.00) |
0.84 (1.00) |
0.666 (1.00) |
0.846 (1.00) |
0.933 (1.00) |
0.153 (1.00) |
0.77 (1.00) |
0.372 (1.00) |
0.649 (1.00) |
0.0417 (1.00) |
| RAC1 | 9 (3%) | 297 |
0.602 (1.00) |
0.00682 (1.00) |
0.557 (1.00) |
0.412 (1.00) |
0.217 (1.00) |
0.0676 (1.00) |
1 (1.00) |
0.732 (1.00) |
0.00478 (1.00) |
0.0293 (1.00) |
| RANGAP1 | 4 (1%) | 302 |
0.491 (1.00) |
0.713 (1.00) |
0.00969 (1.00) |
0.0236 (1.00) |
1 (1.00) |
0.00539 (1.00) |
0.576 (1.00) |
0.212 (1.00) |
||
| ZCCHC3 | 5 (2%) | 301 |
0.397 (1.00) |
0.465 (1.00) |
0.446 (1.00) |
0.269 (1.00) |
0.607 (1.00) |
0.129 (1.00) |
0.609 (1.00) |
0.316 (1.00) |
0.746 (1.00) |
0.957 (1.00) |
| CUL3 | 10 (3%) | 296 |
0.6 (1.00) |
0.467 (1.00) |
0.364 (1.00) |
0.0875 (1.00) |
0.423 (1.00) |
0.733 (1.00) |
0.134 (1.00) |
0.541 (1.00) |
0.195 (1.00) |
0.984 (1.00) |
| PRB2 | 10 (3%) | 296 |
0.795 (1.00) |
0.639 (1.00) |
0.507 (1.00) |
0.227 (1.00) |
0.658 (1.00) |
0.067 (1.00) |
0.463 (1.00) |
0.233 (1.00) |
0.847 (1.00) |
0.471 (1.00) |
| PRB1 | 7 (2%) | 299 |
0.409 (1.00) |
0.528 (1.00) |
0.683 (1.00) |
0.618 (1.00) |
0.459 (1.00) |
0.196 (1.00) |
0.0792 (1.00) |
0.255 (1.00) |
0.866 (1.00) |
0.981 (1.00) |
| TRPV4 | 7 (2%) | 299 |
0.0563 (1.00) |
0.786 (1.00) |
0.917 (1.00) |
1 (1.00) |
0.302 (1.00) |
0.678 (1.00) |
0.383 (1.00) |
0.718 (1.00) |
0.606 (1.00) |
|
| WHSC1 | 10 (3%) | 296 |
0.121 (1.00) |
0.469 (1.00) |
0.758 (1.00) |
0.19 (1.00) |
0.357 (1.00) |
0.733 (1.00) |
0.725 (1.00) |
0.0803 (1.00) |
0.782 (1.00) |
0.0281 (1.00) |
| EPDR1 | 6 (2%) | 300 |
0.452 (1.00) |
0.805 (1.00) |
0.67 (1.00) |
0.587 (1.00) |
0.268 (1.00) |
0.668 (1.00) |
0.654 (1.00) |
0.905 (1.00) |
0.167 (1.00) |
0.326 (1.00) |
| KCNA3 | 8 (3%) | 298 |
0.251 (1.00) |
0.2 (1.00) |
0.474 (1.00) |
0.568 (1.00) |
1 (1.00) |
0.222 (1.00) |
1 (1.00) |
0.79 (1.00) |
0.528 (1.00) |
0.502 (1.00) |
| HIST1H1B | 7 (2%) | 299 |
0.267 (1.00) |
0.0857 (1.00) |
0.223 (1.00) |
0.898 (1.00) |
0.131 (1.00) |
0.398 (1.00) |
0.681 (1.00) |
0.496 (1.00) |
||
| STEAP4 | 10 (3%) | 296 |
0.101 (1.00) |
0.981 (1.00) |
0.768 (1.00) |
0.13 (1.00) |
1 (1.00) |
0.295 (1.00) |
0.463 (1.00) |
0.0376 (1.00) |
0.36 (1.00) |
0.669 (1.00) |
| SLC26A7 | 8 (3%) | 298 |
0.32 (1.00) |
0.126 (1.00) |
0.35 (1.00) |
0.701 (1.00) |
0.688 (1.00) |
0.689 (1.00) |
0.435 (1.00) |
0.232 (1.00) |
0.135 (1.00) |
0.0282 (1.00) |
| FCRL4 | 13 (4%) | 293 |
0.333 (1.00) |
0.223 (1.00) |
0.664 (1.00) |
0.254 (1.00) |
0.558 (1.00) |
0.526 (1.00) |
1 (1.00) |
0.107 (1.00) |
0.0868 (1.00) |
0.89 (1.00) |
| OR8D4 | 6 (2%) | 300 |
0.352 (1.00) |
0.132 (1.00) |
0.632 (1.00) |
0.762 (1.00) |
0.432 (1.00) |
1 (1.00) |
1 (1.00) |
0.793 (1.00) |
0.262 (1.00) |
0.154 (1.00) |
| TXK | 3 (1%) | 303 |
0.547 (1.00) |
0.538 (1.00) |
0.688 (1.00) |
0.328 (1.00) |
1 (1.00) |
1 (1.00) |
0.168 (1.00) |
0.966 (1.00) |
||
| POU4F2 | 7 (2%) | 299 |
0.292 (1.00) |
0.354 (1.00) |
0.0905 (1.00) |
0.0869 (1.00) |
0.268 (1.00) |
0.196 (1.00) |
1 (1.00) |
0.453 (1.00) |
0.727 (1.00) |
0.976 (1.00) |
P value = 0.000536 (Fisher's exact test), Q value = 0.25
Table S1. Gene #2: 'NSD1 MUTATION STATUS' versus Clinical Feature #5: 'PATHOLOGY.N.STAGE'
| nPatients | N0 | N1 | N2 | N3 |
|---|---|---|---|---|
| ALL | 99 | 33 | 99 | 5 |
| NSD1 MUTATED | 18 | 4 | 2 | 1 |
| NSD1 WILD-TYPE | 81 | 29 | 97 | 4 |
Figure S1. Get High-res Image Gene #2: 'NSD1 MUTATION STATUS' versus Clinical Feature #5: 'PATHOLOGY.N.STAGE'
P value = 0.000256 (t-test), Q value = 0.12
Table S2. Gene #2: 'NSD1 MUTATION STATUS' versus Clinical Feature #10: 'NUMBER.OF.LYMPH.NODES'
| nPatients | Mean (Std.Dev) | |
|---|---|---|
| ALL | 228 | 2.7 (5.3) |
| NSD1 MUTATED | 21 | 0.8 (1.8) |
| NSD1 WILD-TYPE | 207 | 2.9 (5.5) |
Figure S2. Get High-res Image Gene #2: 'NSD1 MUTATION STATUS' versus Clinical Feature #10: 'NUMBER.OF.LYMPH.NODES'
P value = 1.45e-05 (logrank test), Q value = 0.0067
Table S3. Gene #7: 'TP53 MUTATION STATUS' versus Clinical Feature #1: 'Time to Death'
| nPatients | nDeath | Duration Range (Median), Month | |
|---|---|---|---|
| ALL | 304 | 131 | 0.1 - 210.9 (17.1) |
| TP53 MUTATED | 213 | 105 | 0.1 - 142.5 (15.9) |
| TP53 WILD-TYPE | 91 | 26 | 0.8 - 210.9 (23.1) |
Figure S3. Get High-res Image Gene #7: 'TP53 MUTATION STATUS' versus Clinical Feature #1: 'Time to Death'
P value = 0.00051 (t-test), Q value = 0.23
Table S4. Gene #10: 'FAT1 MUTATION STATUS' versus Clinical Feature #2: 'AGE'
| nPatients | Mean (Std.Dev) | |
|---|---|---|
| ALL | 306 | 61.1 (12.1) |
| FAT1 MUTATED | 72 | 65.5 (12.0) |
| FAT1 WILD-TYPE | 234 | 59.8 (11.9) |
Figure S4. Get High-res Image Gene #10: 'FAT1 MUTATION STATUS' versus Clinical Feature #2: 'AGE'
P value = 0.000303 (t-test), Q value = 0.14
Table S5. Gene #11: 'CASP8 MUTATION STATUS' versus Clinical Feature #2: 'AGE'
| nPatients | Mean (Std.Dev) | |
|---|---|---|
| ALL | 306 | 61.1 (12.1) |
| CASP8 MUTATED | 27 | 71.1 (13.4) |
| CASP8 WILD-TYPE | 279 | 60.2 (11.6) |
Figure S5. Get High-res Image Gene #11: 'CASP8 MUTATION STATUS' versus Clinical Feature #2: 'AGE'
-
Mutation data file = HNSC-TP.mutsig.cluster.txt
-
Clinical data file = HNSC-TP.clin.merged.picked.txt
-
Number of patients = 306
-
Number of significantly mutated genes = 48
-
Number of selected clinical features = 10
-
Exclude genes that fewer than K tumors have mutations, K = 3
For survival clinical features, the Kaplan-Meier survival curves of tumors with and without gene mutations were plotted and the statistical significance P values were estimated by logrank test (Bland and Altman 2004) using the 'survdiff' function in R
For continuous numerical clinical features, two-tailed Student's t test with unequal variance (Lehmann and Romano 2005) was applied to compare the clinical values between tumors with and without gene mutations using 't.test' function in R
For multi-class clinical features (nominal or ordinal), Chi-square tests (Greenwood and Nikulin 1996) were used to estimate the P values using the 'chisq.test' function in R
For binary or multi-class clinical features (nominal or ordinal), two-tailed Fisher's exact tests (Fisher 1922) were used to estimate the P values using the 'fisher.test' function in R
For multiple hypothesis correction, Q value is the False Discovery Rate (FDR) analogue of the P value (Benjamini and Hochberg 1995), defined as the minimum FDR at which the test may be called significant. We used the 'Benjamini and Hochberg' method of 'p.adjust' function in R to convert P values into Q values.
In addition to the links below, the full results of the analysis summarized in this report can also be downloaded programmatically using firehose_get, or interactively from either the Broad GDAC website or TCGA Data Coordination Center Portal.