This pipeline computes the correlation between significant copy number variation (cnv focal) genes and selected clinical features.
Testing the association between copy number variation 2 focal events and 10 clinical features across 64 patients, one significant finding detected with Q value < 0.25.
-
AMP PEAK 1(8Q11.23) MUTATION ANALYSIS cnv correlated to 'YEAROFTOBACCOSMOKINGONSET'.
Table 1. Get Full Table Overview of the association between significant copy number variation of 2 focal events and 10 clinical features. Shown in the table are P values (Q values). Thresholded by Q value < 0.25, one significant finding detected.
|
Clinical Features |
Time to Death |
AGE |
NEOPLASM DISEASESTAGE |
PATHOLOGY T STAGE |
PATHOLOGY N STAGE |
PATHOLOGY M STAGE |
GENDER |
KARNOFSKY PERFORMANCE SCORE |
NUMBERPACKYEARSSMOKED | YEAROFTOBACCOSMOKINGONSET | ||
| nCNV (%) | nWild-Type | logrank test | t-test | Fisher's exact test | Fisher's exact test | Fisher's exact test | Fisher's exact test | Fisher's exact test | t-test | t-test | t-test | |
| AMP PEAK 1(8Q11 23) MUTATION ANALYSIS | 17 (27%) | 47 |
0.167 (1.00) |
0.306 (1.00) |
0.0913 (1.00) |
0.683 (1.00) |
0.315 (1.00) |
0.0939 (1.00) |
0.155 (1.00) |
0.863 (1.00) |
0.473 (1.00) |
0.0084 (0.168) |
| AMP PEAK 2(15Q22 31) MUTATION ANALYSIS | 21 (33%) | 43 |
0.0203 (0.386) |
0.628 (1.00) |
0.177 (1.00) |
0.565 (1.00) |
0.141 (1.00) |
0.107 (1.00) |
0.592 (1.00) |
0.863 (1.00) |
0.551 (1.00) |
0.0341 (0.614) |
P value = 0.0084 (t-test), Q value = 0.17
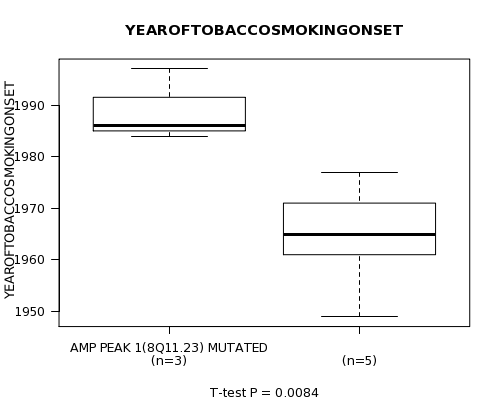
Table S1. Gene #1: 'AMP PEAK 1(8Q11.23) MUTATION STATUS' versus Clinical Feature #10: 'YEAROFTOBACCOSMOKINGONSET'
| nPatients | Mean (Std.Dev) | |
|---|---|---|
| ALL | 8 | 1973.8 (15.4) |
| AMP PEAK 1(8Q11.23) MUTATED | 3 | 1989.0 (7.0) |
| AMP PEAK 1(8Q11.23) WILD-TYPE | 5 | 1964.6 (10.6) |
Figure S1. Get High-res Image Gene #1: 'AMP PEAK 1(8Q11.23) MUTATION STATUS' versus Clinical Feature #10: 'YEAROFTOBACCOSMOKINGONSET'
-
Copy number data file = transformed.cor.cli.txt
-
Clinical data file = KICH-TP.clin.merged.picked.txt
-
Number of patients = 64
-
Number of significantly focal cnvs = 2
-
Number of selected clinical features = 10
-
Exclude genes that fewer than K tumors have mutations, K = 3
For survival clinical features, the Kaplan-Meier survival curves of tumors with and without gene mutations were plotted and the statistical significance P values were estimated by logrank test (Bland and Altman 2004) using the 'survdiff' function in R
For continuous numerical clinical features, two-tailed Student's t test with unequal variance (Lehmann and Romano 2005) was applied to compare the clinical values between tumors with and without gene mutations using 't.test' function in R
For binary or multi-class clinical features (nominal or ordinal), two-tailed Fisher's exact tests (Fisher 1922) were used to estimate the P values using the 'fisher.test' function in R
For multiple hypothesis correction, Q value is the False Discovery Rate (FDR) analogue of the P value (Benjamini and Hochberg 1995), defined as the minimum FDR at which the test may be called significant. We used the 'Benjamini and Hochberg' method of 'p.adjust' function in R to convert P values into Q values.
In addition to the links below, the full results of the analysis summarized in this report can also be downloaded programmatically using firehose_get, or interactively from either the Broad GDAC website or TCGA Data Coordination Center Portal.