This report serves to describe the mutational landscape and properties of a given individual set, as well as rank genes and genesets according to mutational significance. MutSig v2.0 was used to generate the results found in this report.
-
Working with individual set: KICH-TP
-
Number of patients in set: 66
The input for this pipeline is a set of individuals with the following files associated for each:
-
An annotated .maf file describing the mutations called for the respective individual, and their properties.
-
A .wig file that contains information about the coverage of the sample.
-
MAF used for this analysis:KICH-TP.final_analysis_set.maf
-
Significantly mutated genes (q ≤ 0.1): 7
-
Mutations seen in COSMIC: 43
-
Significantly mutated genes in COSMIC territory: 2
-
Genes with clustered mutations (≤ 3 aa apart): 13
-
Significantly mutated genesets: 38
-
Significantly mutated genesets: (excluding sig. mutated genes):1
-
Read 66 MAFs of type "Broad"
-
Read 65 MAFs of type "Baylor-Illumina"
-
Total number of mutations in input MAFs: 5623
-
After removing 59 mutations outside chr1-24: 5564
-
After removing 79 noncoding mutations: 5485
-
After collapsing adjacent/redundant mutations: 4230
-
Number of mutations before filtering: 4230
-
After removing 176 mutations outside gene set: 4054
-
After removing 17 mutations outside category set: 4037
-
After removing 1 "impossible" mutations in
-
gene-patient-category bins of zero coverage: 3843
Table 1. Get Full Table Table representing breakdown of mutations by type.
| type | count |
|---|---|
| Frame_Shift_Del | 207 |
| Frame_Shift_Ins | 233 |
| In_Frame_Del | 55 |
| In_Frame_Ins | 22 |
| Missense_Mutation | 2283 |
| Nonsense_Mutation | 130 |
| Nonstop_Mutation | 3 |
| Silent | 958 |
| Splice_Site | 146 |
| Total | 4037 |
Table 2. Get Full Table A breakdown of mutation rates per category discovered for this individual set.
| category | n | N | rate | rate_per_mb | relative_rate | exp_ns_s_ratio |
|---|---|---|---|---|---|---|
| *CpG->T | 893 | 114088540 | 7.8e-06 | 7.8 | 5.3 | 2.1 |
| *ApG->G | 165 | 320373592 | 5.2e-07 | 0.52 | 0.35 | 2.2 |
| *Np(A/C/T)->transit | 630 | 1646939625 | 3.8e-07 | 0.38 | 0.26 | 2 |
| transver | 595 | 2081401757 | 2.9e-07 | 0.29 | 0.19 | 5 |
| indel+null | 781 | 2081401757 | 3.8e-07 | 0.38 | 0.25 | NaN |
| double_null | 14 | 2081401757 | 6.7e-09 | 0.0067 | 0.0045 | NaN |
| Total | 3078 | 2081401757 | 1.5e-06 | 1.5 | 1 | 3.5 |
The x axis represents the samples. The y axis represents the exons, one row per exon, and they are sorted by average coverage across samples. For exons with exactly the same average coverage, they are sorted next by the %GC of the exon. (The secondary sort is especially useful for the zero-coverage exons at the bottom).
Figure 1.
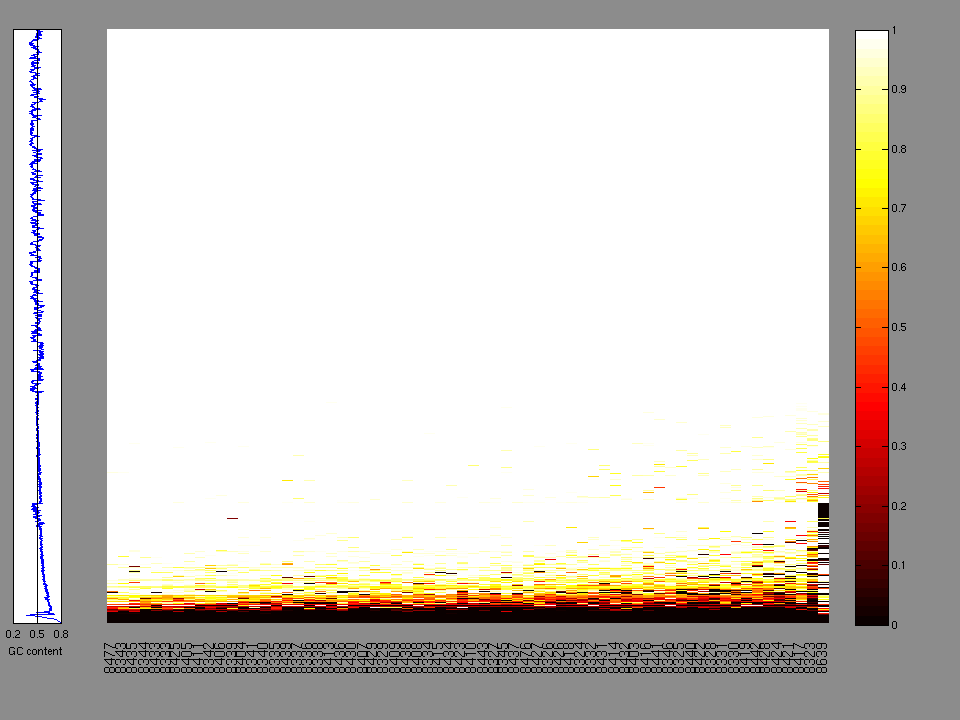
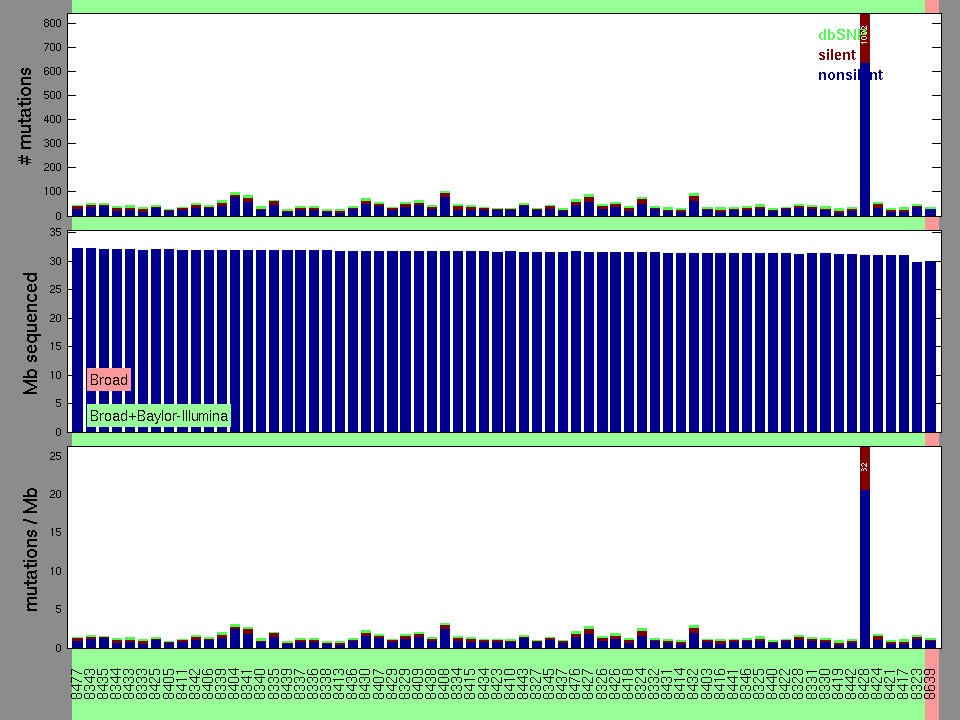
Figure 2. Patients counts and rates file used to generate this plot: KICH-TP.patients.counts_and_rates.txt
The mutation spectrum is depicted in the lego plots below in which the 96 possible mutation types are subdivided into six large blocks, color-coded to reflect the base substitution type. Each large block is further subdivided into the 16 possible pairs of 5' and 3' neighbors, as listed in the 4x4 trinucleotide context legend. The height of each block corresponds to the mutation frequency for that kind of mutation (counts of mutations normalized by the base coverage in a given bin). The shape of the spectrum is a signature for dominant mutational mechanisms in different tumor types.
Figure 3. Get High-res Image SNV Mutation rate lego plot for entire set. Each bin is normalized by base coverage for that bin. Colors represent the six SNV types on the upper right. The three-base context for each mutation is labeled in the 4x4 legend on the lower right. The fractional breakdown of SNV counts is shown in the pie chart on the upper left. If this figure is blank, not enough information was provided in the MAF to generate it.
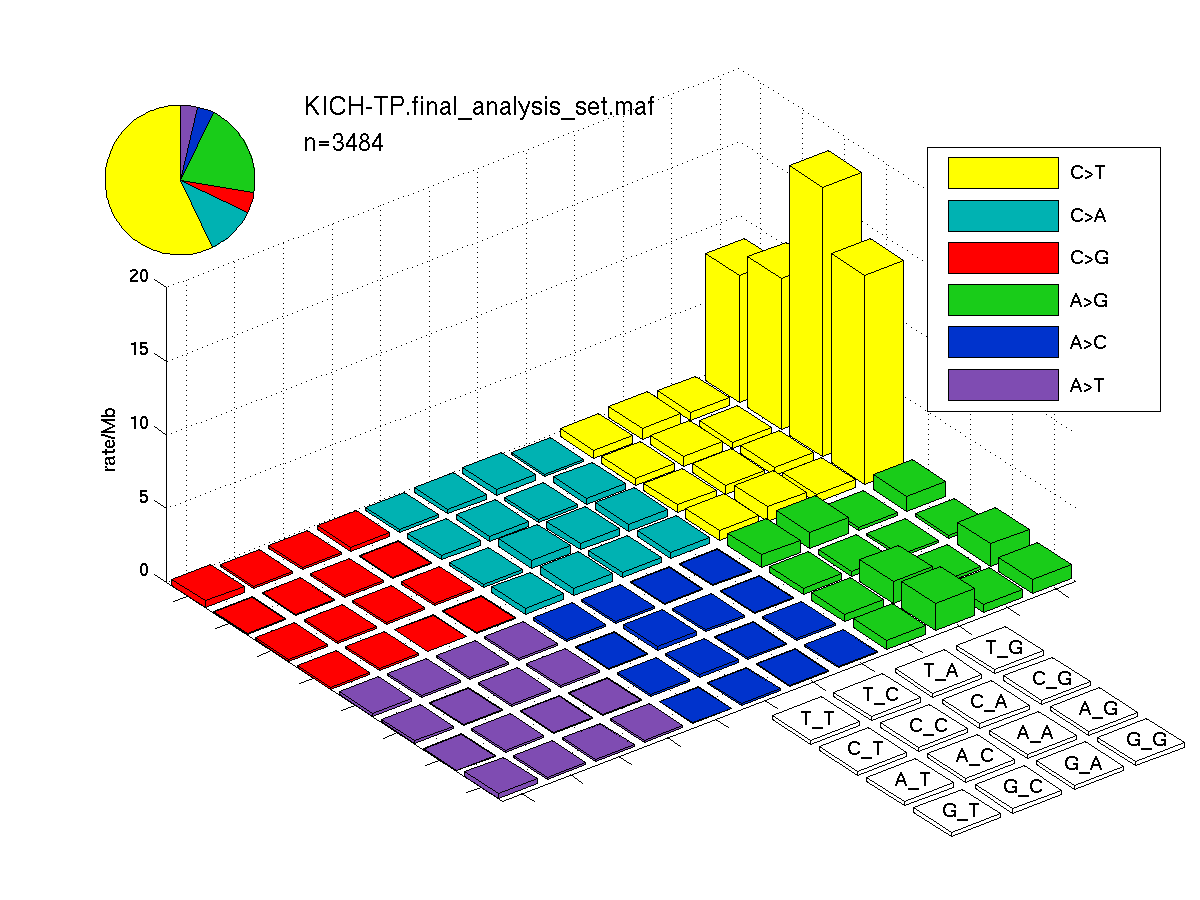
Figure 4. Get High-res Image SNV Mutation rate lego plots for 4 slices of mutation allele fraction (0<=AF<0.1, 0.1<=AF<0.25, 0.25<=AF<0.5, & 0.5<=AF) . The color code and three-base context legends are the same as the previous figure. If this figure is blank, not enough information was provided in the MAF to generate it.
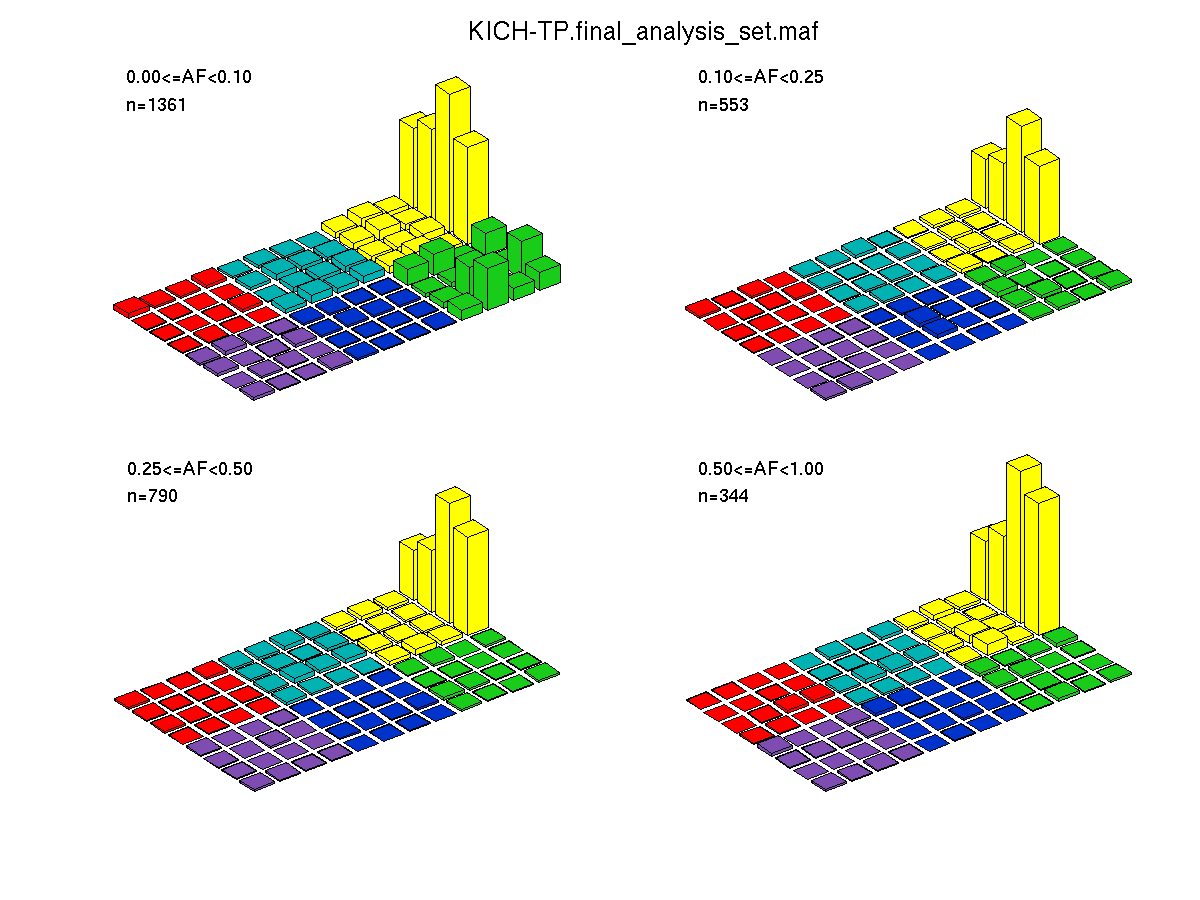
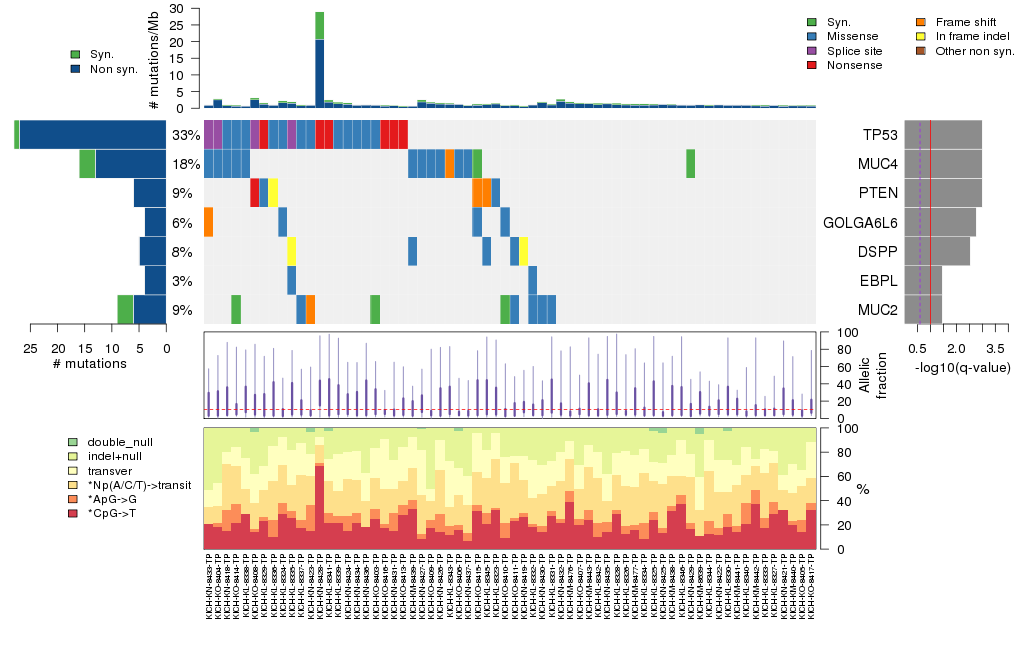
Figure 5. Get High-res Image The matrix in the center of the figure represents individual mutations in patient samples, color-coded by type of mutation, for the significantly mutated genes. The rate of synonymous and non-synonymous mutations is displayed at the top of the matrix. The barplot on the left of the matrix shows the number of mutations in each gene. The percentages represent the fraction of tumors with at least one mutation in the specified gene. The barplot to the right of the matrix displays the q-values for the most significantly mutated genes. The purple boxplots below the matrix (only displayed if required columns are present in the provided MAF) represent the distributions of allelic fractions observed in each sample. The plot at the bottom represents the base substitution distribution of individual samples, using the same categories that were used to calculate significance.
Column Descriptions:
-
N = number of sequenced bases in this gene across the individual set
-
n = number of (nonsilent) mutations in this gene across the individual set
-
npat = number of patients (individuals) with at least one nonsilent mutation
-
nsite = number of unique sites having a non-silent mutation
-
nsil = number of silent mutations in this gene across the individual set
-
n1 = number of nonsilent mutations of type: *CpG->T
-
n2 = number of nonsilent mutations of type: *ApG->G
-
n3 = number of nonsilent mutations of type: *Np(A/C/T)->transit
-
n4 = number of nonsilent mutations of type: transver
-
n5 = number of nonsilent mutations of type: indel+null
-
n6 = number of nonsilent mutations of type: double_null
-
p_classic = p-value for the observed amount of nonsilent mutations being elevated in this gene
-
p_ns_s = p-value for the observed nonsilent/silent ratio being elevated in this gene
-
p_cons = p-value for enrichment of mutations at evolutionarily most-conserved sites in gene
-
p_joint = p-value for clustering + conservation
-
p = p-value (overall)
-
q = q-value, False Discovery Rate (Benjamini-Hochberg procedure)
Table 3. Get Full Table A Ranked List of Significantly Mutated Genes. Number of significant genes found: 7. Number of genes displayed: 35. Click on a gene name to display its stick figure depicting the distribution of mutations and mutation types across the chosen gene (this feature may not be available for all significant genes).
| rank | gene | description | N | n | npat | nsite | nsil | n1 | n2 | n3 | n4 | n5 | n6 | p_classic | p_ns_s | p_clust | p_cons | p_joint | p | q |
|---|---|---|---|---|---|---|---|---|---|---|---|---|---|---|---|---|---|---|---|---|
| 1 | TP53 | tumor protein p53 | 85638 | 27 | 22 | 25 | 1 | 3 | 0 | 7 | 7 | 9 | 1 | 5.9e-15 | 0.0028 | 4.8e-06 | 0.00074 | 0 | <1.00e-15 | <1.86e-11 |
| 2 | MUC4 | mucin 4, cell surface associated | 233076 | 13 | 12 | 12 | 3 | 2 | 2 | 5 | 3 | 1 | 0 | 2.2e-12 | 0.4 | NaN | NaN | NaN | 2.21e-12 | 2.05e-08 |
| 3 | PTEN | phosphatase and tensin homolog (mutated in multiple advanced cancers 1) | 79333 | 6 | 6 | 6 | 0 | 0 | 0 | 1 | 1 | 4 | 0 | 1.9e-10 | 0.52 | 0.02 | 0.44 | 0.043 | 2.14e-10 | 1.33e-06 |
| 4 | GOLGA6L6 | golgin A6 family-like 6 | 62814 | 4 | 4 | 3 | 0 | 0 | 0 | 0 | 3 | 1 | 0 | 7.7e-07 | 0.78 | 0.0015 | 0.93 | 0.01 | 1.51e-07 | 0.000704 |
| 5 | DSPP | dentin sialophosphoprotein | 256252 | 5 | 5 | 5 | 0 | 0 | 0 | 1 | 2 | 2 | 0 | 4.5e-06 | 0.57 | 0.013 | 0.052 | 0.0061 | 5.09e-07 | 0.00189 |
| 6 | EBPL | emopamil binding protein-like | 32228 | 4 | 2 | 2 | 0 | 0 | 0 | 0 | 4 | 0 | 0 | 0.00049 | 0.51 | 0.00054 | 0.99 | 0.0014 | 1.06e-05 | 0.0328 |
| 7 | MUC2 | mucin 2, oligomeric mucus/gel-forming | 540346 | 6 | 6 | 6 | 3 | 1 | 0 | 3 | 1 | 1 | 0 | 0.018 | 0.79 | 2.4e-06 | 0.97 | 0.000048 | 1.26e-05 | 0.0335 |
| 8 | GFM1 | G elongation factor, mitochondrial 1 | 153540 | 3 | 3 | 2 | 0 | 0 | 0 | 1 | 0 | 2 | 0 | 0.00074 | 0.69 | 0.0021 | 0.98 | 0.006 | 5.96e-05 | 0.135 |
| 9 | MAP1LC3A | microtubule-associated protein 1 light chain 3 alpha | 21983 | 2 | 2 | 2 | 0 | 0 | 1 | 1 | 0 | 0 | 0 | 0.000013 | 0.55 | 0.67 | 0.14 | 0.38 | 6.55e-05 | 0.135 |
| 10 | DPPA3 | developmental pluripotency associated 3 | 32736 | 3 | 3 | 3 | 0 | 0 | 0 | 1 | 0 | 2 | 0 | 7.7e-06 | 0.69 | 0.45 | 0.63 | 1 | 9.89e-05 | 0.184 |
| 11 | GNPNAT1 | glucosamine-phosphate N-acetyltransferase 1 | 37950 | 2 | 2 | 2 | 0 | 0 | 0 | 0 | 0 | 2 | 0 | 0.00013 | 1 | NaN | NaN | NaN | 0.000130 | 0.220 |
| 12 | RIPPLY2 | ripply2 homolog (zebrafish) | 19937 | 2 | 2 | 1 | 0 | 0 | 0 | 0 | 1 | 1 | 0 | 0.00025 | 0.86 | 0.0096 | 0.074 | 0.054 | 0.000166 | 0.256 |
| 13 | RIMBP3 | RIMS binding protein 3 | 244157 | 2 | 2 | 2 | 0 | 0 | 0 | 0 | 0 | 2 | 0 | 0.04 | 1 | 0.016 | 0.00014 | 0.00037 | 0.000179 | 0.256 |
| 14 | PABPC1 | poly(A) binding protein, cytoplasmic 1 | 129710 | 3 | 3 | 3 | 0 | 0 | 0 | 1 | 0 | 0 | 2 | 0.000032 | 0.7 | 0.44 | 0.88 | 0.58 | 0.000219 | 0.289 |
| 15 | CDKN1A | cyclin-dependent kinase inhibitor 1A (p21, Cip1) | 30155 | 2 | 2 | 2 | 0 | 0 | 0 | 0 | 0 | 2 | 0 | 0.00061 | 0.8 | 0.49 | 0.043 | 0.032 | 0.000233 | 0.289 |
| 16 | AGBL4 | ATP/GTP binding protein-like 4 | 102534 | 2 | 2 | 2 | 0 | 1 | 1 | 0 | 0 | 0 | 0 | 0.00039 | 0.6 | NaN | NaN | NaN | 0.000392 | 0.455 |
| 17 | OR5M9 | olfactory receptor, family 5, subfamily M, member 9 | 61710 | 2 | 2 | 2 | 0 | 0 | 1 | 0 | 1 | 0 | 0 | 0.000094 | 0.56 | 0.43 | 0.25 | 0.4 | 0.000426 | 0.466 |
| 18 | C7orf25 | chromosome 7 open reading frame 25 | 85206 | 2 | 2 | 1 | 0 | 0 | 0 | 0 | 0 | 2 | 0 | 0.0041 | 1 | 0.012 | 0.017 | 0.01 | 0.000455 | 0.470 |
| 19 | MEF2A | myocyte enhancer factor 2A | 109974 | 2 | 2 | 2 | 0 | 0 | 1 | 0 | 0 | 1 | 0 | 0.00076 | 0.6 | 0.15 | 0.04 | 0.064 | 0.000528 | 0.494 |
| 20 | RILPL1 | Rab interacting lysosomal protein-like 1 | 71141 | 2 | 2 | 1 | 0 | 0 | 0 | 0 | 2 | 0 | 0 | 0.00023 | 0.72 | 0.012 | 0.82 | 0.21 | 0.000531 | 0.494 |
| 21 | CCDC74A | coiled-coil domain containing 74A | 70786 | 3 | 2 | 3 | 0 | 1 | 0 | 0 | 1 | 1 | 0 | 0.0023 | 0.57 | 0.019 | 0.15 | 0.023 | 0.000587 | 0.520 |
| 22 | PAX4 | paired box 4 | 68086 | 2 | 2 | 2 | 0 | 1 | 0 | 0 | 0 | 1 | 0 | 0.00065 | 0.92 | NaN | NaN | NaN | 0.000652 | 0.551 |
| 23 | CBWD6 | COBW domain containing 6 | 55693 | 2 | 2 | 1 | 0 | 0 | 0 | 0 | 0 | 2 | 0 | 0.0015 | 1 | 0.016 | 0.1 | 0.049 | 0.000768 | 0.621 |
| 24 | KCNK10 | potassium channel, subfamily K, member 10 | 115059 | 3 | 3 | 3 | 0 | 2 | 0 | 1 | 0 | 0 | 0 | 0.00066 | 0.29 | 0.041 | 0.56 | 0.13 | 0.000901 | 0.692 |
| 25 | KYNU | kynureninase (L-kynurenine hydrolase) | 97398 | 2 | 2 | 2 | 0 | 0 | 1 | 1 | 0 | 0 | 0 | 0.00038 | 0.4 | 0.29 | 0.28 | 0.24 | 0.000930 | 0.692 |
| 26 | DTWD1 | DTW domain containing 1 | 61311 | 2 | 2 | 2 | 0 | 0 | 0 | 0 | 0 | 2 | 0 | 0.0012 | 1 | 0.032 | 0.3 | 0.081 | 0.00102 | 0.728 |
| 27 | ZSWIM6 | zinc finger, SWIM-type containing 6 | 206027 | 2 | 3 | 2 | 0 | 0 | 0 | 1 | 0 | 1 | 0 | 0.017 | 0.66 | 0.0036 | 0.21 | 0.0067 | 0.00117 | 0.775 |
| 28 | TBC1D5 | TBC1 domain family, member 5 | 167173 | 2 | 2 | 2 | 0 | 0 | 0 | 1 | 0 | 1 | 0 | 0.0024 | 0.46 | 0.15 | 0.017 | 0.05 | 0.00120 | 0.775 |
| 29 | TAL1 | T-cell acute lymphocytic leukemia 1 | 31628 | 2 | 2 | 2 | 0 | 0 | 0 | 0 | 2 | 0 | 0 | 0.00012 | 0.65 | 0.48 | 0.76 | 1 | 0.00123 | 0.775 |
| 30 | ATP5E | ATP synthase, H+ transporting, mitochondrial F1 complex, epsilon subunit | 10679 | 1 | 1 | 1 | 0 | 0 | 1 | 0 | 0 | 0 | 0 | 0.0012 | 0.65 | NaN | NaN | NaN | 0.00125 | 0.775 |
| 31 | MUC5B | mucin 5B, oligomeric mucus/gel-forming | 1117758 | 8 | 8 | 8 | 0 | 0 | 0 | 1 | 2 | 5 | 0 | 0.00029 | 0.4 | 0.39 | 0.43 | 0.48 | 0.00135 | 0.811 |
| 32 | RAB40A | RAB40A, member RAS oncogene family | 55264 | 2 | 2 | 2 | 0 | 0 | 0 | 0 | 0 | 2 | 0 | 0.0022 | 1 | 0.013 | 0.14 | 0.09 | 0.00187 | 1.000 |
| 33 | KRTAP5-5 | keratin associated protein 5-5 | 45046 | 1 | 1 | 1 | 1 | 1 | 0 | 0 | 0 | 0 | 0 | 0.0021 | 0.92 | NaN | NaN | NaN | 0.00206 | 1.000 |
| 34 | AGRN | agrin | 247748 | 4 | 3 | 3 | 1 | 1 | 0 | 0 | 0 | 3 | 0 | 0.007 | 0.86 | 0.01 | 0.94 | 0.031 | 0.00207 | 1.000 |
| 35 | ORAOV1 | oral cancer overexpressed 1 | 28640 | 1 | 1 | 1 | 0 | 0 | 1 | 0 | 0 | 0 | 0 | 0.0022 | 0.63 | NaN | NaN | NaN | 0.00216 | 1.000 |
Figure S1. This figure depicts the distribution of mutations and mutation types across the GOLGA6L6 significant gene.
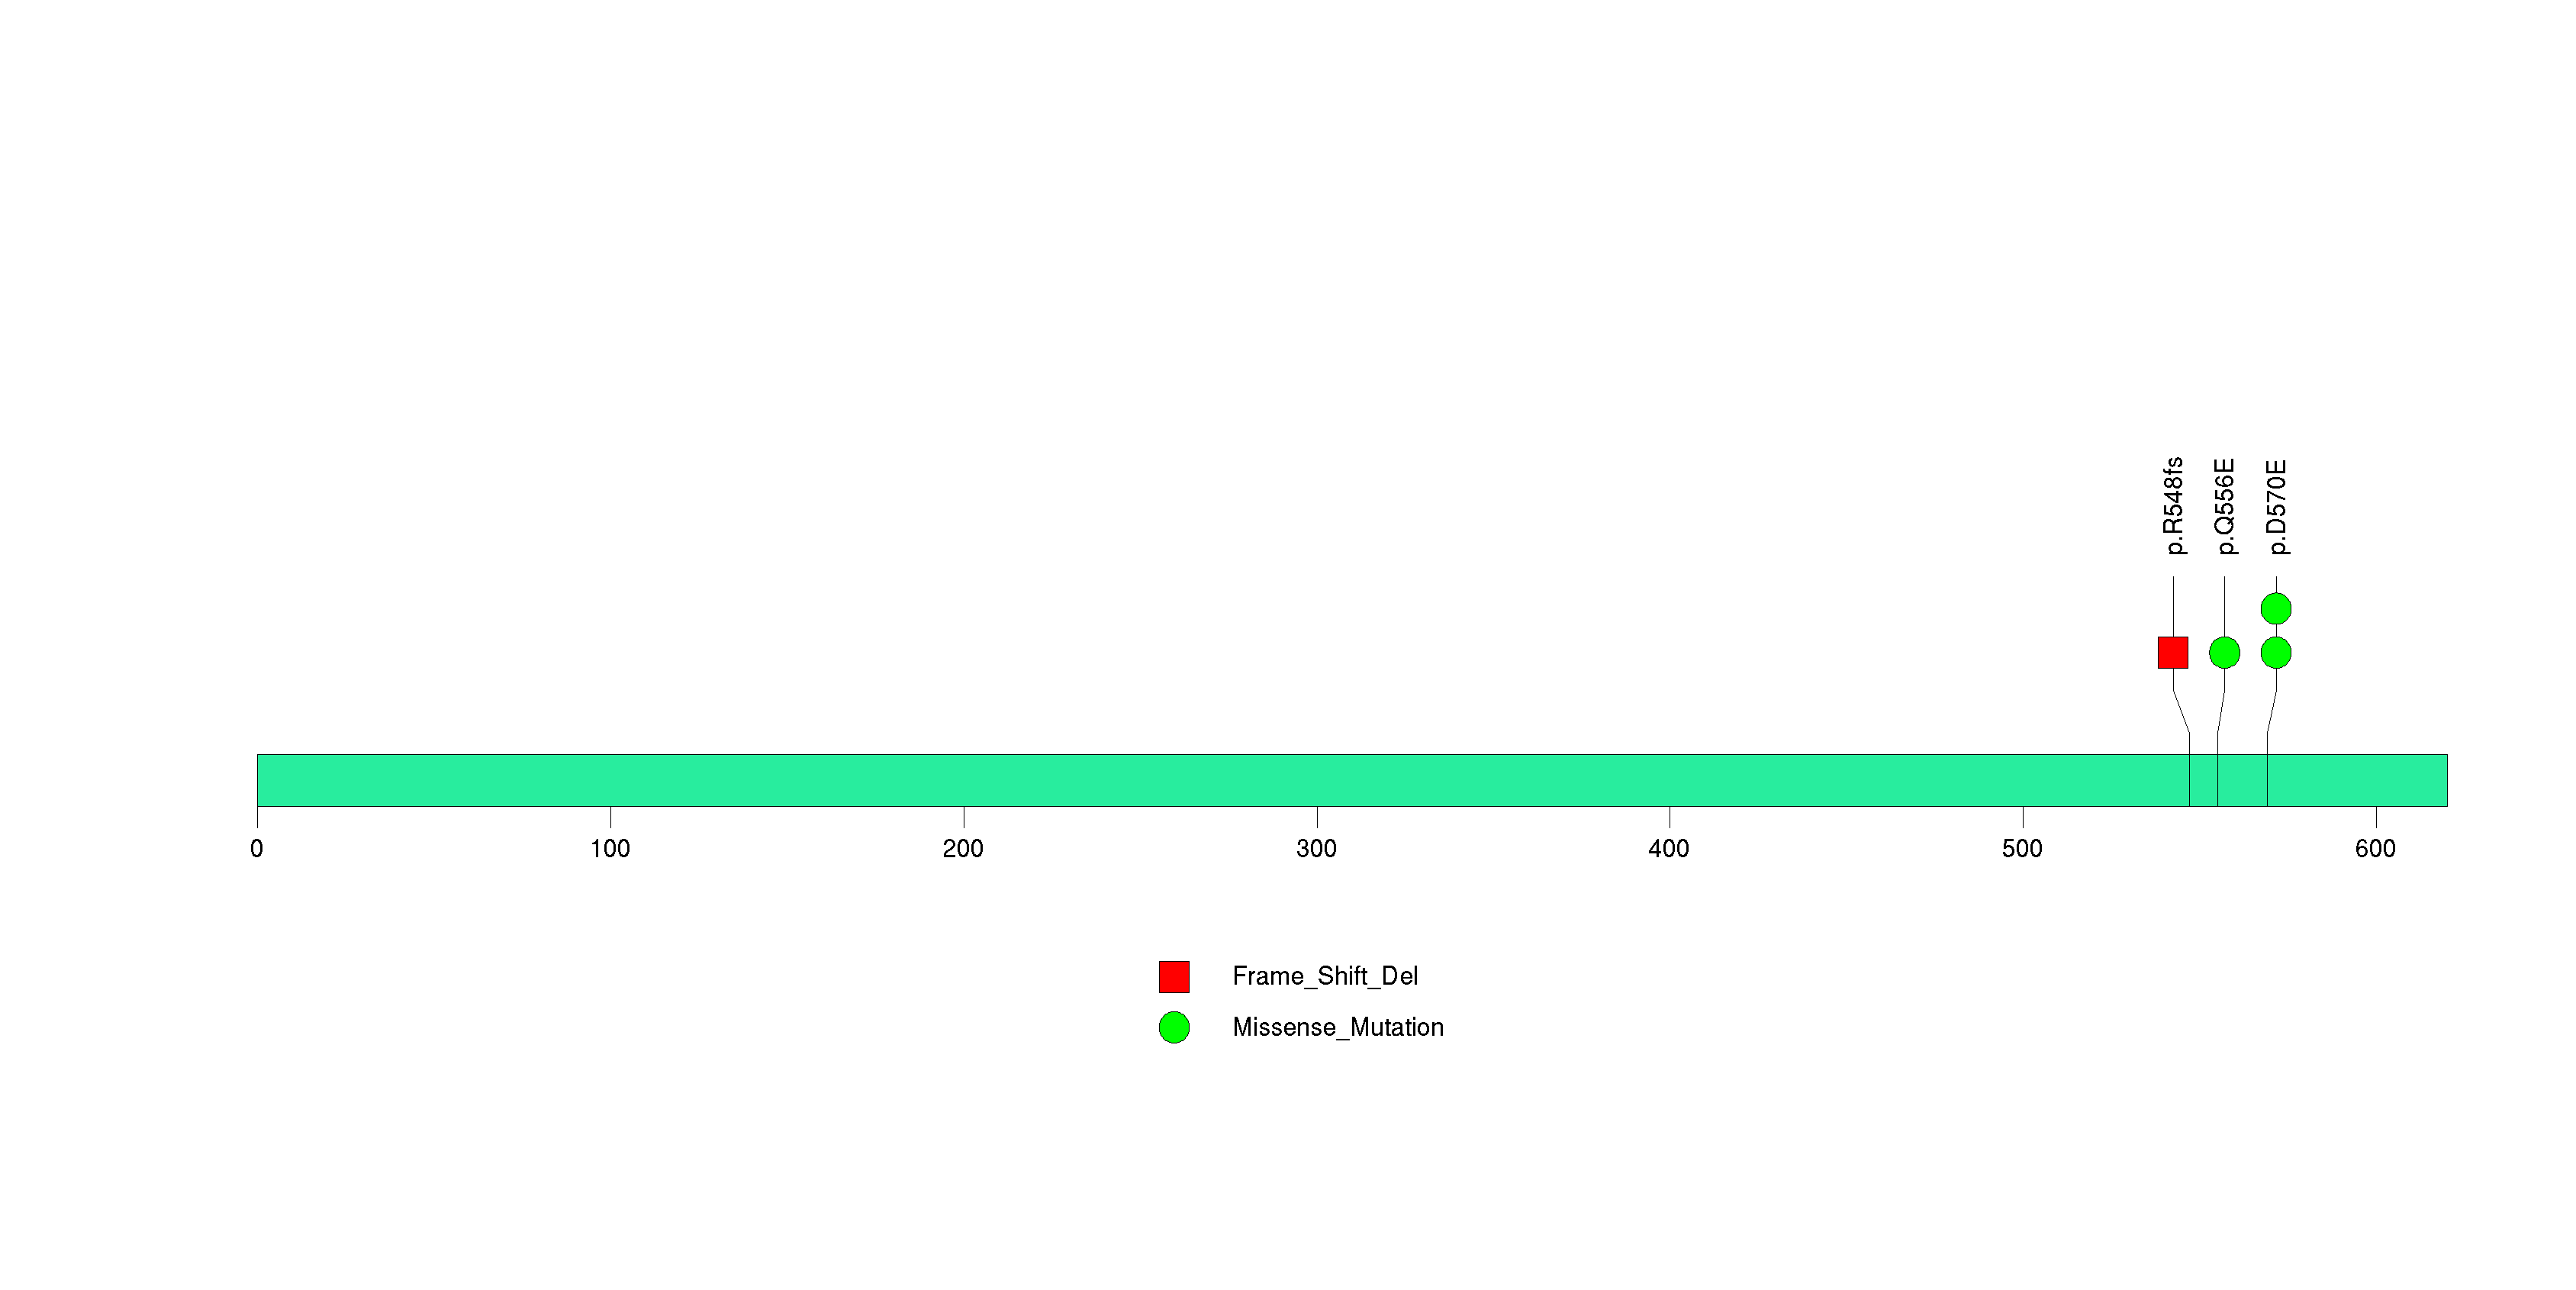
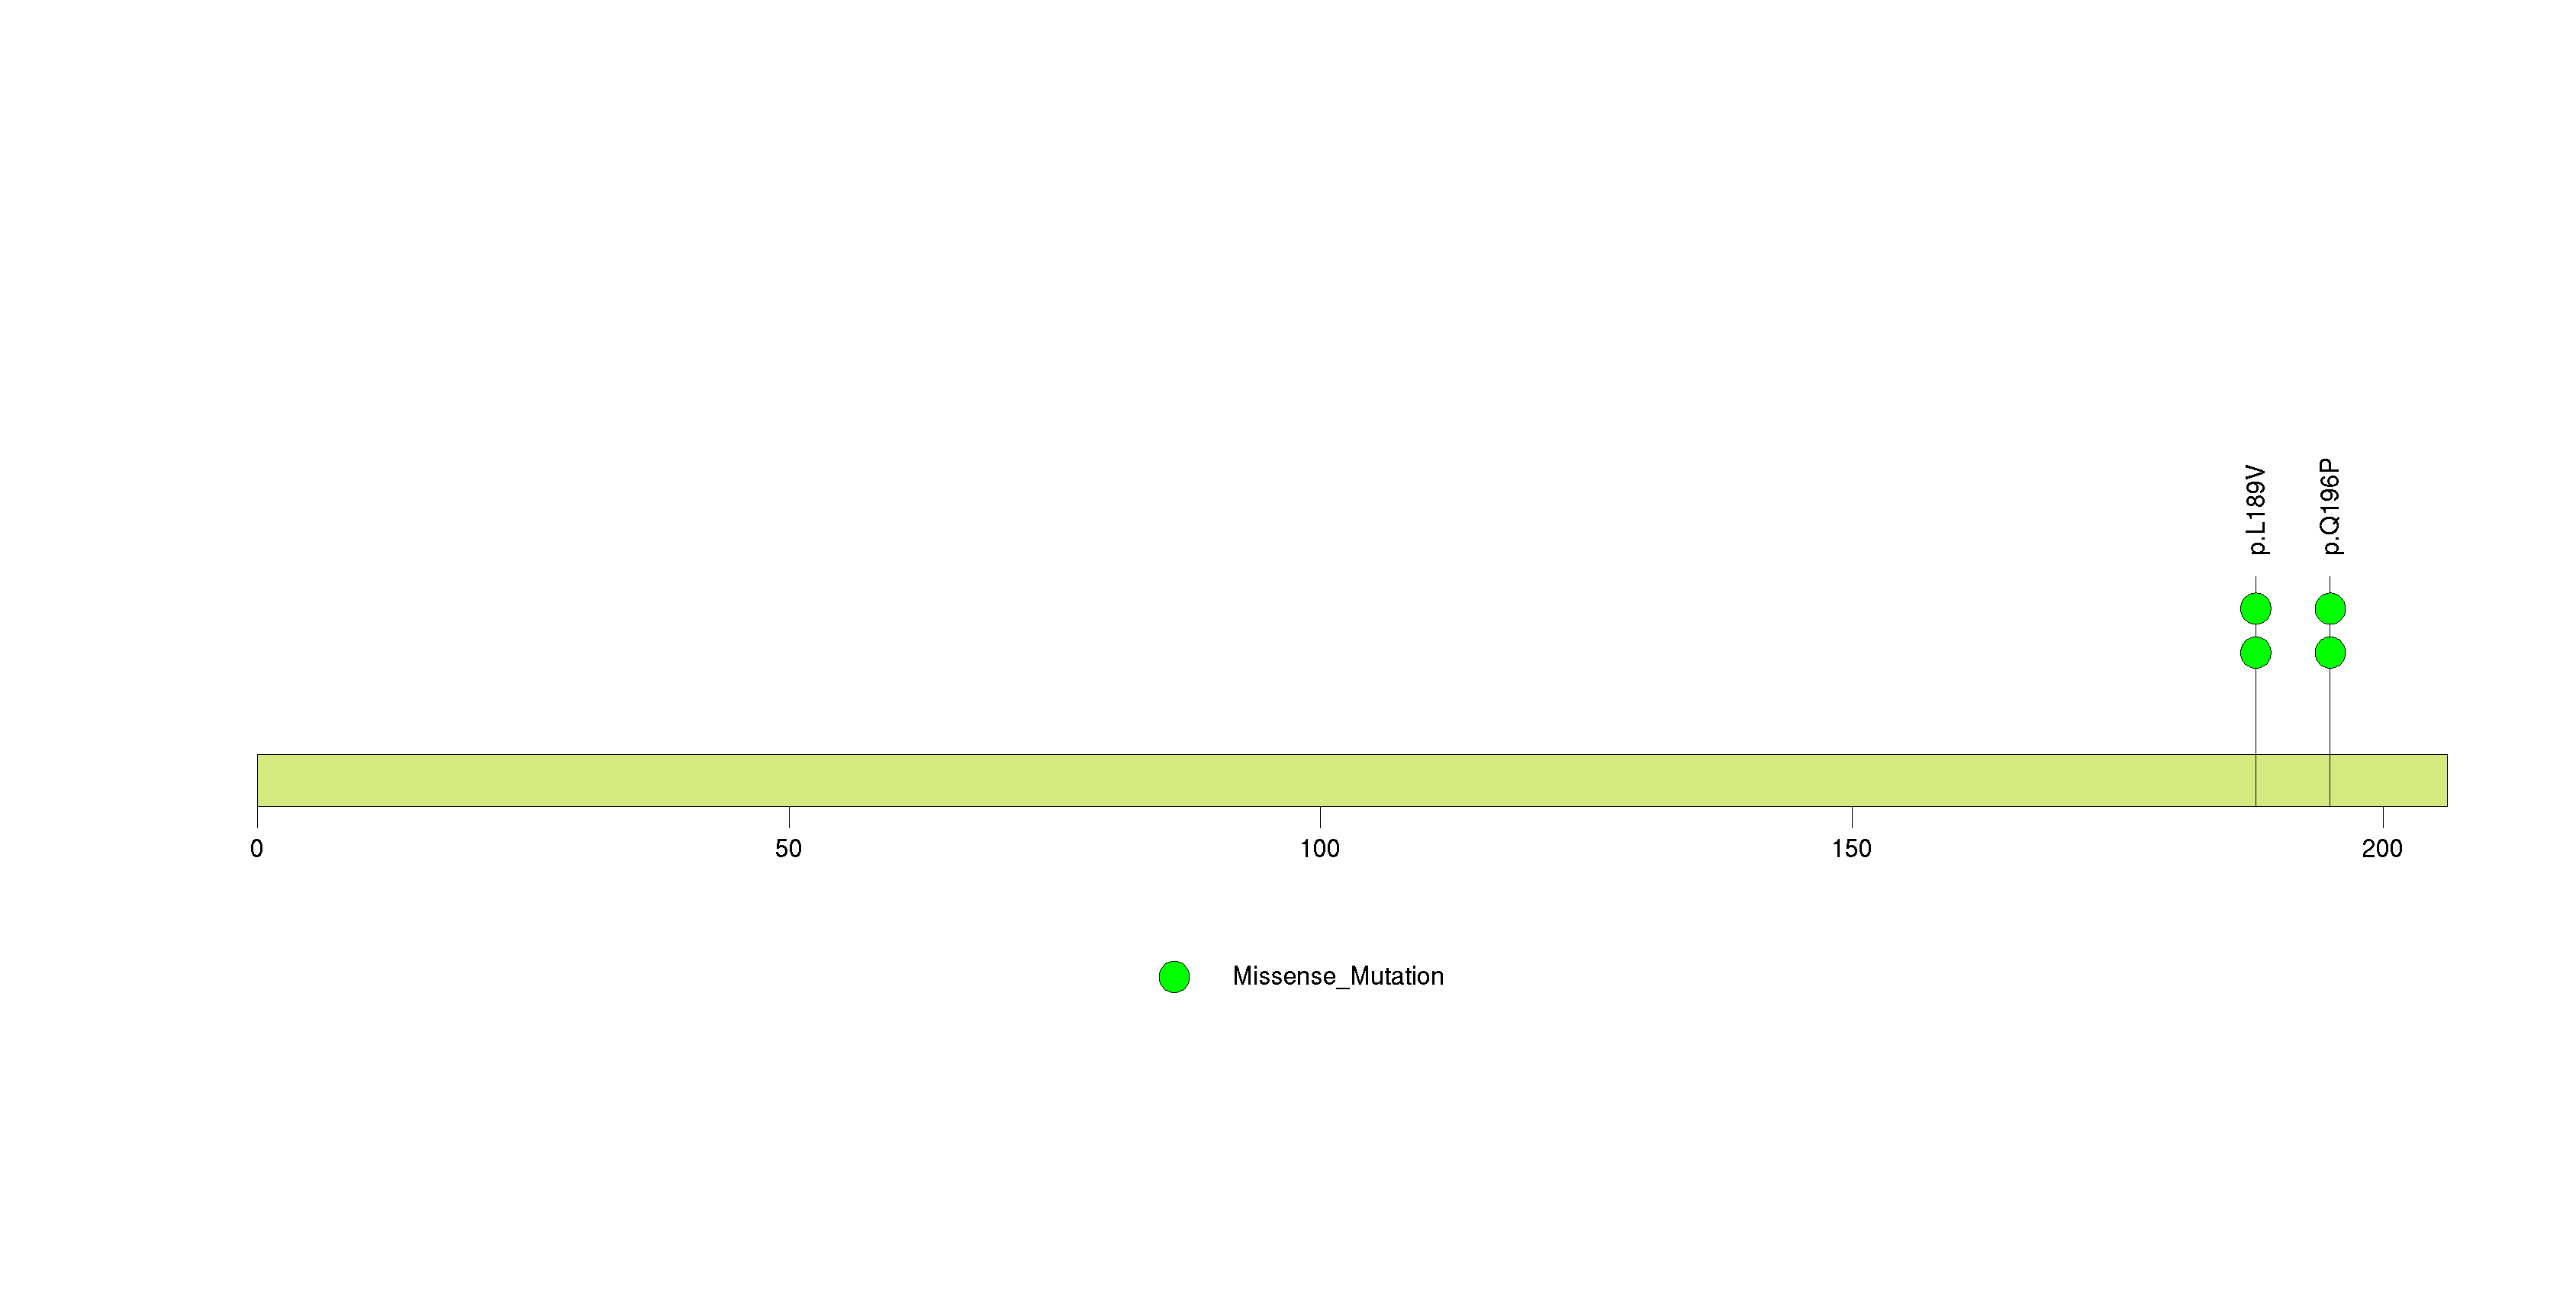
Figure S2. This figure depicts the distribution of mutations and mutation types across the EBPL significant gene.
In this analysis, COSMIC is used as a filter to increase power by restricting the territory of each gene. Cosmic version: v48.
Table 4. Get Full Table Significantly mutated genes (COSMIC territory only). To access the database please go to: COSMIC. Number of significant genes found: 2. Number of genes displayed: 10
| rank | gene | description | n | cos | n_cos | N_cos | cos_ev | p | q |
|---|---|---|---|---|---|---|---|---|---|
| 1 | TP53 | tumor protein p53 | 27 | 356 | 24 | 23496 | 2576 | 0 | 0 |
| 2 | PTEN | phosphatase and tensin homolog (mutated in multiple advanced cancers 1) | 6 | 767 | 6 | 50622 | 35 | 2.3e-10 | 5.1e-07 |
| 3 | KRTAP5-5 | keratin associated protein 5-5 | 1 | 1 | 1 | 66 | 1 | 0.000098 | 0.11 |
| 4 | RCN1 | reticulocalbin 1, EF-hand calcium binding domain | 1 | 1 | 1 | 66 | 1 | 0.000098 | 0.11 |
| 5 | CENPC1 | centromere protein C 1 | 1 | 2 | 1 | 132 | 1 | 0.0002 | 0.18 |
| 6 | ALPK2 | alpha-kinase 2 | 1 | 3 | 1 | 198 | 1 | 0.00029 | 0.18 |
| 7 | SMARCC2 | SWI/SNF related, matrix associated, actin dependent regulator of chromatin, subfamily c, member 2 | 2 | 3 | 1 | 198 | 1 | 0.00029 | 0.18 |
| 8 | RB1 | retinoblastoma 1 (including osteosarcoma) | 2 | 267 | 2 | 17622 | 4 | 0.00033 | 0.18 |
| 9 | DDR2 | discoidin domain receptor tyrosine kinase 2 | 1 | 4 | 1 | 264 | 1 | 0.00039 | 0.18 |
| 10 | RHPN2 | rhophilin, Rho GTPase binding protein 2 | 1 | 4 | 1 | 264 | 1 | 0.00039 | 0.18 |
Note:
n - number of (nonsilent) mutations in this gene across the individual set.
cos = number of unique mutated sites in this gene in COSMIC
n_cos = overlap between n and cos.
N_cos = number of individuals times cos.
cos_ev = total evidence: number of reports in COSMIC for mutations seen in this gene.
p = p-value for seeing the observed amount of overlap in this gene)
q = q-value, False Discovery Rate (Benjamini-Hochberg procedure)
Table 5. Get Full Table Genes with Clustered Mutations
| num | gene | desc | n | mindist | nmuts0 | nmuts3 | nmuts12 | npairs0 | npairs3 | npairs12 |
|---|---|---|---|---|---|---|---|---|---|---|
| 2309 | TP53 | tumor protein p53 | 27 | 0 | 3 | 9 | 43 | 3 | 9 | 43 |
| 664 | EBPL | emopamil binding protein-like | 4 | 0 | 2 | 2 | 6 | 2 | 2 | 6 |
| 1386 | MUC4 | mucin 4, cell surface associated | 13 | 0 | 1 | 1 | 2 | 1 | 1 | 2 |
| 26 | ACR | acrosin | 2 | 0 | 1 | 1 | 1 | 1 | 1 | 1 |
| 180 | ATP6V0A4 | ATPase, H+ transporting, lysosomal V0 subunit a4 | 2 | 0 | 1 | 1 | 1 | 1 | 1 | 1 |
| 239 | C10orf120 | chromosome 10 open reading frame 120 | 2 | 0 | 1 | 1 | 1 | 1 | 1 | 1 |
| 916 | GOLGA6L6 | golgin A6 family-like 6 | 4 | 0 | 1 | 1 | 1 | 1 | 1 | 1 |
| 1093 | ITGA5 | integrin, alpha 5 (fibronectin receptor, alpha polypeptide) | 2 | 0 | 1 | 1 | 1 | 1 | 1 | 1 |
| 1901 | RILPL1 | Rab interacting lysosomal protein-like 1 | 2 | 0 | 1 | 1 | 1 | 1 | 1 | 1 |
| 2332 | TRRAP | transformation/transcription domain-associated protein | 4 | 0 | 1 | 1 | 1 | 1 | 1 | 1 |
Note:
n - number of mutations in this gene in the individual set.
mindist - distance (in aa) between closest pair of mutations in this gene
npairs3 - how many pairs of mutations are within 3 aa of each other.
npairs12 - how many pairs of mutations are within 12 aa of each other.
Table 6. Get Full Table A Ranked List of Significantly Mutated Genesets. (Source: MSigDB GSEA Cannonical Pathway Set).Number of significant genesets found: 38. Number of genesets displayed: 10
| rank | geneset | description | genes | N_genes | mut_tally | N | n | npat | nsite | nsil | n1 | n2 | n3 | n4 | n5 | n6 | p_ns_s | p | q |
|---|---|---|---|---|---|---|---|---|---|---|---|---|---|---|---|---|---|---|---|
| 1 | RBPATHWAY | The ATM protein kinase recognizes DNA damage and blocks cell cycle progression by phosphorylating chk1 and p53, which normally inhibits Rb to allow G1/S transitions. | ATM, CDC2, CDC25A, CDC25B, CDC25C, CDK2, CDK4, CHEK1, MYT1, RB1, TP53, WEE1, YWHAH | 12 | ATM(3), CDC25C(1), MYT1(1), RB1(2), TP53(27), WEE1(1) | 1768882 | 35 | 25 | 33 | 1 | 5 | 1 | 8 | 9 | 11 | 1 | 0.00078 | 2e-15 | 4e-13 |
| 2 | TERTPATHWAY | hTERC, the RNA subunit of telomerase, and hTERT, the catalytic protein subunit, are required for telomerase activity and are overexpressed in many cancers. | HDAC1, MAX, MYC, SP1, SP3, TP53, WT1, ZNF42 | 7 | MYC(1), TP53(27) | 698258 | 28 | 23 | 26 | 1 | 3 | 0 | 7 | 7 | 10 | 1 | 0.0015 | 2e-15 | 4e-13 |
| 3 | ATMPATHWAY | The tumor-suppressing protein kinase ATM responds to radiation-induced DNA damage by blocking cell-cycle progression and activating DNA repair. | ABL1, ATM, BRCA1, CDKN1A, CHEK1, CHEK2, GADD45A, JUN, MAPK8, MDM2, MRE11A, NBS1, NFKB1, NFKBIA, RAD50, RAD51, RBBP8, RELA, TP53, TP73 | 19 | ABL1(1), ATM(3), CDKN1A(2), CHEK2(1), TP53(27), TP73(1) | 2946230 | 35 | 25 | 33 | 2 | 7 | 0 | 8 | 8 | 11 | 1 | 0.0027 | 2.1e-15 | 4e-13 |
| 4 | PMLPATHWAY | Ring-shaped PML nuclear bodies regulate transcription and are required co-activators in p53- and DAXX-mediated apoptosis. | CREBBP, DAXX, HRAS, PAX3, PML, PRAM-1, RARA, RB1, SIRT1, SP100, TNF, TNFRSF1A, TNFRSF1B, TNFRSF6, TNFSF6, TP53, UBL1 | 13 | PAX3(1), PML(1), RB1(2), SIRT1(2), TP53(27) | 1880922 | 33 | 25 | 31 | 4 | 4 | 0 | 7 | 7 | 14 | 1 | 0.034 | 4.1e-15 | 4e-13 |
| 5 | P53PATHWAY | p53 induces cell cycle arrest or apoptosis under conditions of DNA damage. | APAF1, ATM, BAX, BCL2, CCND1, CCNE1, CDK2, CDK4, CDKN1A, E2F1, GADD45A, MDM2, PCNA, RB1, TIMP3, TP53 | 16 | ATM(3), CDKN1A(2), PCNA(1), RB1(2), TP53(27) | 1802829 | 35 | 24 | 33 | 1 | 5 | 0 | 7 | 9 | 13 | 1 | 0.0011 | 4.9e-15 | 4e-13 |
| 6 | SA_G1_AND_S_PHASES | Cdk2, 4, and 6 bind cyclin D in G1, while cdk2/cyclin E promotes the G1/S transition. | ARF1, ARF3, CCND1, CDK2, CDK4, CDKN1A, CDKN1B, CDKN2A, CFL1, E2F1, E2F2, MDM2, NXT1, PRB1, TP53 | 15 | ARF3(1), CDKN1A(2), CDKN1B(1), TP53(27) | 807622 | 31 | 24 | 29 | 2 | 3 | 0 | 7 | 7 | 13 | 1 | 0.0044 | 4.9e-15 | 4e-13 |
| 7 | CHEMICALPATHWAY | DNA damage promotes Bid cleavage, which stimulates mitochondrial cytochrome c release and consequent caspase activation, resulting in apoptosis. | ADPRT, AKT1, APAF1, ATM, BAD, BAX, BCL2, BCL2L1, BID, CASP3, CASP6, CASP7, CASP9, CYCS, EIF2S1, PRKCA, PRKCB1, PTK2, PXN, STAT1, TLN1, TP53 | 20 | ATM(3), PTK2(1), PXN(1), TP53(27) | 2734647 | 32 | 24 | 30 | 1 | 6 | 0 | 7 | 9 | 9 | 1 | 0.00077 | 5.1e-15 | 4e-13 |
| 8 | RNAPATHWAY | dsRNA-activated protein kinase phosphorylates elF2a, which generally inhibits translation, and activates NF-kB to provoke inflammation. | CHUK, DNAJC3, EIF2S1, EIF2S2, MAP3K14, NFKB1, NFKBIA, PRKR, RELA, TP53 | 9 | CHUK(1), TP53(27) | 1018235 | 28 | 22 | 26 | 1 | 3 | 0 | 7 | 7 | 10 | 1 | 0.002 | 5.4e-15 | 4e-13 |
| 9 | TELPATHWAY | Telomerase is a ribonucleotide protein that adds telomeric repeats to the 3' ends of chromosomes. | AKT1, BCL2, EGFR, G22P1, HSPCA, IGF1R, KRAS2, MYC, POLR2A, PPP2CA, PRKCA, RB1, TEP1, TERF1, TERT, TNKS, TP53, XRCC5 | 15 | IGF1R(1), MYC(1), POLR2A(2), RB1(2), TEP1(1), TERT(2), TP53(27) | 2756116 | 36 | 24 | 34 | 1 | 5 | 1 | 7 | 8 | 14 | 1 | 0.00034 | 5.8e-15 | 4e-13 |
| 10 | ARFPATHWAY | Cyclin-dependent kinase inhibitor 2A is a tumor suppressor that induces G1 arrest and can activate the p53 pathway, leading to G2/M arrest. | ABL1, CDKN2A, E2F1, MDM2, MYC, PIK3CA, PIK3R1, POLR1A, POLR1B, POLR1C, POLR1D, RAC1, RB1, TBX2, TP53, TWIST1 | 16 | ABL1(1), MYC(1), PIK3R1(1), POLR1A(1), POLR1C(1), POLR1D(1), RB1(2), TP53(27) | 1966199 | 35 | 24 | 33 | 1 | 4 | 0 | 9 | 8 | 13 | 1 | 0.00062 | 7.2e-15 | 4e-13 |
Table 7. Get Full Table A Ranked List of Significantly Mutated Genesets (Excluding Significantly Mutated Genes). Number of significant genesets found: 1. Number of genesets displayed: 10
| rank | geneset | description | genes | N_genes | mut_tally | N | n | npat | nsite | nsil | n1 | n2 | n3 | n4 | n5 | n6 | p_ns_s | p | q |
|---|---|---|---|---|---|---|---|---|---|---|---|---|---|---|---|---|---|---|---|
| 1 | OXIDATIVE_PHOSPHORYLATION | ATP12A, ATP4B, ATP5E, ATP5O, ATP6AP1, ATP6V0A1, ATP6V0A4, ATP6V0B, ATP6V0C, ATP6V0C, SHMT1, ATP6V0D1, ATP6V0E, ATP6V1A, ATP6V1B1, ATP6V1B2, ATP6V1C1, ATP6V1C2, ATP6V1D, ATP6V1E1, ATP6V1F, ATP6V1G1, ATP6V1G2, ATP6V1G3, ATP6V1H, ATP7A, ATP7B, COX10, COX4I1, COX5A, COX5B, COX6A1, COX6A2, COX6B1, COX6C, COX7A1, COX7A2, COX7B, COX7C, COX8A, NDUFA1, NDUFA10, NDUFA11, NDUFA4, NDUFA5, NDUFA8, NDUFB2, NDUFB4, NDUFB5, NDUFB6, NDUFB7, NDUFS1, NDUFS2, NDUFV1, NDUFV2, PP, PPA2, SDHA, SDHA, SDHAL2, SDHB, UQCRB, UQCRC1, UQCRFS1, UQCRH | 60 | ATP12A(1), ATP5E(1), ATP6AP1(1), ATP6V0A4(2), ATP6V1A(1), ATP6V1B1(1), ATP6V1B2(1), ATP7A(1), COX7A1(1), NDUFB5(1), NDUFS1(2), SDHA(1), UQCRFS1(1) | 3815499 | 15 | 14 | 15 | 0 | 2 | 1 | 5 | 5 | 2 | 0 | 0.011 | 0.00012 | 0.073 | |
| 2 | CELL2CELLPATHWAY | Epithelial cell adhesion proteins such as cadherins transduce signals into the cell via catenins, which alter cell shape and motility. | ACTN1, ACTN2, ACTN3, BCAR1, CSK, CTNNA1, CTNNA2, CTNNB1, PECAM1, PTK2, PXN, SRC, VCL | 13 | BCAR1(2), CSK(1), CTNNA2(2), CTNNB1(1), PTK2(1), PXN(1), SRC(1) | 1938296 | 9 | 8 | 9 | 0 | 3 | 1 | 1 | 2 | 1 | 1 | 0.087 | 0.0014 | 0.39 |
| 3 | GLYCOSAMINOGLYCAN_DEGRADATION | ARSB, GALNS, GLB1, GNS, GUSB, HEXA, HEXB, IDS, IDUA, LCT, NAGLU | 11 | GALNS(2), GNS(2), HEXA(1), LCT(2) | 1447206 | 7 | 7 | 7 | 1 | 1 | 1 | 3 | 0 | 2 | 0 | 0.36 | 0.0022 | 0.39 | |
| 4 | SRCRPTPPATHWAY | Activation of Src by Protein-tyrosine phosphatase alpha | CCNB1, CDC2, CDC25A, CDC25B, CDC25C, CSK, GRB2, PRKCA, PRKCB1, PTPRA, SRC | 9 | CDC25C(1), CSK(1), PTPRA(1), SRC(1) | 924906 | 4 | 4 | 4 | 0 | 0 | 3 | 1 | 0 | 0 | 0 | 0.24 | 0.0033 | 0.39 |
| 5 | PTENPATHWAY | PTEN suppresses AKT-induced cell proliferation and antagonizes the action of PI3K. | AKT1, BCAR1, CDKN1B, FOXO3A, GRB2, ILK, ITGB1, MAPK1, MAPK3, PDK2, PDPK1, PIK3CA, PIK3R1, PTEN, PTK2, SHC1, SOS1, TNFSF6 | 15 | BCAR1(2), CDKN1B(1), ITGB1(1), MAPK3(1), PDK2(1), PIK3R1(1), PTK2(1), SHC1(1) | 1879520 | 9 | 8 | 9 | 0 | 3 | 0 | 2 | 1 | 2 | 1 | 0.091 | 0.0037 | 0.39 |
| 6 | IL3PATHWAY | IL-3 promotes proliferation and differentiation of hematopoietic cells via a heterodimeric receptor that activates the Stat5 and MAP kinase pathways. | CSF2RB, FOS, GRB2, HRAS, IL3, IL3RA, JAK2, MAP2K1, MAPK3, PTPN6, RAF1, SHC1, SOS1, STAT5A, STAT5B | 15 | CSF2RB(3), MAPK3(1), RAF1(1), SHC1(1), STAT5B(1) | 1807897 | 7 | 7 | 7 | 0 | 2 | 0 | 3 | 2 | 0 | 0 | 0.092 | 0.0042 | 0.39 |
| 7 | RBPATHWAY | The ATM protein kinase recognizes DNA damage and blocks cell cycle progression by phosphorylating chk1 and p53, which normally inhibits Rb to allow G1/S transitions. | ATM, CDC2, CDC25A, CDC25B, CDC25C, CDK2, CDK4, CHEK1, MYT1, RB1, TP53, WEE1, YWHAH | 11 | ATM(3), CDC25C(1), MYT1(1), RB1(2), WEE1(1) | 1683244 | 8 | 7 | 8 | 0 | 2 | 1 | 1 | 2 | 2 | 0 | 0.17 | 0.0044 | 0.39 |
| 8 | CDC25PATHWAY | The protein phosphatase Cdc25 is phosphorylated by Chk1 and activates Cdc2 to stimulate eukaryotic cells into M phase. | ATM, CDC2, CDC25A, CDC25B, CDC25C, CHEK1, MYT1, WEE1, YWHAH | 8 | ATM(3), CDC25C(1), MYT1(1), WEE1(1) | 1381283 | 6 | 6 | 6 | 0 | 2 | 1 | 1 | 2 | 0 | 0 | 0.16 | 0.0066 | 0.44 |
| 9 | ATP_SYNTHESIS | ATP5E, ATP5O, ATP6AP1, ATP6V0A1, ATP6V0A4, ATP6V0B, ATP6V0C, ATP6V0C, SHMT1, ATP6V0D1, ATP6V0E, ATP6V1A, ATP6V1B1, ATP6V1B2, ATP6V1C1, ATP6V1C2, ATP6V1D, ATP6V1E1, ATP6V1F, ATP6V1G1, ATP6V1G2, ATP6V1G3, ATP6V1H | 21 | ATP5E(1), ATP6AP1(1), ATP6V0A4(2), ATP6V1A(1), ATP6V1B1(1), ATP6V1B2(1) | 1502206 | 7 | 6 | 7 | 0 | 2 | 1 | 1 | 2 | 1 | 0 | 0.15 | 0.0082 | 0.44 | |
| 10 | FLAGELLAR_ASSEMBLY | ATP5E, ATP5O, ATP6AP1, ATP6V0A1, ATP6V0A4, ATP6V0B, ATP6V0C, ATP6V0C, SHMT1, ATP6V0D1, ATP6V0E, ATP6V1A, ATP6V1B1, ATP6V1B2, ATP6V1C1, ATP6V1C2, ATP6V1D, ATP6V1E1, ATP6V1F, ATP6V1G1, ATP6V1G2, ATP6V1G3, ATP6V1H | 21 | ATP5E(1), ATP6AP1(1), ATP6V0A4(2), ATP6V1A(1), ATP6V1B1(1), ATP6V1B2(1) | 1502206 | 7 | 6 | 7 | 0 | 2 | 1 | 1 | 2 | 1 | 0 | 0.15 | 0.0082 | 0.44 |
In brief, we tabulate the number of mutations and the number of covered bases for each gene. The counts are broken down by mutation context category: four context categories that are discovered by MutSig, and one for indel and 'null' mutations, which include indels, nonsense mutations, splice-site mutations, and non-stop (read-through) mutations. For each gene, we calculate the probability of seeing the observed constellation of mutations, i.e. the product P1 x P2 x ... x Pm, or a more extreme one, given the background mutation rates calculated across the dataset. [1]
In addition to the links below, the full results of the analysis summarized in this report can also be downloaded programmatically using firehose_get, or interactively from either the Broad GDAC website or TCGA Data Coordination Center Portal.