This pipeline computes the correlation between significantly recurrent gene mutations and selected clinical features.
Testing the association between mutation status of 18 genes and 6 clinical features across 210 patients, 9 significant findings detected with Q value < 0.25.
-
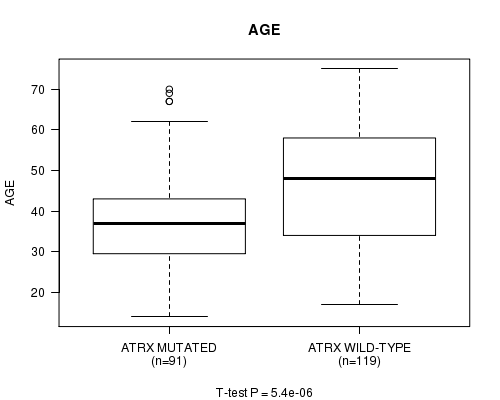
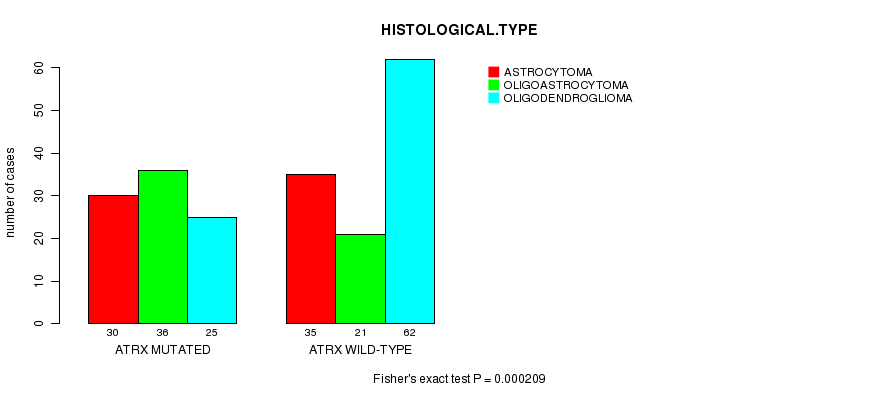
ATRX mutation correlated to 'AGE' and 'HISTOLOGICAL.TYPE'.
-
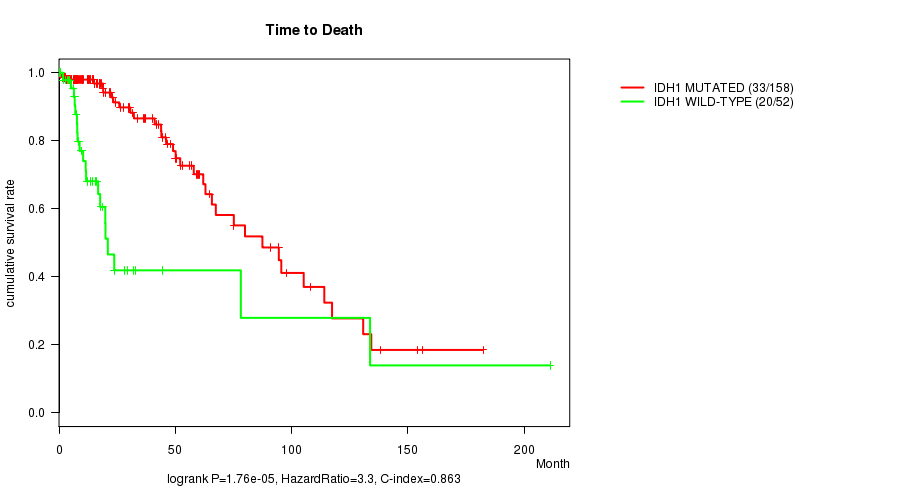
IDH1 mutation correlated to 'Time to Death'.
-
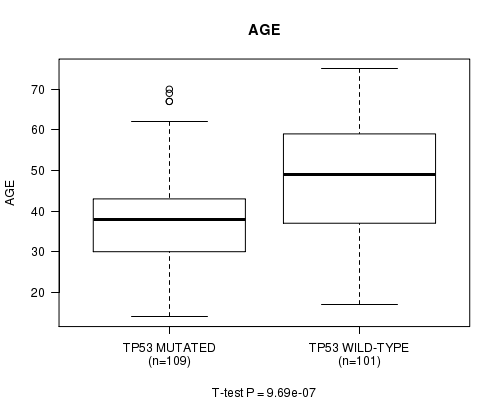
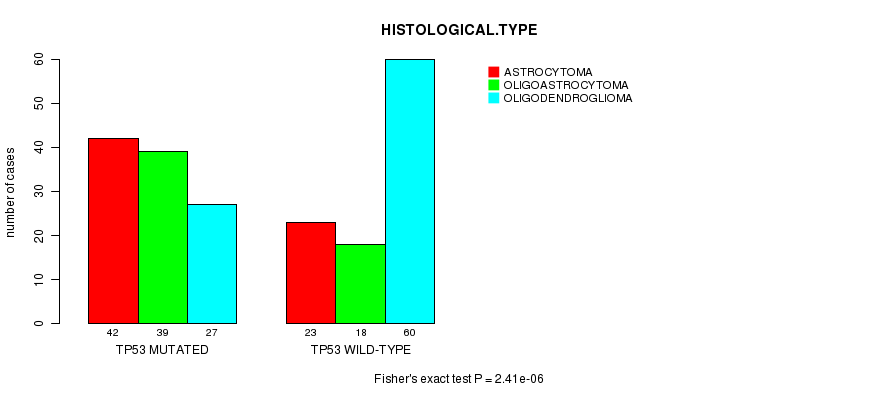
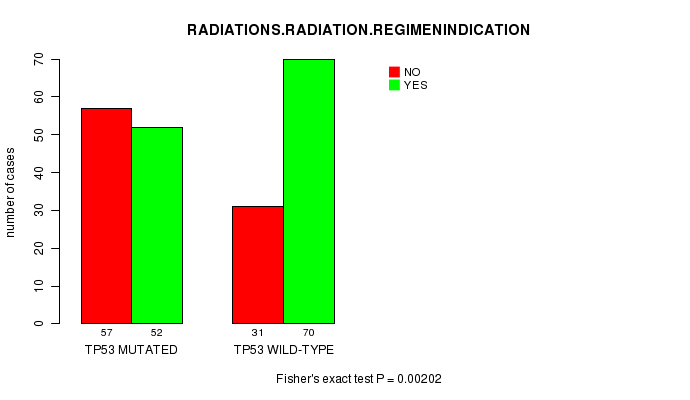
TP53 mutation correlated to 'AGE', 'HISTOLOGICAL.TYPE', and 'RADIATIONS.RADIATION.REGIMENINDICATION'.
-
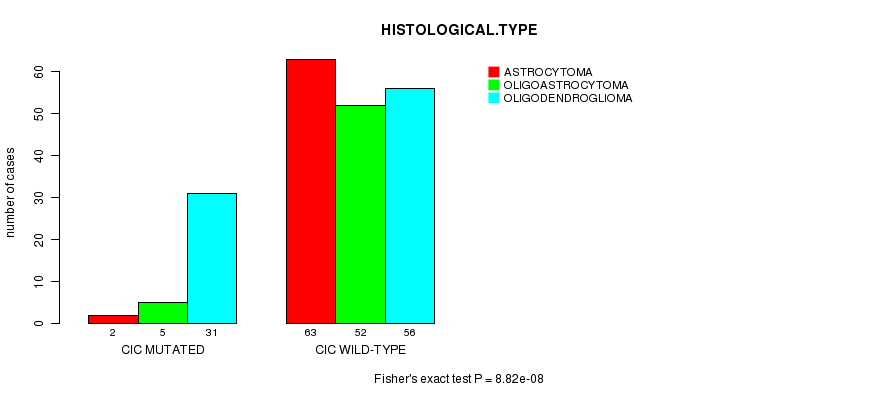
CIC mutation correlated to 'HISTOLOGICAL.TYPE'.
-
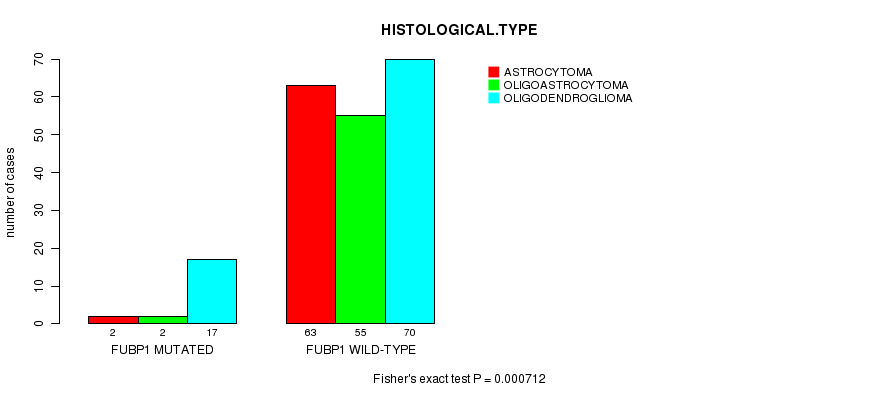
FUBP1 mutation correlated to 'HISTOLOGICAL.TYPE'.
-
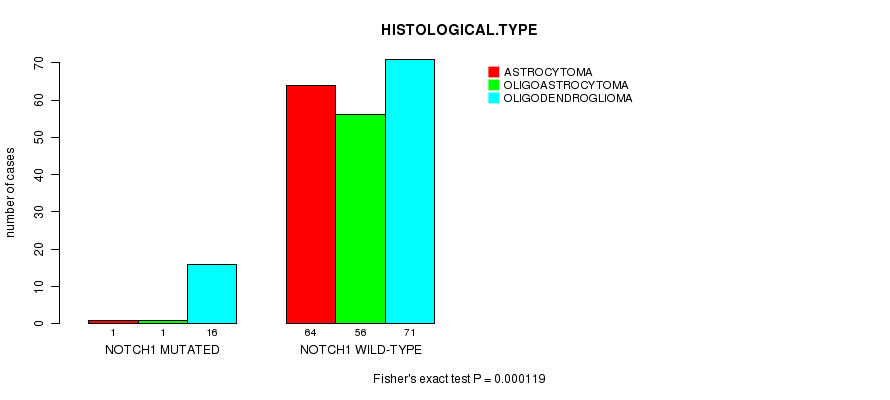
NOTCH1 mutation correlated to 'HISTOLOGICAL.TYPE'.
Table 1. Get Full Table Overview of the association between mutation status of 18 genes and 6 clinical features. Shown in the table are P values (Q values). Thresholded by Q value < 0.25, 9 significant findings detected.
|
Clinical Features |
Time to Death |
AGE | GENDER |
KARNOFSKY PERFORMANCE SCORE |
HISTOLOGICAL TYPE |
RADIATIONS RADIATION REGIMENINDICATION |
||
| nMutated (%) | nWild-Type | logrank test | t-test | Fisher's exact test | t-test | Fisher's exact test | Fisher's exact test | |
| TP53 | 109 (52%) | 101 |
0.149 (1.00) |
9.69e-07 (9.79e-05) |
0.211 (1.00) |
0.461 (1.00) |
2.41e-06 (0.000241) |
0.00202 (0.19) |
| ATRX | 91 (43%) | 119 |
0.108 (1.00) |
5.4e-06 (0.000535) |
0.483 (1.00) |
0.423 (1.00) |
0.000209 (0.02) |
0.0341 (1.00) |
| IDH1 | 158 (75%) | 52 |
1.76e-05 (0.00173) |
0.0117 (1.00) |
0.00992 (0.893) |
0.539 (1.00) |
0.00454 (0.422) |
0.419 (1.00) |
| CIC | 38 (18%) | 172 |
0.0549 (1.00) |
0.703 (1.00) |
0.718 (1.00) |
0.573 (1.00) |
8.82e-08 (9e-06) |
0.364 (1.00) |
| FUBP1 | 21 (10%) | 189 |
0.697 (1.00) |
0.0107 (0.956) |
1 (1.00) |
0.72 (1.00) |
0.000712 (0.0676) |
1 (1.00) |
| NOTCH1 | 18 (9%) | 192 |
0.834 (1.00) |
0.0152 (1.00) |
0.328 (1.00) |
0.125 (1.00) |
0.000119 (0.0116) |
0.809 (1.00) |
| IL32 | 8 (4%) | 202 |
0.539 (1.00) |
0.555 (1.00) |
0.732 (1.00) |
0.191 (1.00) |
1 (1.00) |
0.022 (1.00) |
| IDH2 | 8 (4%) | 202 |
0.48 (1.00) |
0.124 (1.00) |
0.732 (1.00) |
0.265 (1.00) |
1 (1.00) |
|
| PIK3CA | 19 (9%) | 191 |
0.872 (1.00) |
0.458 (1.00) |
0.631 (1.00) |
0.346 (1.00) |
0.104 (1.00) |
0.808 (1.00) |
| PIK3R1 | 13 (6%) | 197 |
0.2 (1.00) |
0.125 (1.00) |
0.397 (1.00) |
0.662 (1.00) |
0.254 (1.00) |
0.778 (1.00) |
| PTEN | 12 (6%) | 198 |
0.158 (1.00) |
0.0123 (1.00) |
0.373 (1.00) |
0.268 (1.00) |
0.00517 (0.471) |
1 (1.00) |
| CREBZF | 4 (2%) | 206 |
0.686 (1.00) |
0.217 (1.00) |
0.321 (1.00) |
0.288 (1.00) |
0.469 (1.00) |
0.641 (1.00) |
| PCDHAC2 | 14 (7%) | 196 |
0.148 (1.00) |
0.302 (1.00) |
0.162 (1.00) |
0.273 (1.00) |
0.0382 (1.00) |
0.00501 (0.461) |
| NOX4 | 5 (2%) | 205 |
0.457 (1.00) |
0.491 (1.00) |
1 (1.00) |
0.736 (1.00) |
0.652 (1.00) |
|
| ZNF57 | 6 (3%) | 204 |
0.239 (1.00) |
0.767 (1.00) |
0.408 (1.00) |
0.212 (1.00) |
1 (1.00) |
|
| EIF1AX | 3 (1%) | 207 |
0.385 (1.00) |
0.774 (1.00) |
0.258 (1.00) |
0.118 (1.00) |
0.573 (1.00) |
|
| DCP1B | 4 (2%) | 206 |
0.666 (1.00) |
0.0509 (1.00) |
0.633 (1.00) |
0.687 (1.00) |
1 (1.00) |
|
| NAB2 | 4 (2%) | 206 |
0.441 (1.00) |
0.532 (1.00) |
0.321 (1.00) |
0.0673 (1.00) |
0.641 (1.00) |
P value = 5.4e-06 (t-test), Q value = 0.00053
Table S1. Gene #2: 'ATRX MUTATION STATUS' versus Clinical Feature #2: 'AGE'
| nPatients | Mean (Std.Dev) | |
|---|---|---|
| ALL | 210 | 43.0 (13.3) |
| ATRX MUTATED | 91 | 38.3 (12.0) |
| ATRX WILD-TYPE | 119 | 46.5 (13.3) |
Figure S1. Get High-res Image Gene #2: 'ATRX MUTATION STATUS' versus Clinical Feature #2: 'AGE'
P value = 0.000209 (Fisher's exact test), Q value = 0.02
Table S2. Gene #2: 'ATRX MUTATION STATUS' versus Clinical Feature #5: 'HISTOLOGICAL.TYPE'
| nPatients | ASTROCYTOMA | OLIGOASTROCYTOMA | OLIGODENDROGLIOMA |
|---|---|---|---|
| ALL | 65 | 57 | 87 |
| ATRX MUTATED | 30 | 36 | 25 |
| ATRX WILD-TYPE | 35 | 21 | 62 |
Figure S2. Get High-res Image Gene #2: 'ATRX MUTATION STATUS' versus Clinical Feature #5: 'HISTOLOGICAL.TYPE'
P value = 1.76e-05 (logrank test), Q value = 0.0017
Table S3. Gene #4: 'IDH1 MUTATION STATUS' versus Clinical Feature #1: 'Time to Death'
| nPatients | nDeath | Duration Range (Median), Month | |
|---|---|---|---|
| ALL | 210 | 53 | 0.0 - 211.2 (15.0) |
| IDH1 MUTATED | 158 | 33 | 0.0 - 182.3 (17.4) |
| IDH1 WILD-TYPE | 52 | 20 | 0.1 - 211.2 (10.0) |
Figure S3. Get High-res Image Gene #4: 'IDH1 MUTATION STATUS' versus Clinical Feature #1: 'Time to Death'
P value = 9.69e-07 (t-test), Q value = 9.8e-05
Table S4. Gene #5: 'TP53 MUTATION STATUS' versus Clinical Feature #2: 'AGE'
| nPatients | Mean (Std.Dev) | |
|---|---|---|
| ALL | 210 | 43.0 (13.3) |
| TP53 MUTATED | 109 | 38.7 (11.8) |
| TP53 WILD-TYPE | 101 | 47.6 (13.5) |
Figure S4. Get High-res Image Gene #5: 'TP53 MUTATION STATUS' versus Clinical Feature #2: 'AGE'
P value = 2.41e-06 (Fisher's exact test), Q value = 0.00024
Table S5. Gene #5: 'TP53 MUTATION STATUS' versus Clinical Feature #5: 'HISTOLOGICAL.TYPE'
| nPatients | ASTROCYTOMA | OLIGOASTROCYTOMA | OLIGODENDROGLIOMA |
|---|---|---|---|
| ALL | 65 | 57 | 87 |
| TP53 MUTATED | 42 | 39 | 27 |
| TP53 WILD-TYPE | 23 | 18 | 60 |
Figure S5. Get High-res Image Gene #5: 'TP53 MUTATION STATUS' versus Clinical Feature #5: 'HISTOLOGICAL.TYPE'
P value = 0.00202 (Fisher's exact test), Q value = 0.19
Table S6. Gene #5: 'TP53 MUTATION STATUS' versus Clinical Feature #6: 'RADIATIONS.RADIATION.REGIMENINDICATION'
| nPatients | NO | YES |
|---|---|---|
| ALL | 88 | 122 |
| TP53 MUTATED | 57 | 52 |
| TP53 WILD-TYPE | 31 | 70 |
Figure S6. Get High-res Image Gene #5: 'TP53 MUTATION STATUS' versus Clinical Feature #6: 'RADIATIONS.RADIATION.REGIMENINDICATION'
P value = 8.82e-08 (Fisher's exact test), Q value = 9e-06
Table S7. Gene #6: 'CIC MUTATION STATUS' versus Clinical Feature #5: 'HISTOLOGICAL.TYPE'
| nPatients | ASTROCYTOMA | OLIGOASTROCYTOMA | OLIGODENDROGLIOMA |
|---|---|---|---|
| ALL | 65 | 57 | 87 |
| CIC MUTATED | 2 | 5 | 31 |
| CIC WILD-TYPE | 63 | 52 | 56 |
Figure S7. Get High-res Image Gene #6: 'CIC MUTATION STATUS' versus Clinical Feature #5: 'HISTOLOGICAL.TYPE'
P value = 0.000712 (Fisher's exact test), Q value = 0.068
Table S8. Gene #7: 'FUBP1 MUTATION STATUS' versus Clinical Feature #5: 'HISTOLOGICAL.TYPE'
| nPatients | ASTROCYTOMA | OLIGOASTROCYTOMA | OLIGODENDROGLIOMA |
|---|---|---|---|
| ALL | 65 | 57 | 87 |
| FUBP1 MUTATED | 2 | 2 | 17 |
| FUBP1 WILD-TYPE | 63 | 55 | 70 |
Figure S8. Get High-res Image Gene #7: 'FUBP1 MUTATION STATUS' versus Clinical Feature #5: 'HISTOLOGICAL.TYPE'
P value = 0.000119 (Fisher's exact test), Q value = 0.012
Table S9. Gene #8: 'NOTCH1 MUTATION STATUS' versus Clinical Feature #5: 'HISTOLOGICAL.TYPE'
| nPatients | ASTROCYTOMA | OLIGOASTROCYTOMA | OLIGODENDROGLIOMA |
|---|---|---|---|
| ALL | 65 | 57 | 87 |
| NOTCH1 MUTATED | 1 | 1 | 16 |
| NOTCH1 WILD-TYPE | 64 | 56 | 71 |
Figure S9. Get High-res Image Gene #8: 'NOTCH1 MUTATION STATUS' versus Clinical Feature #5: 'HISTOLOGICAL.TYPE'
-
Mutation data file = LGG-TP.mutsig.cluster.txt
-
Clinical data file = LGG-TP.clin.merged.picked.txt
-
Number of patients = 210
-
Number of significantly mutated genes = 18
-
Number of selected clinical features = 6
-
Exclude genes that fewer than K tumors have mutations, K = 3
For survival clinical features, the Kaplan-Meier survival curves of tumors with and without gene mutations were plotted and the statistical significance P values were estimated by logrank test (Bland and Altman 2004) using the 'survdiff' function in R
For continuous numerical clinical features, two-tailed Student's t test with unequal variance (Lehmann and Romano 2005) was applied to compare the clinical values between tumors with and without gene mutations using 't.test' function in R
For binary or multi-class clinical features (nominal or ordinal), two-tailed Fisher's exact tests (Fisher 1922) were used to estimate the P values using the 'fisher.test' function in R
For multiple hypothesis correction, Q value is the False Discovery Rate (FDR) analogue of the P value (Benjamini and Hochberg 1995), defined as the minimum FDR at which the test may be called significant. We used the 'Benjamini and Hochberg' method of 'p.adjust' function in R to convert P values into Q values.
In addition to the links below, the full results of the analysis summarized in this report can also be downloaded programmatically using firehose_get, or interactively from either the Broad GDAC website or TCGA Data Coordination Center Portal.