This pipeline computes the correlation between significant arm-level copy number variations (cnvs) and subtypes.
Testing the association between copy number variation 25 arm-level results and 8 molecular subtypes across 65 patients, 14 significant findings detected with Q value < 0.25.
-
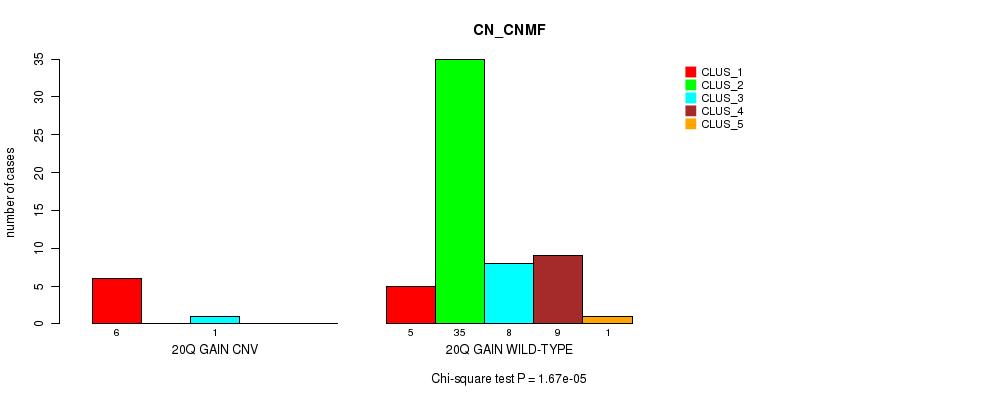
20q gain cnv correlated to 'CN_CNMF'.
-
6q loss cnv correlated to 'METHLYATION_CNMF' and 'MRNASEQ_CHIERARCHICAL'.
-
9p loss cnv correlated to 'CN_CNMF' and 'METHLYATION_CNMF'.
-
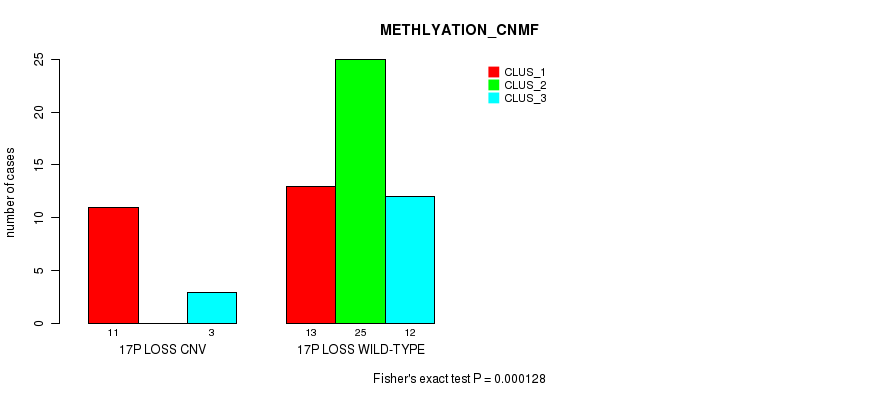
17p loss cnv correlated to 'CN_CNMF', 'METHLYATION_CNMF', and 'MIRSEQ_MATURE_CNMF'.
-
17q loss cnv correlated to 'CN_CNMF'.
-
18q loss cnv correlated to 'METHLYATION_CNMF' and 'MIRSEQ_MATURE_CNMF'.
-
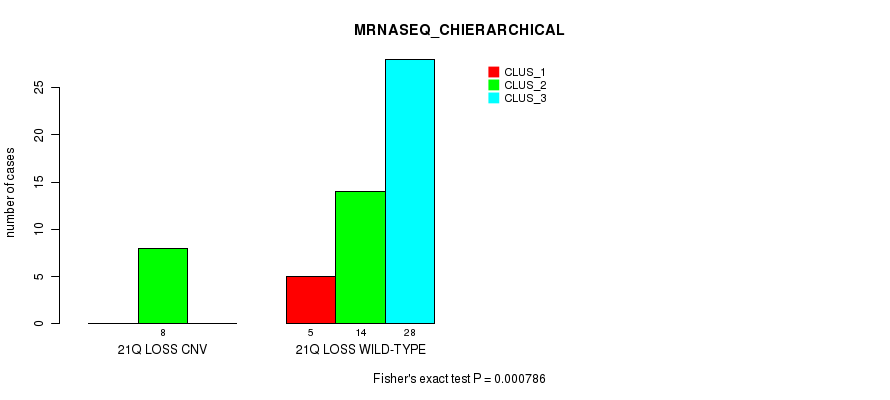
21q loss cnv correlated to 'CN_CNMF', 'METHLYATION_CNMF', and 'MRNASEQ_CHIERARCHICAL'.
Table 1. Get Full Table Overview of the association between significant copy number variation of 25 arm-level results and 8 molecular subtypes. Shown in the table are P values (Q values). Thresholded by Q value < 0.25, 14 significant findings detected.
|
Molecular subtypes |
CN CNMF |
METHLYATION CNMF |
MRNASEQ CNMF |
MRNASEQ CHIERARCHICAL |
MIRSEQ CNMF |
MIRSEQ CHIERARCHICAL |
MIRSEQ MATURE CNMF |
MIRSEQ MATURE CHIERARCHICAL |
||
| nCNV (%) | nWild-Type | Chi-square test | Fisher's exact test | Fisher's exact test | Fisher's exact test | Fisher's exact test | Fisher's exact test | Fisher's exact test | Fisher's exact test | |
| 17p loss | 0 (0%) | 51 |
4.38e-05 (0.00809) |
0.000128 (0.0234) |
0.145 (1.00) |
0.00942 (1.00) |
0.0194 (1.00) |
0.00541 (0.888) |
0.000454 (0.0817) |
0.00402 (0.663) |
| 21q loss | 0 (0%) | 56 |
0.000375 (0.0679) |
0.00118 (0.207) |
0.019 (1.00) |
0.000786 (0.14) |
0.0089 (1.00) |
0.0614 (1.00) |
0.0138 (1.00) |
0.0413 (1.00) |
| 6q loss | 0 (0%) | 55 |
0.0193 (1.00) |
3.91e-05 (0.00726) |
0.019 (1.00) |
0.000786 (0.14) |
0.0089 (1.00) |
0.00596 (0.965) |
0.00148 (0.258) |
0.00236 (0.403) |
| 9p loss | 0 (0%) | 53 |
0.000601 (0.108) |
0.000223 (0.0406) |
0.00328 (0.554) |
0.00272 (0.463) |
0.0113 (1.00) |
0.00895 (1.00) |
0.00227 (0.39) |
0.0089 (1.00) |
| 18q loss | 0 (0%) | 52 |
0.00378 (0.635) |
7.67e-05 (0.0141) |
0.0703 (1.00) |
0.0147 (1.00) |
0.0421 (1.00) |
0.0149 (1.00) |
0.00118 (0.207) |
0.0107 (1.00) |
| 20q gain | 0 (0%) | 58 |
1.67e-05 (0.00315) |
0.404 (1.00) |
0.314 (1.00) |
0.195 (1.00) |
0.111 (1.00) |
0.138 (1.00) |
0.0383 (1.00) |
0.092 (1.00) |
| 17q loss | 0 (0%) | 60 |
2.4e-05 (0.0045) |
0.0147 (1.00) |
0.577 (1.00) |
0.533 (1.00) |
0.318 (1.00) |
0.407 (1.00) |
0.138 (1.00) |
0.271 (1.00) |
| 1q gain | 0 (0%) | 61 |
0.14 (1.00) |
0.0189 (1.00) |
0.26 (1.00) |
0.122 (1.00) |
0.289 (1.00) |
0.289 (1.00) |
0.206 (1.00) |
0.301 (1.00) |
| 3q gain | 0 (0%) | 62 |
0.106 (1.00) |
0.338 (1.00) |
0.26 (1.00) |
0.122 (1.00) |
0.289 (1.00) |
0.289 (1.00) |
0.206 (1.00) |
0.301 (1.00) |
| 7p gain | 0 (0%) | 61 |
0.24 (1.00) |
0.167 (1.00) |
0.885 (1.00) |
0.683 (1.00) |
0.394 (1.00) |
0.661 (1.00) |
0.509 (1.00) |
0.531 (1.00) |
| 8p gain | 0 (0%) | 62 |
0.0607 (1.00) |
0.0595 (1.00) |
0.26 (1.00) |
0.122 (1.00) |
0.289 (1.00) |
0.289 (1.00) |
0.206 (1.00) |
0.301 (1.00) |
| 8q gain | 0 (0%) | 56 |
0.00203 (0.351) |
0.00883 (1.00) |
0.0244 (1.00) |
0.0185 (1.00) |
0.0436 (1.00) |
0.00989 (1.00) |
0.0181 (1.00) |
0.00739 (1.00) |
| 18p gain | 0 (0%) | 60 |
0.11 (1.00) |
0.167 (1.00) |
0.26 (1.00) |
0.122 (1.00) |
0.232 (1.00) |
0.126 (1.00) |
0.0916 (1.00) |
0.133 (1.00) |
| 19q gain | 0 (0%) | 62 |
0.106 (1.00) |
0.0595 (1.00) |
0.26 (1.00) |
0.122 (1.00) |
0.289 (1.00) |
0.289 (1.00) |
0.206 (1.00) |
0.301 (1.00) |
| 5q loss | 0 (0%) | 62 |
0.106 (1.00) |
0.338 (1.00) |
0.289 (1.00) |
0.289 (1.00) |
0.206 (1.00) |
0.301 (1.00) |
||
| 6p loss | 0 (0%) | 59 |
0.0267 (1.00) |
0.00382 (0.639) |
0.0191 (1.00) |
0.0092 (1.00) |
0.0375 (1.00) |
0.0331 (1.00) |
0.013 (1.00) |
0.0185 (1.00) |
| 8p loss | 0 (0%) | 62 |
0.41 (1.00) |
0.338 (1.00) |
0.289 (1.00) |
0.289 (1.00) |
0.206 (1.00) |
0.301 (1.00) |
||
| 9q loss | 0 (0%) | 61 |
0.248 (1.00) |
0.167 (1.00) |
||||||
| 10p loss | 0 (0%) | 61 |
0.0452 (1.00) |
0.0189 (1.00) |
0.26 (1.00) |
0.122 (1.00) |
0.232 (1.00) |
0.126 (1.00) |
0.0916 (1.00) |
0.133 (1.00) |
| 10q loss | 0 (0%) | 61 |
0.00554 (0.903) |
0.0189 (1.00) |
0.26 (1.00) |
0.122 (1.00) |
0.232 (1.00) |
0.126 (1.00) |
0.0916 (1.00) |
0.133 (1.00) |
| 12q loss | 0 (0%) | 61 |
0.0452 (1.00) |
0.0189 (1.00) |
0.885 (1.00) |
0.683 (1.00) |
0.577 (1.00) |
1 (1.00) |
0.385 (1.00) |
1 (1.00) |
| 13q loss | 0 (0%) | 62 |
0.00387 (0.643) |
0.338 (1.00) |
0.289 (1.00) |
0.289 (1.00) |
0.206 (1.00) |
0.301 (1.00) |
||
| 15q loss | 0 (0%) | 61 |
0.208 (1.00) |
0.0189 (1.00) |
0.321 (1.00) |
0.0588 (1.00) |
0.232 (1.00) |
0.126 (1.00) |
0.0916 (1.00) |
0.133 (1.00) |
| 18p loss | 0 (0%) | 59 |
0.319 (1.00) |
0.0252 (1.00) |
0.667 (1.00) |
0.257 (1.00) |
0.571 (1.00) |
0.407 (1.00) |
0.138 (1.00) |
0.271 (1.00) |
| 22q loss | 0 (0%) | 61 |
0.0187 (1.00) |
0.167 (1.00) |
0.26 (1.00) |
0.122 (1.00) |
0.289 (1.00) |
0.289 (1.00) |
0.206 (1.00) |
0.301 (1.00) |
P value = 1.67e-05 (Chi-square test), Q value = 0.0031
Table S1. Gene #8: '20q gain' versus Molecular Subtype #1: 'CN_CNMF'
| nPatients | CLUS_1 | CLUS_2 | CLUS_3 | CLUS_4 | CLUS_5 |
|---|---|---|---|---|---|
| ALL | 11 | 35 | 9 | 9 | 1 |
| 20Q GAIN CNV | 6 | 0 | 1 | 0 | 0 |
| 20Q GAIN WILD-TYPE | 5 | 35 | 8 | 9 | 1 |
Figure S1. Get High-res Image Gene #8: '20q gain' versus Molecular Subtype #1: 'CN_CNMF'
P value = 3.91e-05 (Fisher's exact test), Q value = 0.0073
Table S2. Gene #11: '6q loss' versus Molecular Subtype #2: 'METHLYATION_CNMF'
| nPatients | CLUS_1 | CLUS_2 | CLUS_3 |
|---|---|---|---|
| ALL | 24 | 25 | 15 |
| 6Q LOSS CNV | 10 | 0 | 0 |
| 6Q LOSS WILD-TYPE | 14 | 25 | 15 |
Figure S2. Get High-res Image Gene #11: '6q loss' versus Molecular Subtype #2: 'METHLYATION_CNMF'

P value = 0.000786 (Fisher's exact test), Q value = 0.14
Table S3. Gene #11: '6q loss' versus Molecular Subtype #4: 'MRNASEQ_CHIERARCHICAL'
| nPatients | CLUS_1 | CLUS_2 | CLUS_3 |
|---|---|---|---|
| ALL | 5 | 22 | 28 |
| 6Q LOSS CNV | 0 | 8 | 0 |
| 6Q LOSS WILD-TYPE | 5 | 14 | 28 |
Figure S3. Get High-res Image Gene #11: '6q loss' versus Molecular Subtype #4: 'MRNASEQ_CHIERARCHICAL'

P value = 0.000601 (Chi-square test), Q value = 0.11
Table S4. Gene #13: '9p loss' versus Molecular Subtype #1: 'CN_CNMF'
| nPatients | CLUS_1 | CLUS_2 | CLUS_3 | CLUS_4 | CLUS_5 |
|---|---|---|---|---|---|
| ALL | 11 | 35 | 9 | 9 | 1 |
| 9P LOSS CNV | 5 | 2 | 5 | 0 | 0 |
| 9P LOSS WILD-TYPE | 6 | 33 | 4 | 9 | 1 |
Figure S4. Get High-res Image Gene #13: '9p loss' versus Molecular Subtype #1: 'CN_CNMF'

P value = 0.000223 (Fisher's exact test), Q value = 0.041
Table S5. Gene #13: '9p loss' versus Molecular Subtype #2: 'METHLYATION_CNMF'
| nPatients | CLUS_1 | CLUS_2 | CLUS_3 |
|---|---|---|---|
| ALL | 24 | 25 | 15 |
| 9P LOSS CNV | 10 | 0 | 2 |
| 9P LOSS WILD-TYPE | 14 | 25 | 13 |
Figure S5. Get High-res Image Gene #13: '9p loss' versus Molecular Subtype #2: 'METHLYATION_CNMF'

P value = 4.38e-05 (Chi-square test), Q value = 0.0081
Table S6. Gene #20: '17p loss' versus Molecular Subtype #1: 'CN_CNMF'
| nPatients | CLUS_1 | CLUS_2 | CLUS_3 | CLUS_4 | CLUS_5 |
|---|---|---|---|---|---|
| ALL | 11 | 35 | 9 | 9 | 1 |
| 17P LOSS CNV | 8 | 1 | 2 | 3 | 0 |
| 17P LOSS WILD-TYPE | 3 | 34 | 7 | 6 | 1 |
Figure S6. Get High-res Image Gene #20: '17p loss' versus Molecular Subtype #1: 'CN_CNMF'

P value = 0.000128 (Fisher's exact test), Q value = 0.023
Table S7. Gene #20: '17p loss' versus Molecular Subtype #2: 'METHLYATION_CNMF'
| nPatients | CLUS_1 | CLUS_2 | CLUS_3 |
|---|---|---|---|
| ALL | 24 | 25 | 15 |
| 17P LOSS CNV | 11 | 0 | 3 |
| 17P LOSS WILD-TYPE | 13 | 25 | 12 |
Figure S7. Get High-res Image Gene #20: '17p loss' versus Molecular Subtype #2: 'METHLYATION_CNMF'
P value = 0.000454 (Fisher's exact test), Q value = 0.082
Table S8. Gene #20: '17p loss' versus Molecular Subtype #7: 'MIRSEQ_MATURE_CNMF'
| nPatients | CLUS_1 | CLUS_2 | CLUS_3 |
|---|---|---|---|
| ALL | 25 | 10 | 23 |
| 17P LOSS CNV | 11 | 2 | 0 |
| 17P LOSS WILD-TYPE | 14 | 8 | 23 |
Figure S8. Get High-res Image Gene #20: '17p loss' versus Molecular Subtype #7: 'MIRSEQ_MATURE_CNMF'

P value = 2.4e-05 (Chi-square test), Q value = 0.0045
Table S9. Gene #21: '17q loss' versus Molecular Subtype #1: 'CN_CNMF'
| nPatients | CLUS_1 | CLUS_2 | CLUS_3 | CLUS_4 | CLUS_5 |
|---|---|---|---|---|---|
| ALL | 11 | 35 | 9 | 9 | 1 |
| 17Q LOSS CNV | 5 | 0 | 0 | 0 | 0 |
| 17Q LOSS WILD-TYPE | 6 | 35 | 9 | 9 | 1 |
Figure S9. Get High-res Image Gene #21: '17q loss' versus Molecular Subtype #1: 'CN_CNMF'

P value = 7.67e-05 (Fisher's exact test), Q value = 0.014
Table S10. Gene #23: '18q loss' versus Molecular Subtype #2: 'METHLYATION_CNMF'
| nPatients | CLUS_1 | CLUS_2 | CLUS_3 |
|---|---|---|---|
| ALL | 24 | 25 | 15 |
| 18Q LOSS CNV | 11 | 0 | 2 |
| 18Q LOSS WILD-TYPE | 13 | 25 | 13 |
Figure S10. Get High-res Image Gene #23: '18q loss' versus Molecular Subtype #2: 'METHLYATION_CNMF'

P value = 0.00118 (Fisher's exact test), Q value = 0.21
Table S11. Gene #23: '18q loss' versus Molecular Subtype #7: 'MIRSEQ_MATURE_CNMF'
| nPatients | CLUS_1 | CLUS_2 | CLUS_3 |
|---|---|---|---|
| ALL | 25 | 10 | 23 |
| 18Q LOSS CNV | 10 | 2 | 0 |
| 18Q LOSS WILD-TYPE | 15 | 8 | 23 |
Figure S11. Get High-res Image Gene #23: '18q loss' versus Molecular Subtype #7: 'MIRSEQ_MATURE_CNMF'

P value = 0.000375 (Chi-square test), Q value = 0.068
Table S12. Gene #24: '21q loss' versus Molecular Subtype #1: 'CN_CNMF'
| nPatients | CLUS_1 | CLUS_2 | CLUS_3 | CLUS_4 | CLUS_5 |
|---|---|---|---|---|---|
| ALL | 11 | 35 | 9 | 9 | 1 |
| 21Q LOSS CNV | 3 | 0 | 5 | 1 | 0 |
| 21Q LOSS WILD-TYPE | 8 | 35 | 4 | 8 | 1 |
Figure S12. Get High-res Image Gene #24: '21q loss' versus Molecular Subtype #1: 'CN_CNMF'

P value = 0.00118 (Fisher's exact test), Q value = 0.21
Table S13. Gene #24: '21q loss' versus Molecular Subtype #2: 'METHLYATION_CNMF'
| nPatients | CLUS_1 | CLUS_2 | CLUS_3 |
|---|---|---|---|
| ALL | 24 | 25 | 15 |
| 21Q LOSS CNV | 8 | 0 | 1 |
| 21Q LOSS WILD-TYPE | 16 | 25 | 14 |
Figure S13. Get High-res Image Gene #24: '21q loss' versus Molecular Subtype #2: 'METHLYATION_CNMF'

P value = 0.000786 (Fisher's exact test), Q value = 0.14
Table S14. Gene #24: '21q loss' versus Molecular Subtype #4: 'MRNASEQ_CHIERARCHICAL'
| nPatients | CLUS_1 | CLUS_2 | CLUS_3 |
|---|---|---|---|
| ALL | 5 | 22 | 28 |
| 21Q LOSS CNV | 0 | 8 | 0 |
| 21Q LOSS WILD-TYPE | 5 | 14 | 28 |
Figure S14. Get High-res Image Gene #24: '21q loss' versus Molecular Subtype #4: 'MRNASEQ_CHIERARCHICAL'
-
Mutation data file = broad_values_by_arm.mutsig.cluster.txt
-
Molecular subtypes file = PAAD-TP.transferedmergedcluster.txt
-
Number of patients = 65
-
Number of significantly arm-level cnvs = 25
-
Number of molecular subtypes = 8
-
Exclude genes that fewer than K tumors have mutations, K = 3
For multi-class clinical features (nominal or ordinal), Chi-square tests (Greenwood and Nikulin 1996) were used to estimate the P values using the 'chisq.test' function in R
For binary or multi-class clinical features (nominal or ordinal), two-tailed Fisher's exact tests (Fisher 1922) were used to estimate the P values using the 'fisher.test' function in R
For multiple hypothesis correction, Q value is the False Discovery Rate (FDR) analogue of the P value (Benjamini and Hochberg 1995), defined as the minimum FDR at which the test may be called significant. We used the 'Benjamini and Hochberg' method of 'p.adjust' function in R to convert P values into Q values.
In addition to the links below, the full results of the analysis summarized in this report can also be downloaded programmatically using firehose_get, or interactively from either the Broad GDAC website or TCGA Data Coordination Center Portal.