This pipeline computes the correlation between significantly recurrent gene mutations and selected clinical features.
Testing the association between mutation status of 7 genes and 15 clinical features across 385 patients, 8 significant findings detected with Q value < 0.25.
-
NRAS mutation correlated to 'PATHOLOGY.N.STAGE', 'HISTOLOGICAL.TYPE', and 'NUMBER.OF.LYMPH.NODES'.
-
BRAF mutation correlated to 'NEOPLASM.DISEASESTAGE', 'PATHOLOGY.T.STAGE', 'PATHOLOGY.N.STAGE', 'HISTOLOGICAL.TYPE', and 'EXTRATHYROIDAL.EXTENSION'.
Table 1. Get Full Table Overview of the association between mutation status of 7 genes and 15 clinical features. Shown in the table are P values (Q values). Thresholded by Q value < 0.25, 8 significant findings detected.
|
Clinical Features |
Time to Death |
AGE |
NEOPLASM DISEASESTAGE |
PATHOLOGY T STAGE |
PATHOLOGY N STAGE |
PATHOLOGY M STAGE |
GENDER |
HISTOLOGICAL TYPE |
RADIATIONS RADIATION REGIMENINDICATION |
RADIATIONEXPOSURE |
EXTRATHYROIDAL EXTENSION |
COMPLETENESS OF RESECTION |
NUMBER OF LYMPH NODES |
MULTIFOCALITY |
TUMOR SIZE |
||
| nMutated (%) | nWild-Type | logrank test | t-test | Chi-square test | Fisher's exact test | Fisher's exact test | Fisher's exact test | Fisher's exact test | Fisher's exact test | Fisher's exact test | Fisher's exact test | Fisher's exact test | Fisher's exact test | t-test | Fisher's exact test | t-test | |
| BRAF | 232 (60%) | 153 |
0.806 (1.00) |
0.848 (1.00) |
0.00245 (0.236) |
0.000849 (0.0832) |
0.000905 (0.0877) |
0.0672 (1.00) |
0.552 (1.00) |
5.43e-20 (5.59e-18) |
0.0323 (1.00) |
0.591 (1.00) |
2.09e-07 (2.13e-05) |
0.587 (1.00) |
0.618 (1.00) |
0.752 (1.00) |
0.231 (1.00) |
| NRAS | 32 (8%) | 353 |
0.478 (1.00) |
0.748 (1.00) |
0.0436 (1.00) |
0.0788 (1.00) |
0.000413 (0.0409) |
0.348 (1.00) |
0.674 (1.00) |
1.55e-05 (0.00156) |
0.61 (1.00) |
1 (1.00) |
0.105 (1.00) |
0.739 (1.00) |
0.000113 (0.0113) |
0.194 (1.00) |
0.851 (1.00) |
| HRAS | 13 (3%) | 372 |
0.52 (1.00) |
0.616 (1.00) |
0.339 (1.00) |
0.436 (1.00) |
0.549 (1.00) |
0.262 (1.00) |
0.745 (1.00) |
0.0147 (1.00) |
1 (1.00) |
1 (1.00) |
0.681 (1.00) |
0.137 (1.00) |
0.51 (1.00) |
0.779 (1.00) |
0.933 (1.00) |
| OTUD4 | 5 (1%) | 380 |
0.65 (1.00) |
0.709 (1.00) |
0.911 (1.00) |
1 (1.00) |
0.671 (1.00) |
0.241 (1.00) |
0.336 (1.00) |
0.436 (1.00) |
1 (1.00) |
1 (1.00) |
0.67 (1.00) |
1 (1.00) |
0.00629 (0.597) |
0.667 (1.00) |
|
| EIF1AX | 6 (2%) | 379 |
0.0796 (1.00) |
0.135 (1.00) |
0.969 (1.00) |
1 (1.00) |
0.625 (1.00) |
0.468 (1.00) |
0.171 (1.00) |
0.0922 (1.00) |
1 (1.00) |
1 (1.00) |
1 (1.00) |
0.255 (1.00) |
0.771 (1.00) |
0.667 (1.00) |
0.672 (1.00) |
| NUP93 | 4 (1%) | 381 |
0.907 (1.00) |
0.391 (1.00) |
0.794 (1.00) |
0.731 (1.00) |
0.349 (1.00) |
0.653 (1.00) |
1 (1.00) |
0.0157 (1.00) |
1 (1.00) |
1 (1.00) |
1 (1.00) |
0.498 (1.00) |
0.609 (1.00) |
0.342 (1.00) |
0.995 (1.00) |
| NLRP6 | 3 (1%) | 382 |
0.655 (1.00) |
0.0342 (1.00) |
0.815 (1.00) |
0.157 (1.00) |
0.605 (1.00) |
0.132 (1.00) |
1 (1.00) |
0.668 (1.00) |
1 (1.00) |
1 (1.00) |
1 (1.00) |
1 (1.00) |
0.525 (1.00) |
0.6 (1.00) |
P value = 0.000413 (Fisher's exact test), Q value = 0.041
Table S1. Gene #1: 'NRAS MUTATION STATUS' versus Clinical Feature #5: 'PATHOLOGY.N.STAGE'
| nPatients | 0 | 1 |
|---|---|---|
| ALL | 181 | 163 |
| NRAS MUTATED | 25 | 5 |
| NRAS WILD-TYPE | 156 | 158 |
Figure S1. Get High-res Image Gene #1: 'NRAS MUTATION STATUS' versus Clinical Feature #5: 'PATHOLOGY.N.STAGE'

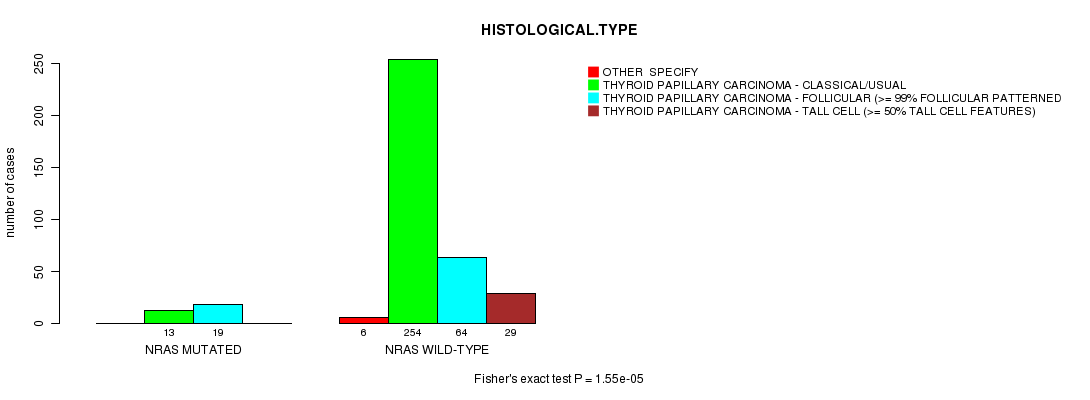
P value = 1.55e-05 (Fisher's exact test), Q value = 0.0016
Table S2. Gene #1: 'NRAS MUTATION STATUS' versus Clinical Feature #8: 'HISTOLOGICAL.TYPE'
| nPatients | OTHER SPECIFY | THYROID PAPILLARY CARCINOMA - CLASSICAL/USUAL | THYROID PAPILLARY CARCINOMA - FOLLICULAR (>= 99% FOLLICULAR PATTERNED) | THYROID PAPILLARY CARCINOMA - TALL CELL (>= 50% TALL CELL FEATURES) |
|---|---|---|---|---|
| ALL | 6 | 267 | 83 | 29 |
| NRAS MUTATED | 0 | 13 | 19 | 0 |
| NRAS WILD-TYPE | 6 | 254 | 64 | 29 |
Figure S2. Get High-res Image Gene #1: 'NRAS MUTATION STATUS' versus Clinical Feature #8: 'HISTOLOGICAL.TYPE'
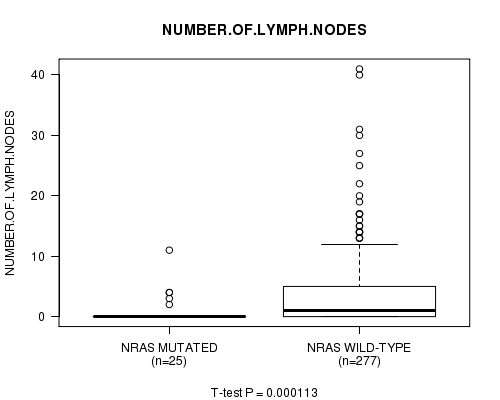
P value = 0.000113 (t-test), Q value = 0.011
Table S3. Gene #1: 'NRAS MUTATION STATUS' versus Clinical Feature #13: 'NUMBER.OF.LYMPH.NODES'
| nPatients | Mean (Std.Dev) | |
|---|---|---|
| ALL | 302 | 3.3 (6.0) |
| NRAS MUTATED | 25 | 1.0 (2.4) |
| NRAS WILD-TYPE | 277 | 3.5 (6.2) |
Figure S3. Get High-res Image Gene #1: 'NRAS MUTATION STATUS' versus Clinical Feature #13: 'NUMBER.OF.LYMPH.NODES'
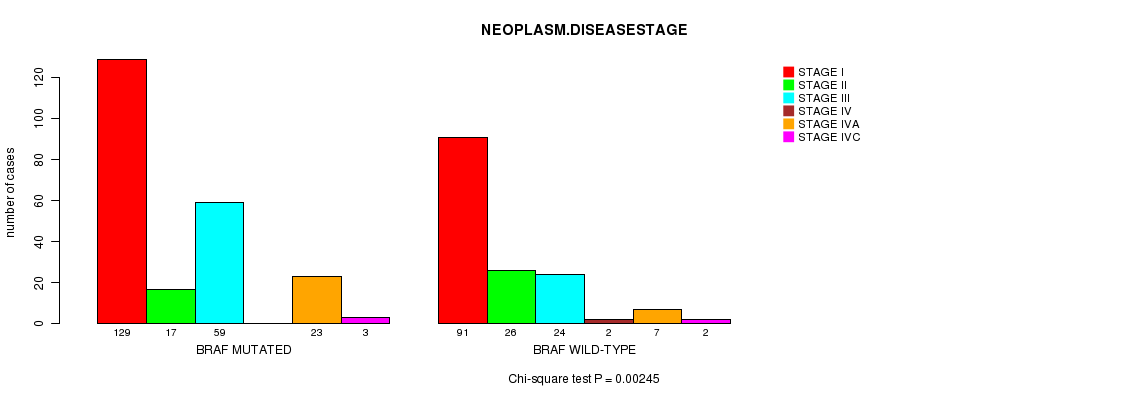
P value = 0.00245 (Chi-square test), Q value = 0.24
Table S4. Gene #2: 'BRAF MUTATION STATUS' versus Clinical Feature #3: 'NEOPLASM.DISEASESTAGE'
| nPatients | STAGE I | STAGE II | STAGE III | STAGE IV | STAGE IVA | STAGE IVC |
|---|---|---|---|---|---|---|
| ALL | 220 | 43 | 83 | 2 | 30 | 5 |
| BRAF MUTATED | 129 | 17 | 59 | 0 | 23 | 3 |
| BRAF WILD-TYPE | 91 | 26 | 24 | 2 | 7 | 2 |
Figure S4. Get High-res Image Gene #2: 'BRAF MUTATION STATUS' versus Clinical Feature #3: 'NEOPLASM.DISEASESTAGE'
P value = 0.000849 (Fisher's exact test), Q value = 0.083
Table S5. Gene #2: 'BRAF MUTATION STATUS' versus Clinical Feature #4: 'PATHOLOGY.T.STAGE'
| nPatients | T1 | T2 | T3 | T4 |
|---|---|---|---|---|
| ALL | 113 | 133 | 124 | 13 |
| BRAF MUTATED | 67 | 65 | 88 | 11 |
| BRAF WILD-TYPE | 46 | 68 | 36 | 2 |
Figure S5. Get High-res Image Gene #2: 'BRAF MUTATION STATUS' versus Clinical Feature #4: 'PATHOLOGY.T.STAGE'

P value = 0.000905 (Fisher's exact test), Q value = 0.088
Table S6. Gene #2: 'BRAF MUTATION STATUS' versus Clinical Feature #5: 'PATHOLOGY.N.STAGE'
| nPatients | 0 | 1 |
|---|---|---|
| ALL | 181 | 163 |
| BRAF MUTATED | 96 | 115 |
| BRAF WILD-TYPE | 85 | 48 |
Figure S6. Get High-res Image Gene #2: 'BRAF MUTATION STATUS' versus Clinical Feature #5: 'PATHOLOGY.N.STAGE'

P value = 5.43e-20 (Fisher's exact test), Q value = 5.6e-18
Table S7. Gene #2: 'BRAF MUTATION STATUS' versus Clinical Feature #8: 'HISTOLOGICAL.TYPE'
| nPatients | OTHER SPECIFY | THYROID PAPILLARY CARCINOMA - CLASSICAL/USUAL | THYROID PAPILLARY CARCINOMA - FOLLICULAR (>= 99% FOLLICULAR PATTERNED) | THYROID PAPILLARY CARCINOMA - TALL CELL (>= 50% TALL CELL FEATURES) |
|---|---|---|---|---|
| ALL | 6 | 267 | 83 | 29 |
| BRAF MUTATED | 3 | 187 | 15 | 27 |
| BRAF WILD-TYPE | 3 | 80 | 68 | 2 |
Figure S7. Get High-res Image Gene #2: 'BRAF MUTATION STATUS' versus Clinical Feature #8: 'HISTOLOGICAL.TYPE'

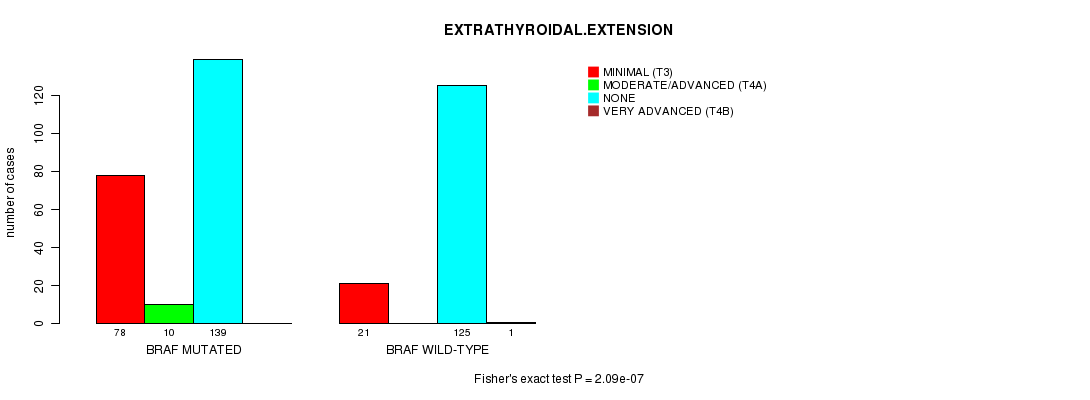
P value = 2.09e-07 (Fisher's exact test), Q value = 2.1e-05
Table S8. Gene #2: 'BRAF MUTATION STATUS' versus Clinical Feature #11: 'EXTRATHYROIDAL.EXTENSION'
| nPatients | MINIMAL (T3) | MODERATE/ADVANCED (T4A) | NONE | VERY ADVANCED (T4B) |
|---|---|---|---|---|
| ALL | 99 | 10 | 264 | 1 |
| BRAF MUTATED | 78 | 10 | 139 | 0 |
| BRAF WILD-TYPE | 21 | 0 | 125 | 1 |
Figure S8. Get High-res Image Gene #2: 'BRAF MUTATION STATUS' versus Clinical Feature #11: 'EXTRATHYROIDAL.EXTENSION'
-
Mutation data file = THCA-TP.mutsig.cluster.txt
-
Clinical data file = THCA-TP.clin.merged.picked.txt
-
Number of patients = 385
-
Number of significantly mutated genes = 7
-
Number of selected clinical features = 15
-
Exclude genes that fewer than K tumors have mutations, K = 3
For survival clinical features, the Kaplan-Meier survival curves of tumors with and without gene mutations were plotted and the statistical significance P values were estimated by logrank test (Bland and Altman 2004) using the 'survdiff' function in R
For continuous numerical clinical features, two-tailed Student's t test with unequal variance (Lehmann and Romano 2005) was applied to compare the clinical values between tumors with and without gene mutations using 't.test' function in R
For multi-class clinical features (nominal or ordinal), Chi-square tests (Greenwood and Nikulin 1996) were used to estimate the P values using the 'chisq.test' function in R
For binary or multi-class clinical features (nominal or ordinal), two-tailed Fisher's exact tests (Fisher 1922) were used to estimate the P values using the 'fisher.test' function in R
For multiple hypothesis correction, Q value is the False Discovery Rate (FDR) analogue of the P value (Benjamini and Hochberg 1995), defined as the minimum FDR at which the test may be called significant. We used the 'Benjamini and Hochberg' method of 'p.adjust' function in R to convert P values into Q values.
In addition to the links below, the full results of the analysis summarized in this report can also be downloaded programmatically using firehose_get, or interactively from either the Broad GDAC website or TCGA Data Coordination Center Portal.