This pipeline uses various statistical tests to identify genes whose promoter methylation levels correlated to selected clinical features.
Testing the association between 20141 genes and 9 clinical features across 84 samples, statistically thresholded by Q value < 0.05, 3 clinical features related to at least one genes.
-
105 genes correlated to 'PATHOLOGY.M.STAGE'.
-
DUOX2 , DUOXA2 , CHERP , CHRNA7 , DPF3 , ...
-
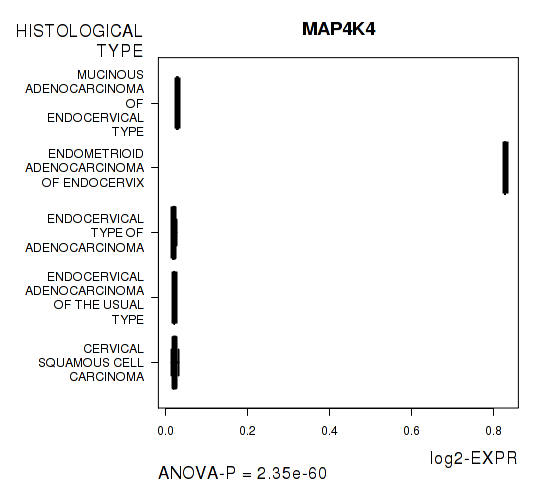
1057 genes correlated to 'HISTOLOGICAL.TYPE'.
-
MAP4K4 , ANO6 , PLEKHA9 , DGCR5 , CIDEA , ...
-
10 genes correlated to 'RADIATIONS.RADIATION.REGIMENINDICATION'.
-
CTF1 , NKX3-2 , MAP6 , ZNF221 , HOOK3 , ...
-
No genes correlated to 'Time to Death', 'AGE', 'PATHOLOGY.T.STAGE', 'PATHOLOGY.N.STAGE', 'NUMBERPACKYEARSSMOKED', and 'NUMBER.OF.LYMPH.NODES'.
Complete statistical result table is provided in Supplement Table 1
Table 1. Get Full Table This table shows the clinical features, statistical methods used, and the number of genes that are significantly associated with each clinical feature at Q value < 0.05.
| Clinical feature | Statistical test | Significant genes | Associated with | Associated with | ||
|---|---|---|---|---|---|---|
| Time to Death | Cox regression test | N=0 | ||||
| AGE | Spearman correlation test | N=0 | ||||
| PATHOLOGY T STAGE | Spearman correlation test | N=0 | ||||
| PATHOLOGY N STAGE | t test | N=0 | ||||
| PATHOLOGY M STAGE | ANOVA test | N=105 | ||||
| HISTOLOGICAL TYPE | ANOVA test | N=1057 | ||||
| RADIATIONS RADIATION REGIMENINDICATION | t test | N=10 | yes | N=7 | no | N=3 |
| NUMBERPACKYEARSSMOKED | Spearman correlation test | N=0 | ||||
| NUMBER OF LYMPH NODES | Spearman correlation test | N=0 |
Table S1. Basic characteristics of clinical feature: 'Time to Death'
| Time to Death | Duration (Months) | 0-177 (median=6.9) |
| censored | N = 68 | |
| death | N = 14 | |
| Significant markers | N = 0 |
Table S2. Basic characteristics of clinical feature: 'AGE'
| AGE | Mean (SD) | 48.2 (13) |
| Significant markers | N = 0 |
Table S3. Basic characteristics of clinical feature: 'PATHOLOGY.T.STAGE'
| PATHOLOGY.T.STAGE | Mean (SD) | 1.38 (0.65) |
| N | ||
| 1 | 53 | |
| 2 | 22 | |
| 3 | 1 | |
| 4 | 2 | |
| Significant markers | N = 0 |
Table S4. Basic characteristics of clinical feature: 'PATHOLOGY.N.STAGE'
| PATHOLOGY.N.STAGE | Labels | N |
| class0 | 52 | |
| class1 | 24 | |
| Significant markers | N = 0 |
Table S5. Basic characteristics of clinical feature: 'PATHOLOGY.M.STAGE'
| PATHOLOGY.M.STAGE | Labels | N |
| M0 | 51 | |
| M1 | 2 | |
| MX | 26 | |
| Significant markers | N = 105 |
Table S6. Get Full Table List of top 10 genes differentially expressed by 'PATHOLOGY.M.STAGE'
| ANOVA_P | Q | |
|---|---|---|
| DUOX2 | 1.627e-20 | 3.28e-16 |
| DUOXA2 | 1.627e-20 | 3.28e-16 |
| CHERP | 5.527e-15 | 1.11e-10 |
| CHRNA7 | 2.745e-14 | 5.53e-10 |
| DPF3 | 3.064e-13 | 6.17e-09 |
| MTUS2 | 4.214e-12 | 8.49e-08 |
| PFKM__1 | 1.12e-11 | 2.26e-07 |
| SOCS2 | 6.78e-11 | 1.37e-06 |
| ATOH8 | 8.247e-11 | 1.66e-06 |
| ADAMTS13__1 | 1.045e-10 | 2.1e-06 |
Figure S1. Get High-res Image As an example, this figure shows the association of DUOX2 to 'PATHOLOGY.M.STAGE'. P value = 1.63e-20 with ANOVA analysis.
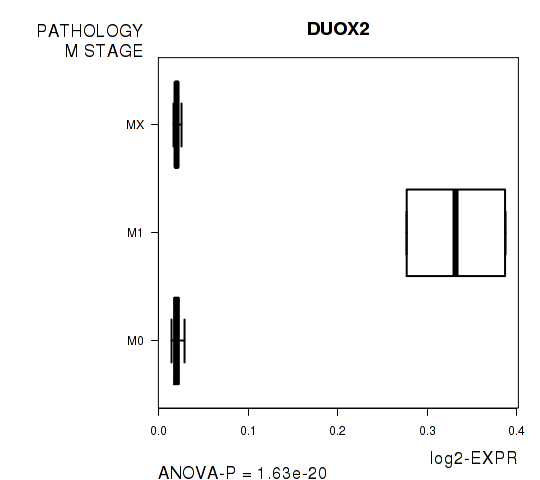
Table S7. Basic characteristics of clinical feature: 'HISTOLOGICAL.TYPE'
| HISTOLOGICAL.TYPE | Labels | N |
| CERVICAL SQUAMOUS CELL CARCINOMA | 72 | |
| ENDOCERVICAL ADENOCARCINOMA OF THE USUAL TYPE | 1 | |
| ENDOCERVICAL TYPE OF ADENOCARCINOMA | 8 | |
| ENDOMETRIOID ADENOCARCINOMA OF ENDOCERVIX | 1 | |
| MUCINOUS ADENOCARCINOMA OF ENDOCERVICAL TYPE | 2 | |
| Significant markers | N = 1057 |
Table S8. Get Full Table List of top 10 genes differentially expressed by 'HISTOLOGICAL.TYPE'
| ANOVA_P | Q | |
|---|---|---|
| MAP4K4 | 2.347e-60 | 4.73e-56 |
| ANO6 | 2.889e-55 | 5.82e-51 |
| PLEKHA9 | 2.889e-55 | 5.82e-51 |
| DGCR5 | 1.668e-53 | 3.36e-49 |
| CIDEA | 1.644e-51 | 3.31e-47 |
| OSCAR | 6.57e-51 | 1.32e-46 |
| C17ORF86__1 | 8.266e-45 | 1.66e-40 |
| SCARNA16__1 | 8.266e-45 | 1.66e-40 |
| ABTB2 | 1.161e-44 | 2.34e-40 |
| PTGIR | 1.132e-42 | 2.28e-38 |
Figure S2. Get High-res Image As an example, this figure shows the association of MAP4K4 to 'HISTOLOGICAL.TYPE'. P value = 2.35e-60 with ANOVA analysis.
10 genes related to 'RADIATIONS.RADIATION.REGIMENINDICATION'.
Table S9. Basic characteristics of clinical feature: 'RADIATIONS.RADIATION.REGIMENINDICATION'
| RADIATIONS.RADIATION.REGIMENINDICATION | Labels | N |
| NO | 17 | |
| YES | 67 | |
| Significant markers | N = 10 | |
| Higher in YES | 7 | |
| Higher in NO | 3 |
Table S10. Get Full Table List of 10 genes differentially expressed by 'RADIATIONS.RADIATION.REGIMENINDICATION'
| T(pos if higher in 'YES') | ttestP | Q | AUC | |
|---|---|---|---|---|
| CTF1 | 6.85 | 1.749e-09 | 3.52e-05 | 0.8068 |
| NKX3-2 | 6.46 | 9.059e-09 | 0.000182 | 0.7331 |
| MAP6 | 5.42 | 8.299e-07 | 0.0167 | 0.6295 |
| ZNF221 | 5.41 | 8.719e-07 | 0.0176 | 0.8078 |
| HOOK3 | -5.65 | 1.085e-06 | 0.0218 | 0.849 |
| RNF170 | -5.65 | 1.085e-06 | 0.0218 | 0.849 |
| CDH16 | -5.19 | 1.656e-06 | 0.0333 | 0.8174 |
| TMEM160 | 5.21 | 1.672e-06 | 0.0337 | 0.7612 |
| ANKRD5 | 5.08 | 2.338e-06 | 0.0471 | 0.8165 |
| GJB2 | 5.08 | 2.406e-06 | 0.0484 | 0.6874 |
Figure S3. Get High-res Image As an example, this figure shows the association of CTF1 to 'RADIATIONS.RADIATION.REGIMENINDICATION'. P value = 1.75e-09 with T-test analysis.
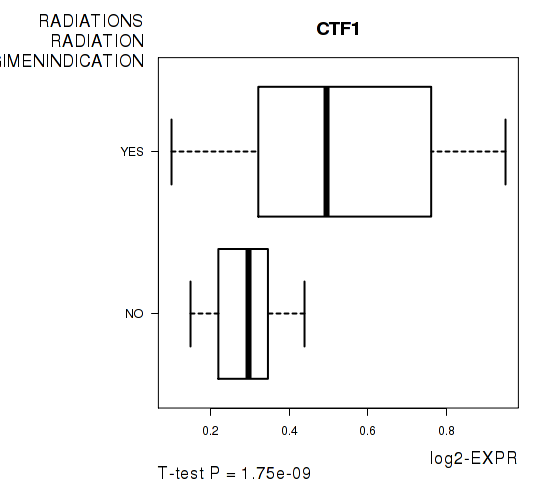
Table S11. Basic characteristics of clinical feature: 'NUMBERPACKYEARSSMOKED'
| NUMBERPACKYEARSSMOKED | Mean (SD) | 18 (13) |
| Significant markers | N = 0 |
-
Expresson data file = CESC-TP.meth.by_min_clin_corr.data.txt
-
Clinical data file = CESC-TP.merged_data.txt
-
Number of patients = 84
-
Number of genes = 20141
-
Number of clinical features = 9
For survival clinical features, Wald's test in univariate Cox regression analysis with proportional hazards model (Andersen and Gill 1982) was used to estimate the P values using the 'coxph' function in R. Kaplan-Meier survival curves were plot using the four quartile subgroups of patients based on expression levels
For continuous numerical clinical features, Spearman's rank correlation coefficients (Spearman 1904) and two-tailed P values were estimated using 'cor.test' function in R
For two-class clinical features, two-tailed Student's t test with unequal variance (Lehmann and Romano 2005) was applied to compare the log2-expression levels between the two clinical classes using 't.test' function in R
For multi-class clinical features (ordinal or nominal), one-way analysis of variance (Howell 2002) was applied to compare the log2-expression levels between different clinical classes using 'anova' function in R
For multiple hypothesis correction, Q value is the False Discovery Rate (FDR) analogue of the P value (Benjamini and Hochberg 1995), defined as the minimum FDR at which the test may be called significant. We used the 'Benjamini and Hochberg' method of 'p.adjust' function in R to convert P values into Q values.
In addition to the links below, the full results of the analysis summarized in this report can also be downloaded programmatically using firehose_get, or interactively from either the Broad GDAC website or TCGA Data Coordination Center Portal.