This pipeline computes the correlation between significant arm-level copy number variations (cnvs) and selected clinical features.
Testing the association between copy number variation 79 arm-level events and 11 clinical features across 424 patients, 12 significant findings detected with Q value < 0.25.
-
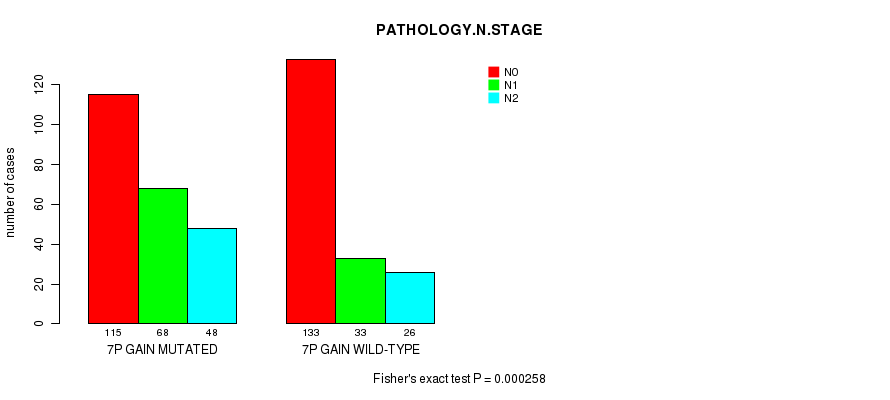
7p gain cnv correlated to 'PATHOLOGY.N.STAGE'.
-
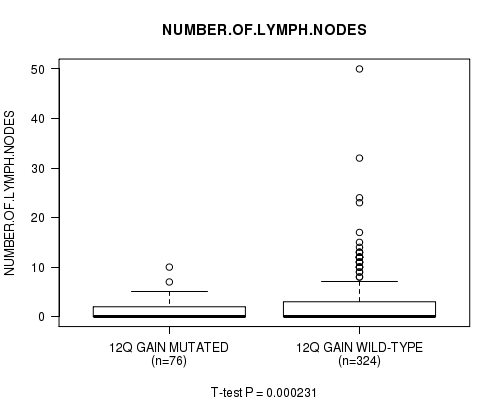
12q gain cnv correlated to 'NUMBER.OF.LYMPH.NODES'.
-
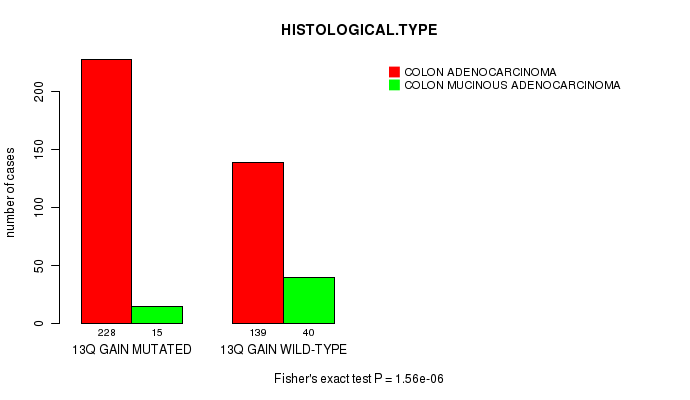
13q gain cnv correlated to 'HISTOLOGICAL.TYPE'.
-
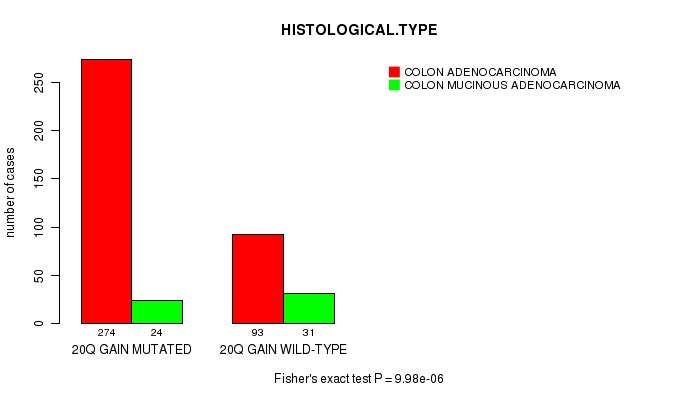
20q gain cnv correlated to 'HISTOLOGICAL.TYPE'.
-
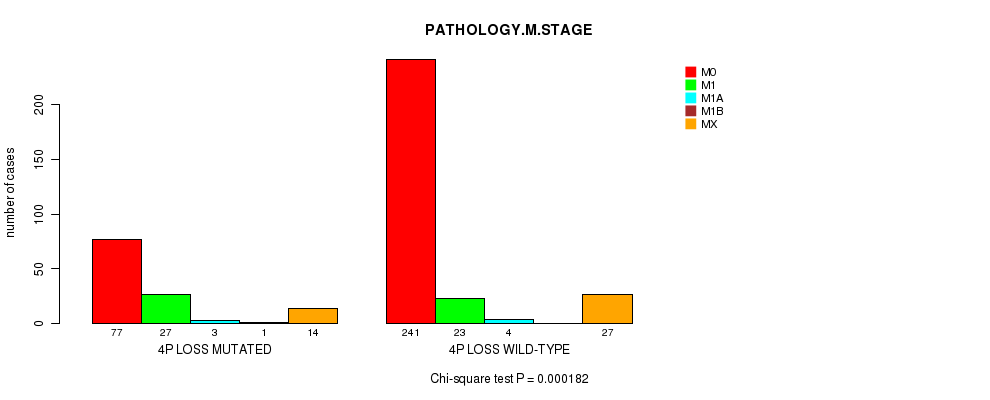
4p loss cnv correlated to 'PATHOLOGY.M.STAGE'.
-
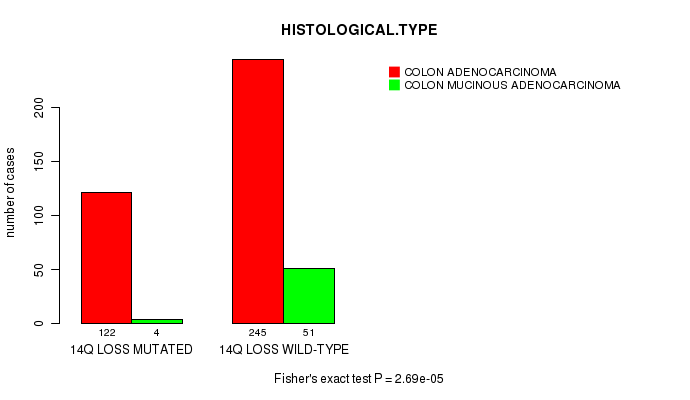
14q loss cnv correlated to 'HISTOLOGICAL.TYPE'.
-
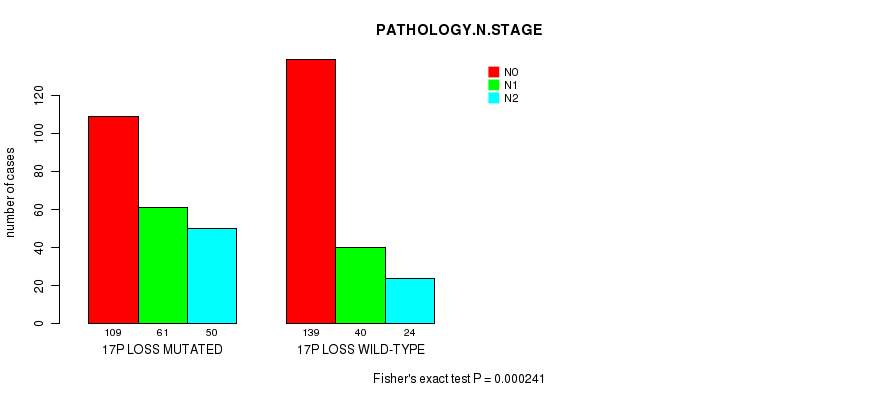
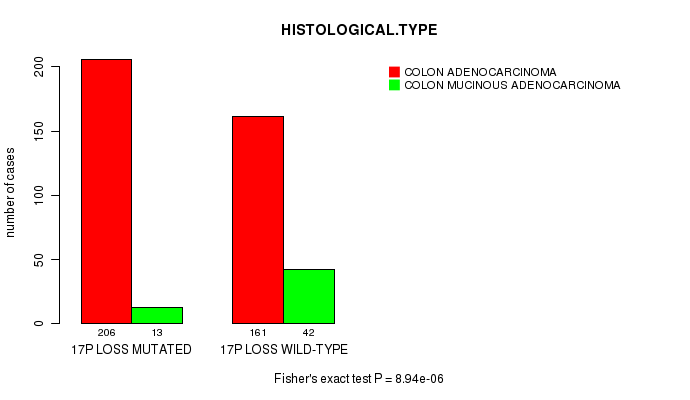
17p loss cnv correlated to 'PATHOLOGY.N.STAGE' and 'HISTOLOGICAL.TYPE'.
-
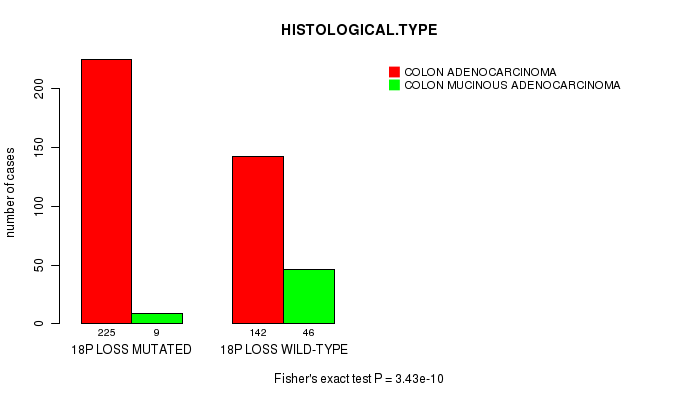
18p loss cnv correlated to 'HISTOLOGICAL.TYPE'.
-
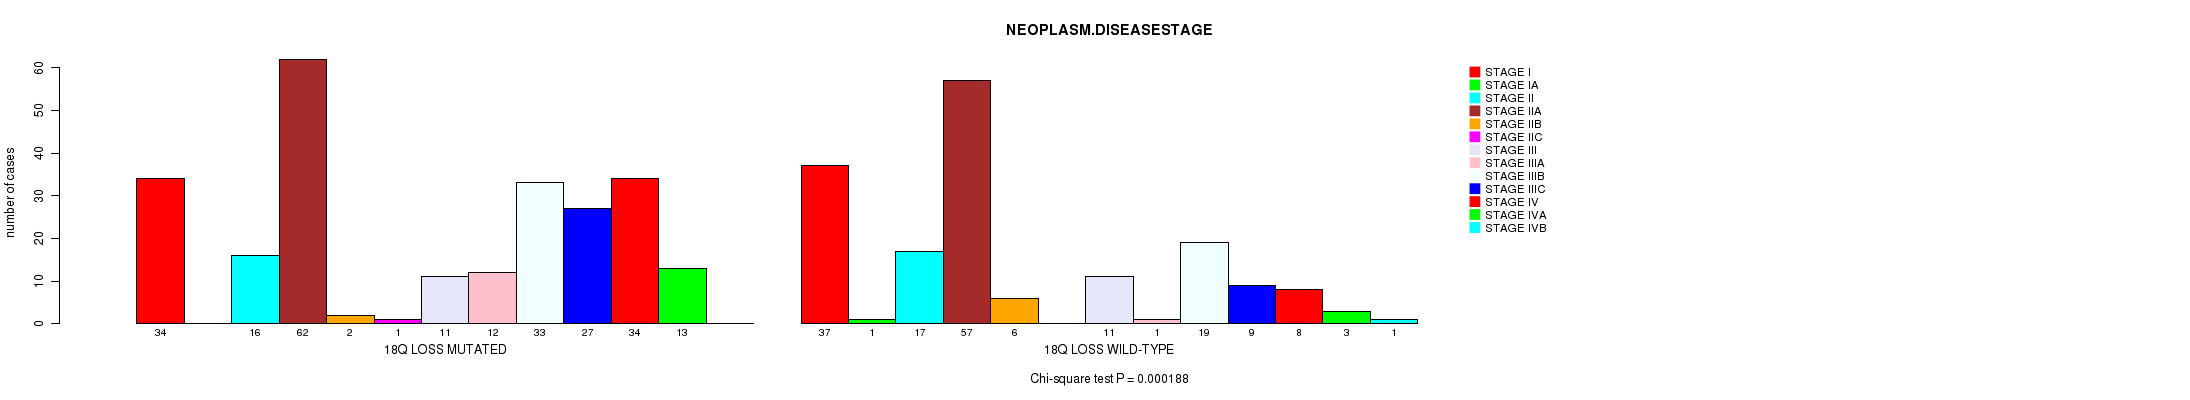
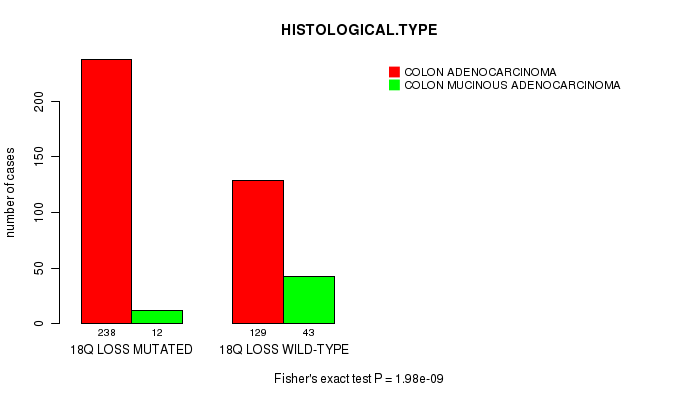
18q loss cnv correlated to 'NEOPLASM.DISEASESTAGE' and 'HISTOLOGICAL.TYPE'.
-
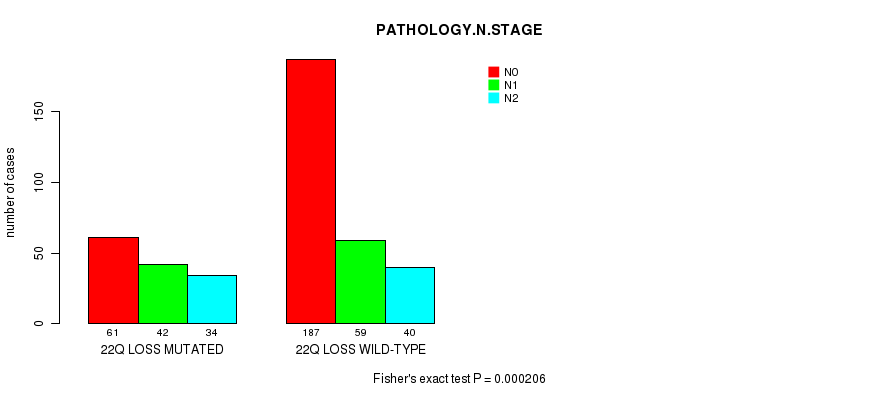
22q loss cnv correlated to 'PATHOLOGY.N.STAGE'.
Table 1. Get Full Table Overview of the association between significant copy number variation of 79 arm-level events and 11 clinical features. Shown in the table are P values (Q values). Thresholded by Q value < 0.25, 12 significant findings detected.
|
Clinical Features |
Time to Death |
AGE |
NEOPLASM DISEASESTAGE |
PATHOLOGY T STAGE |
PATHOLOGY N STAGE |
PATHOLOGY M STAGE |
GENDER |
HISTOLOGICAL TYPE |
RADIATIONS RADIATION REGIMENINDICATION |
COMPLETENESS OF RESECTION |
NUMBER OF LYMPH NODES |
||
| nCNV (%) | nWild-Type | logrank test | t-test | Chi-square test | Fisher's exact test | Fisher's exact test | Chi-square test | Fisher's exact test | Fisher's exact test | Fisher's exact test | Fisher's exact test | t-test | |
| 17p loss | 221 (52%) | 203 |
0.111 (1.00) |
0.106 (1.00) |
0.000339 (0.289) |
0.784 (1.00) |
0.000241 (0.207) |
0.0099 (1.00) |
0.0799 (1.00) |
8.94e-06 (0.00775) |
0.25 (1.00) |
0.0531 (1.00) |
0.00051 (0.434) |
| 18q loss | 251 (59%) | 173 |
0.681 (1.00) |
0.0614 (1.00) |
0.000188 (0.162) |
0.637 (1.00) |
0.000392 (0.335) |
0.00369 (1.00) |
0.553 (1.00) |
1.98e-09 (1.72e-06) |
0.274 (1.00) |
0.149 (1.00) |
0.0713 (1.00) |
| 7p gain | 232 (55%) | 192 |
0.693 (1.00) |
0.233 (1.00) |
0.000598 (0.508) |
0.325 (1.00) |
0.000258 (0.221) |
0.0257 (1.00) |
1 (1.00) |
0.0204 (1.00) |
0.255 (1.00) |
0.206 (1.00) |
0.0554 (1.00) |
| 12q gain | 80 (19%) | 344 |
0.931 (1.00) |
0.0409 (1.00) |
0.0199 (1.00) |
0.474 (1.00) |
0.0435 (1.00) |
0.0132 (1.00) |
0.901 (1.00) |
0.357 (1.00) |
1 (1.00) |
0.368 (1.00) |
0.000231 (0.198) |
| 13q gain | 244 (58%) | 180 |
0.454 (1.00) |
0.39 (1.00) |
0.00678 (1.00) |
0.98 (1.00) |
0.00545 (1.00) |
0.00471 (1.00) |
0.376 (1.00) |
1.56e-06 (0.00135) |
0.265 (1.00) |
0.0418 (1.00) |
0.685 (1.00) |
| 20q gain | 300 (71%) | 124 |
0.76 (1.00) |
0.262 (1.00) |
0.00211 (1.00) |
0.273 (1.00) |
0.0481 (1.00) |
0.00672 (1.00) |
0.394 (1.00) |
9.98e-06 (0.00863) |
0.559 (1.00) |
0.132 (1.00) |
0.0864 (1.00) |
| 4p loss | 126 (30%) | 298 |
0.0561 (1.00) |
0.987 (1.00) |
0.0013 (1.00) |
0.434 (1.00) |
0.00157 (1.00) |
0.000182 (0.157) |
0.832 (1.00) |
0.00722 (1.00) |
0.0258 (1.00) |
0.0315 (1.00) |
0.0122 (1.00) |
| 14q loss | 128 (30%) | 296 |
0.201 (1.00) |
0.487 (1.00) |
0.178 (1.00) |
0.352 (1.00) |
0.123 (1.00) |
0.0522 (1.00) |
1 (1.00) |
2.69e-05 (0.0233) |
0.557 (1.00) |
0.609 (1.00) |
0.886 (1.00) |
| 18p loss | 236 (56%) | 188 |
0.465 (1.00) |
0.0969 (1.00) |
0.000813 (0.686) |
0.853 (1.00) |
0.00392 (1.00) |
0.00124 (1.00) |
0.557 (1.00) |
3.43e-10 (2.98e-07) |
0.258 (1.00) |
0.0315 (1.00) |
0.027 (1.00) |
| 22q loss | 137 (32%) | 287 |
0.235 (1.00) |
0.888 (1.00) |
0.00191 (1.00) |
0.544 (1.00) |
0.000206 (0.178) |
0.00861 (1.00) |
1 (1.00) |
0.00187 (1.00) |
1 (1.00) |
0.422 (1.00) |
0.0137 (1.00) |
| 1p gain | 30 (7%) | 394 |
0.389 (1.00) |
0.589 (1.00) |
0.826 (1.00) |
1 (1.00) |
0.532 (1.00) |
0.173 (1.00) |
0.85 (1.00) |
0.782 (1.00) |
0.198 (1.00) |
0.111 (1.00) |
0.287 (1.00) |
| 1q gain | 75 (18%) | 349 |
0.971 (1.00) |
0.856 (1.00) |
0.123 (1.00) |
0.508 (1.00) |
0.142 (1.00) |
0.0053 (1.00) |
0.205 (1.00) |
0.348 (1.00) |
0.443 (1.00) |
0.224 (1.00) |
0.136 (1.00) |
| 2p gain | 73 (17%) | 351 |
0.399 (1.00) |
0.648 (1.00) |
0.334 (1.00) |
0.512 (1.00) |
0.333 (1.00) |
0.426 (1.00) |
0.608 (1.00) |
0.0353 (1.00) |
0.434 (1.00) |
0.055 (1.00) |
0.671 (1.00) |
| 2q gain | 69 (16%) | 355 |
0.205 (1.00) |
0.234 (1.00) |
0.173 (1.00) |
0.4 (1.00) |
0.122 (1.00) |
0.237 (1.00) |
0.793 (1.00) |
0.0517 (1.00) |
0.414 (1.00) |
0.112 (1.00) |
0.494 (1.00) |
| 3p gain | 42 (10%) | 382 |
0.327 (1.00) |
0.121 (1.00) |
0.000614 (0.521) |
0.803 (1.00) |
0.133 (1.00) |
0.000316 (0.271) |
1 (1.00) |
0.333 (1.00) |
1 (1.00) |
0.942 (1.00) |
0.173 (1.00) |
| 3q gain | 61 (14%) | 363 |
0.161 (1.00) |
0.23 (1.00) |
0.0171 (1.00) |
0.595 (1.00) |
0.0591 (1.00) |
0.00239 (1.00) |
0.68 (1.00) |
0.147 (1.00) |
1 (1.00) |
0.9 (1.00) |
0.198 (1.00) |
| 4p gain | 9 (2%) | 415 |
0.653 (1.00) |
0.76 (1.00) |
0.675 (1.00) |
0.724 (1.00) |
0.0385 (1.00) |
0.144 (1.00) |
0.512 (1.00) |
1 (1.00) |
1 (1.00) |
1 (1.00) |
0.352 (1.00) |
| 4q gain | 15 (4%) | 409 |
0.97 (1.00) |
0.48 (1.00) |
0.503 (1.00) |
0.894 (1.00) |
0.05 (1.00) |
0.43 (1.00) |
0.793 (1.00) |
0.704 (1.00) |
1 (1.00) |
0.474 (1.00) |
0.287 (1.00) |
| 5p gain | 62 (15%) | 362 |
0.903 (1.00) |
0.179 (1.00) |
0.277 (1.00) |
0.873 (1.00) |
0.107 (1.00) |
0.845 (1.00) |
0.171 (1.00) |
0.838 (1.00) |
1 (1.00) |
0.464 (1.00) |
0.308 (1.00) |
| 5q gain | 38 (9%) | 386 |
0.55 (1.00) |
0.906 (1.00) |
0.806 (1.00) |
1 (1.00) |
0.529 (1.00) |
0.958 (1.00) |
0.734 (1.00) |
0.451 (1.00) |
1 (1.00) |
0.397 (1.00) |
0.987 (1.00) |
| 6p gain | 78 (18%) | 346 |
0.233 (1.00) |
0.919 (1.00) |
0.255 (1.00) |
0.846 (1.00) |
0.0281 (1.00) |
0.766 (1.00) |
0.451 (1.00) |
0.188 (1.00) |
0.00603 (1.00) |
0.715 (1.00) |
0.0613 (1.00) |
| 6q gain | 71 (17%) | 353 |
0.299 (1.00) |
0.684 (1.00) |
0.157 (1.00) |
1 (1.00) |
0.0456 (1.00) |
0.6 (1.00) |
0.795 (1.00) |
0.123 (1.00) |
0.00453 (1.00) |
0.88 (1.00) |
0.106 (1.00) |
| 7q gain | 210 (50%) | 214 |
0.591 (1.00) |
0.151 (1.00) |
0.0258 (1.00) |
0.167 (1.00) |
0.0161 (1.00) |
0.0176 (1.00) |
1 (1.00) |
0.0428 (1.00) |
0.621 (1.00) |
0.346 (1.00) |
0.168 (1.00) |
| 8p gain | 121 (29%) | 303 |
0.523 (1.00) |
0.271 (1.00) |
0.678 (1.00) |
0.79 (1.00) |
0.435 (1.00) |
0.978 (1.00) |
0.748 (1.00) |
0.151 (1.00) |
0.197 (1.00) |
0.582 (1.00) |
0.479 (1.00) |
| 8q gain | 210 (50%) | 214 |
0.815 (1.00) |
0.101 (1.00) |
0.772 (1.00) |
0.207 (1.00) |
0.842 (1.00) |
0.513 (1.00) |
0.698 (1.00) |
0.0204 (1.00) |
0.121 (1.00) |
0.528 (1.00) |
0.692 (1.00) |
| 9p gain | 74 (17%) | 350 |
0.101 (1.00) |
0.451 (1.00) |
0.0302 (1.00) |
0.526 (1.00) |
0.071 (1.00) |
0.222 (1.00) |
1 (1.00) |
0.0557 (1.00) |
1 (1.00) |
0.742 (1.00) |
0.146 (1.00) |
| 9q gain | 65 (15%) | 359 |
0.171 (1.00) |
0.593 (1.00) |
0.164 (1.00) |
0.426 (1.00) |
0.251 (1.00) |
0.785 (1.00) |
0.787 (1.00) |
0.0742 (1.00) |
1 (1.00) |
0.835 (1.00) |
0.21 (1.00) |
| 10p gain | 32 (8%) | 392 |
0.139 (1.00) |
0.595 (1.00) |
0.796 (1.00) |
0.259 (1.00) |
0.042 (1.00) |
0.266 (1.00) |
0.854 (1.00) |
0.784 (1.00) |
1 (1.00) |
0.263 (1.00) |
0.0983 (1.00) |
| 10q gain | 18 (4%) | 406 |
0.617 (1.00) |
0.0511 (1.00) |
0.748 (1.00) |
0.878 (1.00) |
0.049 (1.00) |
0.458 (1.00) |
0.631 (1.00) |
0.717 (1.00) |
1 (1.00) |
0.556 (1.00) |
0.109 (1.00) |
| 11p gain | 49 (12%) | 375 |
0.864 (1.00) |
0.0136 (1.00) |
0.0441 (1.00) |
0.139 (1.00) |
0.0368 (1.00) |
0.033 (1.00) |
0.762 (1.00) |
0.00113 (0.951) |
0.0364 (1.00) |
0.231 (1.00) |
0.213 (1.00) |
| 11q gain | 47 (11%) | 377 |
0.78 (1.00) |
0.00113 (0.95) |
0.0509 (1.00) |
0.437 (1.00) |
0.0232 (1.00) |
0.0874 (1.00) |
0.759 (1.00) |
0.00193 (1.00) |
0.0336 (1.00) |
0.402 (1.00) |
0.279 (1.00) |
| 12p gain | 87 (21%) | 337 |
0.438 (1.00) |
0.0924 (1.00) |
0.138 (1.00) |
0.367 (1.00) |
0.252 (1.00) |
0.0799 (1.00) |
1 (1.00) |
0.858 (1.00) |
1 (1.00) |
0.579 (1.00) |
0.0682 (1.00) |
| 14q gain | 33 (8%) | 391 |
0.599 (1.00) |
0.936 (1.00) |
0.926 (1.00) |
0.904 (1.00) |
0.516 (1.00) |
0.00896 (1.00) |
0.468 (1.00) |
0.173 (1.00) |
1 (1.00) |
0.714 (1.00) |
0.37 (1.00) |
| 15q gain | 11 (3%) | 413 |
0.369 (1.00) |
0.336 (1.00) |
0.741 (1.00) |
0.387 (1.00) |
0.479 (1.00) |
0.122 (1.00) |
0.123 (1.00) |
1 (1.00) |
1 (1.00) |
0.0473 (1.00) |
0.517 (1.00) |
| 16p gain | 102 (24%) | 322 |
0.694 (1.00) |
0.132 (1.00) |
0.0121 (1.00) |
0.935 (1.00) |
0.00549 (1.00) |
0.428 (1.00) |
1 (1.00) |
0.00393 (1.00) |
0.563 (1.00) |
0.94 (1.00) |
0.153 (1.00) |
| 16q gain | 99 (23%) | 325 |
0.579 (1.00) |
0.0793 (1.00) |
0.00288 (1.00) |
0.968 (1.00) |
0.00459 (1.00) |
0.465 (1.00) |
0.73 (1.00) |
0.00599 (1.00) |
0.551 (1.00) |
0.754 (1.00) |
0.221 (1.00) |
| 17p gain | 24 (6%) | 400 |
0.126 (1.00) |
0.985 (1.00) |
0.761 (1.00) |
0.716 (1.00) |
0.299 (1.00) |
0.0711 (1.00) |
0.834 (1.00) |
1 (1.00) |
1 (1.00) |
0.892 (1.00) |
0.656 (1.00) |
| 17q gain | 74 (17%) | 350 |
0.359 (1.00) |
0.346 (1.00) |
0.169 (1.00) |
0.332 (1.00) |
0.149 (1.00) |
0.00382 (1.00) |
0.798 (1.00) |
0.25 (1.00) |
0.438 (1.00) |
0.303 (1.00) |
0.425 (1.00) |
| 18p gain | 22 (5%) | 402 |
0.995 (1.00) |
0.362 (1.00) |
0.00898 (1.00) |
0.879 (1.00) |
0.0778 (1.00) |
0.000503 (0.429) |
0.383 (1.00) |
0.0155 (1.00) |
1 (1.00) |
0.668 (1.00) |
0.137 (1.00) |
| 18q gain | 14 (3%) | 410 |
0.417 (1.00) |
0.0298 (1.00) |
0.771 (1.00) |
0.575 (1.00) |
0.24 (1.00) |
0.957 (1.00) |
0.431 (1.00) |
0.0249 (1.00) |
1 (1.00) |
1 (1.00) |
0.813 (1.00) |
| 19p gain | 66 (16%) | 358 |
0.268 (1.00) |
0.642 (1.00) |
0.591 (1.00) |
0.496 (1.00) |
0.0491 (1.00) |
0.0307 (1.00) |
0.0437 (1.00) |
0.169 (1.00) |
0.399 (1.00) |
0.276 (1.00) |
0.217 (1.00) |
| 19q gain | 75 (18%) | 349 |
0.31 (1.00) |
0.813 (1.00) |
0.851 (1.00) |
0.887 (1.00) |
0.121 (1.00) |
0.0151 (1.00) |
0.128 (1.00) |
0.852 (1.00) |
0.443 (1.00) |
0.47 (1.00) |
0.847 (1.00) |
| 20p gain | 228 (54%) | 196 |
0.34 (1.00) |
0.417 (1.00) |
0.000625 (0.529) |
0.905 (1.00) |
0.194 (1.00) |
0.00145 (1.00) |
0.118 (1.00) |
0.000424 (0.362) |
0.253 (1.00) |
0.0768 (1.00) |
0.275 (1.00) |
| 21q gain | 20 (5%) | 404 |
0.125 (1.00) |
0.000953 (0.802) |
0.57 (1.00) |
0.121 (1.00) |
0.406 (1.00) |
0.69 (1.00) |
0.821 (1.00) |
0.725 (1.00) |
1 (1.00) |
0.474 (1.00) |
0.807 (1.00) |
| 22q gain | 10 (2%) | 414 |
0.611 (1.00) |
0.989 (1.00) |
0.617 (1.00) |
0.32 (1.00) |
0.822 (1.00) |
0.402 (1.00) |
1 (1.00) |
0.373 (1.00) |
1 (1.00) |
0.295 (1.00) |
0.443 (1.00) |
| xq gain | 68 (16%) | 356 |
0.972 (1.00) |
0.583 (1.00) |
0.148 (1.00) |
0.0327 (1.00) |
0.456 (1.00) |
0.148 (1.00) |
0.597 (1.00) |
0.327 (1.00) |
0.409 (1.00) |
0.913 (1.00) |
0.995 (1.00) |
| 1p loss | 91 (21%) | 333 |
0.0351 (1.00) |
0.929 (1.00) |
0.0841 (1.00) |
0.743 (1.00) |
0.00294 (1.00) |
0.0123 (1.00) |
0.636 (1.00) |
0.219 (1.00) |
1 (1.00) |
0.502 (1.00) |
0.0145 (1.00) |
| 1q loss | 52 (12%) | 372 |
0.161 (1.00) |
0.587 (1.00) |
0.298 (1.00) |
0.734 (1.00) |
0.0757 (1.00) |
0.163 (1.00) |
0.375 (1.00) |
0.516 (1.00) |
1 (1.00) |
0.501 (1.00) |
0.163 (1.00) |
| 2p loss | 6 (1%) | 418 |
0.00089 (0.75) |
0.761 (1.00) |
0.708 (1.00) |
0.839 (1.00) |
0.85 (1.00) |
0.755 (1.00) |
0.222 (1.00) |
1 (1.00) |
1 (1.00) |
1 (1.00) |
0.806 (1.00) |
| 2q loss | 7 (2%) | 417 |
0.00089 (0.75) |
0.752 (1.00) |
0.759 (1.00) |
0.871 (1.00) |
1 (1.00) |
0.696 (1.00) |
0.128 (1.00) |
0.602 (1.00) |
1 (1.00) |
1 (1.00) |
0.536 (1.00) |
| 3p loss | 50 (12%) | 374 |
0.0962 (1.00) |
0.657 (1.00) |
0.49 (1.00) |
0.166 (1.00) |
0.14 (1.00) |
0.0464 (1.00) |
0.653 (1.00) |
0.37 (1.00) |
1 (1.00) |
0.846 (1.00) |
0.682 (1.00) |
| 3q loss | 31 (7%) | 393 |
0.149 (1.00) |
0.315 (1.00) |
0.84 (1.00) |
0.488 (1.00) |
0.933 (1.00) |
0.203 (1.00) |
0.709 (1.00) |
0.783 (1.00) |
1 (1.00) |
0.933 (1.00) |
0.258 (1.00) |
| 4q loss | 114 (27%) | 310 |
0.0281 (1.00) |
0.894 (1.00) |
0.016 (1.00) |
0.593 (1.00) |
0.00191 (1.00) |
0.0356 (1.00) |
0.443 (1.00) |
0.0722 (1.00) |
0.0191 (1.00) |
0.348 (1.00) |
0.0266 (1.00) |
| 5p loss | 54 (13%) | 370 |
0.908 (1.00) |
0.288 (1.00) |
0.00949 (1.00) |
0.312 (1.00) |
0.00623 (1.00) |
0.0892 (1.00) |
1 (1.00) |
0.277 (1.00) |
0.0439 (1.00) |
0.529 (1.00) |
0.0612 (1.00) |
| 5q loss | 74 (17%) | 350 |
0.244 (1.00) |
0.26 (1.00) |
0.0465 (1.00) |
0.828 (1.00) |
0.000587 (0.499) |
0.0639 (1.00) |
0.525 (1.00) |
0.446 (1.00) |
0.0801 (1.00) |
0.669 (1.00) |
0.00558 (1.00) |
| 6p loss | 33 (8%) | 391 |
0.323 (1.00) |
0.368 (1.00) |
0.962 (1.00) |
0.103 (1.00) |
0.744 (1.00) |
0.227 (1.00) |
0.468 (1.00) |
0.786 (1.00) |
1 (1.00) |
0.123 (1.00) |
0.779 (1.00) |
| 6q loss | 44 (10%) | 380 |
0.171 (1.00) |
0.946 (1.00) |
0.406 (1.00) |
0.321 (1.00) |
0.167 (1.00) |
0.00771 (1.00) |
0.636 (1.00) |
0.487 (1.00) |
1 (1.00) |
0.171 (1.00) |
0.0917 (1.00) |
| 7q loss | 3 (1%) | 421 |
0.571 (1.00) |
0.13 (1.00) |
0.416 (1.00) |
0.679 (1.00) |
1 (1.00) |
0.919 (1.00) |
0.601 (1.00) |
1 (1.00) |
1 (1.00) |
1 (1.00) |
0.0114 (1.00) |
| 8p loss | 133 (31%) | 291 |
0.802 (1.00) |
0.771 (1.00) |
0.0131 (1.00) |
0.151 (1.00) |
0.000334 (0.286) |
0.00677 (1.00) |
0.21 (1.00) |
0.12 (1.00) |
1 (1.00) |
0.0737 (1.00) |
0.00569 (1.00) |
| 8q loss | 23 (5%) | 401 |
0.676 (1.00) |
0.898 (1.00) |
0.104 (1.00) |
0.0504 (1.00) |
0.0478 (1.00) |
0.0307 (1.00) |
0.523 (1.00) |
0.522 (1.00) |
1 (1.00) |
0.88 (1.00) |
0.194 (1.00) |
| 9p loss | 49 (12%) | 375 |
0.13 (1.00) |
0.207 (1.00) |
0.982 (1.00) |
0.2 (1.00) |
0.49 (1.00) |
0.651 (1.00) |
0.447 (1.00) |
0.0672 (1.00) |
1 (1.00) |
0.504 (1.00) |
0.53 (1.00) |
| 9q loss | 49 (12%) | 375 |
0.0671 (1.00) |
0.0302 (1.00) |
0.824 (1.00) |
0.252 (1.00) |
0.198 (1.00) |
0.301 (1.00) |
1 (1.00) |
0.0657 (1.00) |
1 (1.00) |
0.504 (1.00) |
0.62 (1.00) |
| 10p loss | 64 (15%) | 360 |
0.669 (1.00) |
0.227 (1.00) |
0.0379 (1.00) |
0.896 (1.00) |
0.0848 (1.00) |
0.109 (1.00) |
0.787 (1.00) |
0.227 (1.00) |
0.0608 (1.00) |
0.478 (1.00) |
0.393 (1.00) |
| 10q loss | 68 (16%) | 356 |
0.508 (1.00) |
0.149 (1.00) |
0.15 (1.00) |
0.927 (1.00) |
0.225 (1.00) |
0.284 (1.00) |
0.791 (1.00) |
0.168 (1.00) |
0.0683 (1.00) |
0.231 (1.00) |
0.651 (1.00) |
| 11p loss | 49 (12%) | 375 |
0.295 (1.00) |
0.904 (1.00) |
0.815 (1.00) |
0.892 (1.00) |
0.107 (1.00) |
0.0518 (1.00) |
0.649 (1.00) |
0.821 (1.00) |
1 (1.00) |
0.458 (1.00) |
0.146 (1.00) |
| 11q loss | 59 (14%) | 365 |
0.34 (1.00) |
0.737 (1.00) |
0.448 (1.00) |
0.222 (1.00) |
0.074 (1.00) |
0.0397 (1.00) |
0.779 (1.00) |
1 (1.00) |
1 (1.00) |
0.433 (1.00) |
0.302 (1.00) |
| 12p loss | 44 (10%) | 380 |
0.291 (1.00) |
0.464 (1.00) |
0.394 (1.00) |
0.559 (1.00) |
0.0782 (1.00) |
0.464 (1.00) |
1 (1.00) |
0.0184 (1.00) |
0.281 (1.00) |
0.949 (1.00) |
0.396 (1.00) |
| 12q loss | 47 (11%) | 377 |
0.482 (1.00) |
0.44 (1.00) |
0.196 (1.00) |
0.576 (1.00) |
0.0471 (1.00) |
0.347 (1.00) |
0.539 (1.00) |
0.0652 (1.00) |
1 (1.00) |
0.871 (1.00) |
0.312 (1.00) |
| 13q loss | 11 (3%) | 413 |
0.816 (1.00) |
0.893 (1.00) |
0.623 (1.00) |
0.466 (1.00) |
0.0206 (1.00) |
0.703 (1.00) |
1 (1.00) |
0.129 (1.00) |
1 (1.00) |
0.764 (1.00) |
0.144 (1.00) |
| 15q loss | 144 (34%) | 280 |
0.48 (1.00) |
0.864 (1.00) |
0.054 (1.00) |
0.525 (1.00) |
0.0342 (1.00) |
0.0129 (1.00) |
1 (1.00) |
0.00908 (1.00) |
0.0386 (1.00) |
0.398 (1.00) |
0.375 (1.00) |
| 16p loss | 27 (6%) | 397 |
0.0311 (1.00) |
0.34 (1.00) |
0.536 (1.00) |
0.692 (1.00) |
0.453 (1.00) |
0.661 (1.00) |
0.426 (1.00) |
0.375 (1.00) |
1 (1.00) |
0.19 (1.00) |
0.94 (1.00) |
| 16q loss | 25 (6%) | 399 |
0.048 (1.00) |
0.16 (1.00) |
0.589 (1.00) |
0.898 (1.00) |
0.426 (1.00) |
0.641 (1.00) |
0.681 (1.00) |
0.552 (1.00) |
1 (1.00) |
0.261 (1.00) |
0.675 (1.00) |
| 17q loss | 61 (14%) | 363 |
0.963 (1.00) |
0.447 (1.00) |
0.0245 (1.00) |
0.341 (1.00) |
0.00851 (1.00) |
0.0928 (1.00) |
0.406 (1.00) |
0.838 (1.00) |
1 (1.00) |
0.681 (1.00) |
0.0429 (1.00) |
| 19p loss | 38 (9%) | 386 |
0.501 (1.00) |
0.351 (1.00) |
0.00275 (1.00) |
1 (1.00) |
0.00141 (1.00) |
0.000669 (0.566) |
0.734 (1.00) |
0.607 (1.00) |
0.246 (1.00) |
0.24 (1.00) |
0.00281 (1.00) |
| 19q loss | 32 (8%) | 392 |
0.521 (1.00) |
0.778 (1.00) |
0.00334 (1.00) |
0.965 (1.00) |
0.00428 (1.00) |
0.000714 (0.603) |
0.467 (1.00) |
0.58 (1.00) |
0.21 (1.00) |
0.432 (1.00) |
0.00869 (1.00) |
| 20p loss | 43 (10%) | 381 |
0.818 (1.00) |
0.88 (1.00) |
0.267 (1.00) |
0.804 (1.00) |
0.609 (1.00) |
0.897 (1.00) |
0.629 (1.00) |
1 (1.00) |
1 (1.00) |
1 (1.00) |
0.207 (1.00) |
| 20q loss | 6 (1%) | 418 |
0.107 (1.00) |
0.0247 (1.00) |
0.87 (1.00) |
0.5 (1.00) |
0.312 (1.00) |
0.882 (1.00) |
0.689 (1.00) |
1 (1.00) |
1 (1.00) |
1 (1.00) |
0.905 (1.00) |
| 21q loss | 116 (27%) | 308 |
0.75 (1.00) |
0.923 (1.00) |
0.428 (1.00) |
0.508 (1.00) |
0.0167 (1.00) |
0.128 (1.00) |
0.913 (1.00) |
0.0228 (1.00) |
1 (1.00) |
0.78 (1.00) |
0.0131 (1.00) |
| xq loss | 46 (11%) | 378 |
0.824 (1.00) |
0.373 (1.00) |
0.296 (1.00) |
0.604 (1.00) |
0.0515 (1.00) |
0.125 (1.00) |
0.532 (1.00) |
0.818 (1.00) |
1 (1.00) |
0.52 (1.00) |
0.189 (1.00) |
P value = 0.000258 (Fisher's exact test), Q value = 0.22
Table S1. Gene #13: '7p gain' versus Clinical Feature #5: 'PATHOLOGY.N.STAGE'
| nPatients | N0 | N1 | N2 |
|---|---|---|---|
| ALL | 248 | 101 | 74 |
| 7P GAIN MUTATED | 115 | 68 | 48 |
| 7P GAIN WILD-TYPE | 133 | 33 | 26 |
Figure S1. Get High-res Image Gene #13: '7p gain' versus Clinical Feature #5: 'PATHOLOGY.N.STAGE'
P value = 0.000231 (t-test), Q value = 0.2
Table S2. Gene #24: '12q gain' versus Clinical Feature #11: 'NUMBER.OF.LYMPH.NODES'
| nPatients | Mean (Std.Dev) | |
|---|---|---|
| ALL | 400 | 2.0 (4.5) |
| 12Q GAIN MUTATED | 76 | 1.0 (1.9) |
| 12Q GAIN WILD-TYPE | 324 | 2.3 (4.8) |
Figure S2. Get High-res Image Gene #24: '12q gain' versus Clinical Feature #11: 'NUMBER.OF.LYMPH.NODES'
P value = 1.56e-06 (Fisher's exact test), Q value = 0.0014
Table S3. Gene #25: '13q gain' versus Clinical Feature #8: 'HISTOLOGICAL.TYPE'
| nPatients | COLON ADENOCARCINOMA | COLON MUCINOUS ADENOCARCINOMA |
|---|---|---|
| ALL | 367 | 55 |
| 13Q GAIN MUTATED | 228 | 15 |
| 13Q GAIN WILD-TYPE | 139 | 40 |
Figure S3. Get High-res Image Gene #25: '13q gain' versus Clinical Feature #8: 'HISTOLOGICAL.TYPE'
P value = 9.98e-06 (Fisher's exact test), Q value = 0.0086
Table S4. Gene #37: '20q gain' versus Clinical Feature #8: 'HISTOLOGICAL.TYPE'
| nPatients | COLON ADENOCARCINOMA | COLON MUCINOUS ADENOCARCINOMA |
|---|---|---|
| ALL | 367 | 55 |
| 20Q GAIN MUTATED | 274 | 24 |
| 20Q GAIN WILD-TYPE | 93 | 31 |
Figure S4. Get High-res Image Gene #37: '20q gain' versus Clinical Feature #8: 'HISTOLOGICAL.TYPE'
P value = 0.000182 (Chi-square test), Q value = 0.16
Table S5. Gene #47: '4p loss' versus Clinical Feature #6: 'PATHOLOGY.M.STAGE'
| nPatients | M0 | M1 | M1A | M1B | MX |
|---|---|---|---|---|---|
| ALL | 318 | 50 | 7 | 1 | 41 |
| 4P LOSS MUTATED | 77 | 27 | 3 | 1 | 14 |
| 4P LOSS WILD-TYPE | 241 | 23 | 4 | 0 | 27 |
Figure S5. Get High-res Image Gene #47: '4p loss' versus Clinical Feature #6: 'PATHOLOGY.M.STAGE'
P value = 2.69e-05 (Fisher's exact test), Q value = 0.023
Table S6. Gene #65: '14q loss' versus Clinical Feature #8: 'HISTOLOGICAL.TYPE'
| nPatients | COLON ADENOCARCINOMA | COLON MUCINOUS ADENOCARCINOMA |
|---|---|---|
| ALL | 367 | 55 |
| 14Q LOSS MUTATED | 122 | 4 |
| 14Q LOSS WILD-TYPE | 245 | 51 |
Figure S6. Get High-res Image Gene #65: '14q loss' versus Clinical Feature #8: 'HISTOLOGICAL.TYPE'
P value = 0.000241 (Fisher's exact test), Q value = 0.21
Table S7. Gene #69: '17p loss' versus Clinical Feature #5: 'PATHOLOGY.N.STAGE'
| nPatients | N0 | N1 | N2 |
|---|---|---|---|
| ALL | 248 | 101 | 74 |
| 17P LOSS MUTATED | 109 | 61 | 50 |
| 17P LOSS WILD-TYPE | 139 | 40 | 24 |
Figure S7. Get High-res Image Gene #69: '17p loss' versus Clinical Feature #5: 'PATHOLOGY.N.STAGE'
P value = 8.94e-06 (Fisher's exact test), Q value = 0.0077
Table S8. Gene #69: '17p loss' versus Clinical Feature #8: 'HISTOLOGICAL.TYPE'
| nPatients | COLON ADENOCARCINOMA | COLON MUCINOUS ADENOCARCINOMA |
|---|---|---|
| ALL | 367 | 55 |
| 17P LOSS MUTATED | 206 | 13 |
| 17P LOSS WILD-TYPE | 161 | 42 |
Figure S8. Get High-res Image Gene #69: '17p loss' versus Clinical Feature #8: 'HISTOLOGICAL.TYPE'
P value = 3.43e-10 (Fisher's exact test), Q value = 3e-07
Table S9. Gene #71: '18p loss' versus Clinical Feature #8: 'HISTOLOGICAL.TYPE'
| nPatients | COLON ADENOCARCINOMA | COLON MUCINOUS ADENOCARCINOMA |
|---|---|---|
| ALL | 367 | 55 |
| 18P LOSS MUTATED | 225 | 9 |
| 18P LOSS WILD-TYPE | 142 | 46 |
Figure S9. Get High-res Image Gene #71: '18p loss' versus Clinical Feature #8: 'HISTOLOGICAL.TYPE'
P value = 0.000188 (Chi-square test), Q value = 0.16
Table S10. Gene #72: '18q loss' versus Clinical Feature #3: 'NEOPLASM.DISEASESTAGE'
| nPatients | STAGE I | STAGE IA | STAGE II | STAGE IIA | STAGE IIB | STAGE IIC | STAGE III | STAGE IIIA | STAGE IIIB | STAGE IIIC | STAGE IV | STAGE IVA | STAGE IVB |
|---|---|---|---|---|---|---|---|---|---|---|---|---|---|
| ALL | 71 | 1 | 33 | 119 | 8 | 1 | 22 | 13 | 52 | 36 | 42 | 16 | 1 |
| 18Q LOSS MUTATED | 34 | 0 | 16 | 62 | 2 | 1 | 11 | 12 | 33 | 27 | 34 | 13 | 0 |
| 18Q LOSS WILD-TYPE | 37 | 1 | 17 | 57 | 6 | 0 | 11 | 1 | 19 | 9 | 8 | 3 | 1 |
Figure S10. Get High-res Image Gene #72: '18q loss' versus Clinical Feature #3: 'NEOPLASM.DISEASESTAGE'
P value = 1.98e-09 (Fisher's exact test), Q value = 1.7e-06
Table S11. Gene #72: '18q loss' versus Clinical Feature #8: 'HISTOLOGICAL.TYPE'
| nPatients | COLON ADENOCARCINOMA | COLON MUCINOUS ADENOCARCINOMA |
|---|---|---|
| ALL | 367 | 55 |
| 18Q LOSS MUTATED | 238 | 12 |
| 18Q LOSS WILD-TYPE | 129 | 43 |
Figure S11. Get High-res Image Gene #72: '18q loss' versus Clinical Feature #8: 'HISTOLOGICAL.TYPE'
P value = 0.000206 (Fisher's exact test), Q value = 0.18
Table S12. Gene #78: '22q loss' versus Clinical Feature #5: 'PATHOLOGY.N.STAGE'
| nPatients | N0 | N1 | N2 |
|---|---|---|---|
| ALL | 248 | 101 | 74 |
| 22Q LOSS MUTATED | 61 | 42 | 34 |
| 22Q LOSS WILD-TYPE | 187 | 59 | 40 |
Figure S12. Get High-res Image Gene #78: '22q loss' versus Clinical Feature #5: 'PATHOLOGY.N.STAGE'
-
Copy number data file = transformed.cor.cli.txt
-
Clinical data file = COAD-TP.merged_data.txt
-
Number of patients = 424
-
Number of significantly arm-level cnvs = 79
-
Number of selected clinical features = 11
-
Exclude regions that fewer than K tumors have mutations, K = 3
For survival clinical features, the Kaplan-Meier survival curves of tumors with and without gene mutations were plotted and the statistical significance P values were estimated by logrank test (Bland and Altman 2004) using the 'survdiff' function in R
For continuous numerical clinical features, two-tailed Student's t test with unequal variance (Lehmann and Romano 2005) was applied to compare the clinical values between tumors with and without gene mutations using 't.test' function in R
For multi-class clinical features (nominal or ordinal), Chi-square tests (Greenwood and Nikulin 1996) were used to estimate the P values using the 'chisq.test' function in R
For binary or multi-class clinical features (nominal or ordinal), two-tailed Fisher's exact tests (Fisher 1922) were used to estimate the P values using the 'fisher.test' function in R
For multiple hypothesis correction, Q value is the False Discovery Rate (FDR) analogue of the P value (Benjamini and Hochberg 1995), defined as the minimum FDR at which the test may be called significant. We used the 'Benjamini and Hochberg' method of 'p.adjust' function in R to convert P values into Q values.
In addition to the links below, the full results of the analysis summarized in this report can also be downloaded programmatically using firehose_get, or interactively from either the Broad GDAC website or TCGA Data Coordination Center Portal.