This pipeline computes the correlation between significant arm-level copy number variations (cnvs) and molecular subtypes.
Testing the association between copy number variation 80 arm-level events and 6 molecular subtypes across 73 patients, one significant finding detected with P value < 0.05 and Q value < 0.25.
-
3q gain cnv correlated to 'CN_CNMF'.
Table 1. Get Full Table Overview of the association between significant copy number variation of 80 arm-level events and 6 molecular subtypes. Shown in the table are P values (Q values). Thresholded by P value < 0.05 and Q value < 0.25, one significant finding detected.
|
Clinical Features |
CN CNMF |
METHLYATION CNMF |
MIRSEQ CNMF |
MIRSEQ CHIERARCHICAL |
MIRSEQ MATURE CNMF |
MIRSEQ MATURE CHIERARCHICAL |
||
| nCNV (%) | nWild-Type | Fisher's exact test | Fisher's exact test | Fisher's exact test | Fisher's exact test | Fisher's exact test | Fisher's exact test | |
| 3q gain | 33 (45%) | 40 |
3.62e-05 (0.0174) |
0.00164 (0.777) |
0.00479 (1.00) |
0.00687 (1.00) |
0.0517 (1.00) |
0.00687 (1.00) |
| 1p gain | 10 (14%) | 63 |
0.905 (1.00) |
0.616 (1.00) |
0.365 (1.00) |
0.394 (1.00) |
0.00746 (1.00) |
0.394 (1.00) |
| 1q gain | 25 (34%) | 48 |
0.668 (1.00) |
0.246 (1.00) |
0.0775 (1.00) |
0.0309 (1.00) |
0.0193 (1.00) |
0.0309 (1.00) |
| 2p gain | 29 (40%) | 44 |
0.16 (1.00) |
0.389 (1.00) |
0.116 (1.00) |
0.689 (1.00) |
0.00928 (1.00) |
0.689 (1.00) |
| 2q gain | 18 (25%) | 55 |
0.728 (1.00) |
0.557 (1.00) |
0.673 (1.00) |
0.688 (1.00) |
0.0647 (1.00) |
0.688 (1.00) |
| 3p gain | 11 (15%) | 62 |
0.0639 (1.00) |
0.22 (1.00) |
0.101 (1.00) |
0.306 (1.00) |
0.0533 (1.00) |
0.306 (1.00) |
| 4p gain | 6 (8%) | 67 |
0.854 (1.00) |
1 (1.00) |
0.735 (1.00) |
1 (1.00) |
1 (1.00) |
1 (1.00) |
| 4q gain | 5 (7%) | 68 |
0.101 (1.00) |
0.845 (1.00) |
0.412 (1.00) |
0.667 (1.00) |
0.791 (1.00) |
0.667 (1.00) |
| 5p gain | 33 (45%) | 40 |
0.557 (1.00) |
0.732 (1.00) |
0.293 (1.00) |
0.375 (1.00) |
0.36 (1.00) |
0.375 (1.00) |
| 5q gain | 10 (14%) | 63 |
0.822 (1.00) |
0.822 (1.00) |
0.749 (1.00) |
0.57 (1.00) |
1 (1.00) |
0.57 (1.00) |
| 6p gain | 9 (12%) | 64 |
0.811 (1.00) |
0.898 (1.00) |
0.904 (1.00) |
0.765 (1.00) |
0.679 (1.00) |
0.765 (1.00) |
| 6q gain | 8 (11%) | 65 |
0.309 (1.00) |
0.389 (1.00) |
1 (1.00) |
1 (1.00) |
1 (1.00) |
1 (1.00) |
| 7p gain | 47 (64%) | 26 |
0.628 (1.00) |
1 (1.00) |
0.883 (1.00) |
0.541 (1.00) |
0.717 (1.00) |
0.541 (1.00) |
| 7q gain | 34 (47%) | 39 |
0.18 (1.00) |
0.612 (1.00) |
0.527 (1.00) |
0.375 (1.00) |
0.358 (1.00) |
0.375 (1.00) |
| 8p gain | 29 (40%) | 44 |
0.156 (1.00) |
0.241 (1.00) |
0.932 (1.00) |
1 (1.00) |
0.968 (1.00) |
1 (1.00) |
| 8q gain | 41 (56%) | 32 |
0.118 (1.00) |
0.259 (1.00) |
0.669 (1.00) |
0.321 (1.00) |
0.667 (1.00) |
0.321 (1.00) |
| 9p gain | 7 (10%) | 66 |
0.0423 (1.00) |
0.519 (1.00) |
0.419 (1.00) |
0.443 (1.00) |
0.39 (1.00) |
0.443 (1.00) |
| 9q gain | 17 (23%) | 56 |
0.0512 (1.00) |
0.52 (1.00) |
0.439 (1.00) |
0.58 (1.00) |
0.649 (1.00) |
0.58 (1.00) |
| 10p gain | 14 (19%) | 59 |
0.46 (1.00) |
0.385 (1.00) |
0.0902 (1.00) |
0.764 (1.00) |
0.217 (1.00) |
0.764 (1.00) |
| 10q gain | 9 (12%) | 64 |
0.335 (1.00) |
0.523 (1.00) |
0.132 (1.00) |
0.525 (1.00) |
0.094 (1.00) |
0.525 (1.00) |
| 11p gain | 15 (21%) | 58 |
0.285 (1.00) |
1 (1.00) |
0.513 (1.00) |
0.48 (1.00) |
0.518 (1.00) |
0.48 (1.00) |
| 11q gain | 13 (18%) | 60 |
0.723 (1.00) |
0.619 (1.00) |
0.206 (1.00) |
0.198 (1.00) |
0.451 (1.00) |
0.198 (1.00) |
| 12p gain | 31 (42%) | 42 |
0.00761 (1.00) |
0.0137 (1.00) |
0.0123 (1.00) |
0.00479 (1.00) |
0.0656 (1.00) |
0.00479 (1.00) |
| 12q gain | 18 (25%) | 55 |
0.131 (1.00) |
0.0516 (1.00) |
0.239 (1.00) |
0.336 (1.00) |
0.51 (1.00) |
0.336 (1.00) |
| 13q gain | 15 (21%) | 58 |
0.000531 (0.254) |
0.00413 (1.00) |
0.00139 (0.661) |
0.000595 (0.284) |
0.00204 (0.96) |
0.000595 (0.284) |
| 14q gain | 22 (30%) | 51 |
0.437 (1.00) |
0.388 (1.00) |
0.469 (1.00) |
0.457 (1.00) |
0.238 (1.00) |
0.457 (1.00) |
| 15q gain | 12 (16%) | 61 |
0.778 (1.00) |
0.091 (1.00) |
0.188 (1.00) |
0.601 (1.00) |
0.768 (1.00) |
0.601 (1.00) |
| 16p gain | 16 (22%) | 57 |
0.903 (1.00) |
0.134 (1.00) |
0.158 (1.00) |
0.105 (1.00) |
0.111 (1.00) |
0.105 (1.00) |
| 16q gain | 13 (18%) | 60 |
0.247 (1.00) |
0.0837 (1.00) |
0.0749 (1.00) |
0.104 (1.00) |
0.0297 (1.00) |
0.104 (1.00) |
| 17p gain | 15 (21%) | 58 |
0.0882 (1.00) |
0.198 (1.00) |
0.759 (1.00) |
1 (1.00) |
0.853 (1.00) |
1 (1.00) |
| 17q gain | 21 (29%) | 52 |
0.898 (1.00) |
0.677 (1.00) |
0.352 (1.00) |
0.46 (1.00) |
0.749 (1.00) |
0.46 (1.00) |
| 18p gain | 24 (33%) | 49 |
0.0442 (1.00) |
0.268 (1.00) |
0.447 (1.00) |
0.517 (1.00) |
0.405 (1.00) |
0.517 (1.00) |
| 18q gain | 9 (12%) | 64 |
0.335 (1.00) |
0.652 (1.00) |
0.812 (1.00) |
0.765 (1.00) |
0.956 (1.00) |
0.765 (1.00) |
| 19p gain | 11 (15%) | 62 |
0.00598 (1.00) |
0.913 (1.00) |
0.749 (1.00) |
0.57 (1.00) |
0.341 (1.00) |
0.57 (1.00) |
| 19q gain | 15 (21%) | 58 |
0.00174 (0.82) |
0.2 (1.00) |
0.0536 (1.00) |
0.0301 (1.00) |
0.0266 (1.00) |
0.0301 (1.00) |
| 20p gain | 39 (53%) | 34 |
0.852 (1.00) |
0.746 (1.00) |
0.658 (1.00) |
0.615 (1.00) |
0.7 (1.00) |
0.615 (1.00) |
| 20q gain | 42 (58%) | 31 |
0.246 (1.00) |
0.1 (1.00) |
0.12 (1.00) |
0.0516 (1.00) |
0.335 (1.00) |
0.0516 (1.00) |
| 21q gain | 8 (11%) | 65 |
0.795 (1.00) |
0.701 (1.00) |
0.775 (1.00) |
0.726 (1.00) |
0.108 (1.00) |
0.726 (1.00) |
| 22q gain | 17 (23%) | 56 |
0.0108 (1.00) |
0.00246 (1.00) |
0.00202 (0.954) |
0.0011 (0.521) |
0.00966 (1.00) |
0.0011 (0.521) |
| xq gain | 17 (23%) | 56 |
0.26 (1.00) |
0.323 (1.00) |
0.445 (1.00) |
0.37 (1.00) |
0.623 (1.00) |
0.37 (1.00) |
| 1p loss | 13 (18%) | 60 |
0.529 (1.00) |
0.619 (1.00) |
0.362 (1.00) |
0.374 (1.00) |
0.916 (1.00) |
0.374 (1.00) |
| 1q loss | 11 (15%) | 62 |
0.013 (1.00) |
0.579 (1.00) |
0.158 (1.00) |
0.426 (1.00) |
0.963 (1.00) |
0.426 (1.00) |
| 2p loss | 3 (4%) | 70 |
1 (1.00) |
0.138 (1.00) |
0.796 (1.00) |
1 (1.00) |
0.864 (1.00) |
1 (1.00) |
| 2q loss | 9 (12%) | 64 |
0.728 (1.00) |
0.0187 (1.00) |
0.131 (1.00) |
0.194 (1.00) |
0.218 (1.00) |
0.194 (1.00) |
| 3p loss | 43 (59%) | 30 |
0.141 (1.00) |
0.295 (1.00) |
0.184 (1.00) |
0.04 (1.00) |
0.181 (1.00) |
0.04 (1.00) |
| 3q loss | 13 (18%) | 60 |
0.785 (1.00) |
0.723 (1.00) |
0.179 (1.00) |
0.34 (1.00) |
0.676 (1.00) |
0.34 (1.00) |
| 4p loss | 42 (58%) | 31 |
0.14 (1.00) |
0.665 (1.00) |
0.446 (1.00) |
0.164 (1.00) |
0.698 (1.00) |
0.164 (1.00) |
| 4q loss | 35 (48%) | 38 |
0.00244 (1.00) |
0.677 (1.00) |
0.794 (1.00) |
0.836 (1.00) |
0.969 (1.00) |
0.836 (1.00) |
| 5p loss | 18 (25%) | 55 |
0.217 (1.00) |
0.382 (1.00) |
0.106 (1.00) |
0.117 (1.00) |
0.00908 (1.00) |
0.117 (1.00) |
| 5q loss | 32 (44%) | 41 |
1 (1.00) |
0.581 (1.00) |
0.669 (1.00) |
0.719 (1.00) |
0.294 (1.00) |
0.719 (1.00) |
| 6p loss | 18 (25%) | 55 |
0.101 (1.00) |
0.519 (1.00) |
0.401 (1.00) |
0.439 (1.00) |
0.391 (1.00) |
0.439 (1.00) |
| 6q loss | 16 (22%) | 57 |
0.196 (1.00) |
0.407 (1.00) |
0.445 (1.00) |
0.37 (1.00) |
0.607 (1.00) |
0.37 (1.00) |
| 7p loss | 6 (8%) | 67 |
0.397 (1.00) |
0.283 (1.00) |
0.554 (1.00) |
0.443 (1.00) |
0.0618 (1.00) |
0.443 (1.00) |
| 7q loss | 10 (14%) | 63 |
0.0146 (1.00) |
0.449 (1.00) |
1 (1.00) |
1 (1.00) |
0.801 (1.00) |
1 (1.00) |
| 8p loss | 27 (37%) | 46 |
0.258 (1.00) |
0.605 (1.00) |
0.717 (1.00) |
0.634 (1.00) |
0.69 (1.00) |
0.634 (1.00) |
| 8q loss | 10 (14%) | 63 |
0.245 (1.00) |
0.905 (1.00) |
0.679 (1.00) |
0.57 (1.00) |
0.304 (1.00) |
0.57 (1.00) |
| 9p loss | 42 (58%) | 31 |
0.0694 (1.00) |
0.414 (1.00) |
0.675 (1.00) |
0.534 (1.00) |
0.911 (1.00) |
0.534 (1.00) |
| 9q loss | 23 (32%) | 50 |
0.0147 (1.00) |
0.252 (1.00) |
0.447 (1.00) |
0.517 (1.00) |
0.165 (1.00) |
0.517 (1.00) |
| 10p loss | 22 (30%) | 51 |
0.339 (1.00) |
0.374 (1.00) |
0.618 (1.00) |
0.575 (1.00) |
0.841 (1.00) |
0.575 (1.00) |
| 10q loss | 26 (36%) | 47 |
0.0123 (1.00) |
0.0172 (1.00) |
0.0976 (1.00) |
0.0438 (1.00) |
0.124 (1.00) |
0.0438 (1.00) |
| 11p loss | 22 (30%) | 51 |
0.0131 (1.00) |
0.374 (1.00) |
0.322 (1.00) |
0.293 (1.00) |
0.418 (1.00) |
0.293 (1.00) |
| 11q loss | 27 (37%) | 46 |
0.014 (1.00) |
0.335 (1.00) |
0.24 (1.00) |
0.146 (1.00) |
0.245 (1.00) |
0.146 (1.00) |
| 12p loss | 15 (21%) | 58 |
0.0217 (1.00) |
0.054 (1.00) |
0.00538 (1.00) |
0.00504 (1.00) |
0.0769 (1.00) |
0.00504 (1.00) |
| 12q loss | 15 (21%) | 58 |
0.157 (1.00) |
0.054 (1.00) |
0.0536 (1.00) |
0.0301 (1.00) |
0.171 (1.00) |
0.0301 (1.00) |
| 13q loss | 31 (42%) | 42 |
0.0445 (1.00) |
0.0946 (1.00) |
0.0407 (1.00) |
0.0123 (1.00) |
0.00806 (1.00) |
0.0123 (1.00) |
| 14q loss | 18 (25%) | 55 |
0.378 (1.00) |
0.134 (1.00) |
0.0395 (1.00) |
0.21 (1.00) |
0.0283 (1.00) |
0.21 (1.00) |
| 15q loss | 20 (27%) | 53 |
0.923 (1.00) |
0.35 (1.00) |
0.529 (1.00) |
0.46 (1.00) |
0.655 (1.00) |
0.46 (1.00) |
| 16p loss | 18 (25%) | 55 |
0.378 (1.00) |
0.218 (1.00) |
0.127 (1.00) |
0.117 (1.00) |
0.138 (1.00) |
0.117 (1.00) |
| 16q loss | 19 (26%) | 54 |
0.0326 (1.00) |
0.299 (1.00) |
0.0621 (1.00) |
0.0534 (1.00) |
0.133 (1.00) |
0.0534 (1.00) |
| 17p loss | 26 (36%) | 47 |
0.0544 (1.00) |
0.0123 (1.00) |
0.0526 (1.00) |
0.0239 (1.00) |
0.0334 (1.00) |
0.0239 (1.00) |
| 17q loss | 8 (11%) | 65 |
0.615 (1.00) |
0.488 (1.00) |
0.152 (1.00) |
0.232 (1.00) |
0.094 (1.00) |
0.232 (1.00) |
| 18p loss | 25 (34%) | 48 |
0.271 (1.00) |
0.122 (1.00) |
0.0717 (1.00) |
0.526 (1.00) |
0.0893 (1.00) |
0.526 (1.00) |
| 18q loss | 40 (55%) | 33 |
0.455 (1.00) |
0.35 (1.00) |
0.216 (1.00) |
0.238 (1.00) |
0.117 (1.00) |
0.238 (1.00) |
| 19p loss | 26 (36%) | 47 |
0.0123 (1.00) |
0.154 (1.00) |
0.0257 (1.00) |
0.426 (1.00) |
0.0469 (1.00) |
0.426 (1.00) |
| 19q loss | 21 (29%) | 52 |
0.0241 (1.00) |
0.029 (1.00) |
0.0258 (1.00) |
0.137 (1.00) |
0.198 (1.00) |
0.137 (1.00) |
| 20p loss | 9 (12%) | 64 |
0.811 (1.00) |
1 (1.00) |
0.267 (1.00) |
0.391 (1.00) |
0.398 (1.00) |
0.391 (1.00) |
| 20q loss | 3 (4%) | 70 |
0.436 (1.00) |
0.138 (1.00) |
0.599 (1.00) |
0.576 (1.00) |
1 (1.00) |
0.576 (1.00) |
| 21q loss | 44 (60%) | 29 |
0.472 (1.00) |
0.0724 (1.00) |
0.15 (1.00) |
0.0524 (1.00) |
0.0857 (1.00) |
0.0524 (1.00) |
| 22q loss | 26 (36%) | 47 |
0.422 (1.00) |
0.0394 (1.00) |
0.287 (1.00) |
0.244 (1.00) |
0.375 (1.00) |
0.244 (1.00) |
| xq loss | 19 (26%) | 54 |
0.413 (1.00) |
0.048 (1.00) |
0.334 (1.00) |
0.389 (1.00) |
0.398 (1.00) |
0.389 (1.00) |
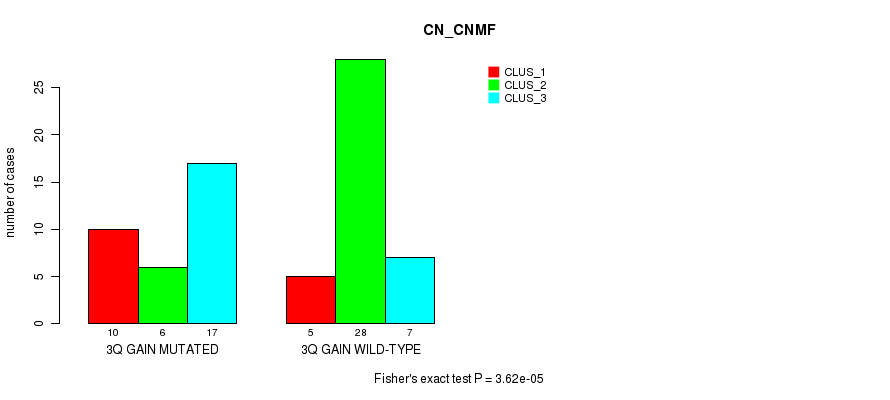
P value = 3.62e-05 (Fisher's exact test), Q value = 0.017
Table S1. Gene #6: '3q gain' versus Molecular Subtype #1: 'CN_CNMF'
| nPatients | CLUS_1 | CLUS_2 | CLUS_3 |
|---|---|---|---|
| ALL | 15 | 34 | 24 |
| 3Q GAIN MUTATED | 10 | 6 | 17 |
| 3Q GAIN WILD-TYPE | 5 | 28 | 7 |
Figure S1. Get High-res Image Gene #6: '3q gain' versus Molecular Subtype #1: 'CN_CNMF'
-
Copy number data file = transformed.cor.cli.txt
-
Molecular subtypes file = ESCA-TP.transferedmergedcluster.txt
-
Number of patients = 73
-
Number of significantly arm-level cnvs = 80
-
Number of molecular subtypes = 6
-
Exclude genes that fewer than K tumors have mutations, K = 3
For binary or multi-class clinical features (nominal or ordinal), two-tailed Fisher's exact tests (Fisher 1922) were used to estimate the P values using the 'fisher.test' function in R
For multiple hypothesis correction, Q value is the False Discovery Rate (FDR) analogue of the P value (Benjamini and Hochberg 1995), defined as the minimum FDR at which the test may be called significant. We used the 'Benjamini and Hochberg' method of 'p.adjust' function in R to convert P values into Q values.
In addition to the links below, the full results of the analysis summarized in this report can also be downloaded programmatically using firehose_get, or interactively from either the Broad GDAC website or TCGA Data Coordination Center Portal.