This pipeline uses various statistical tests to identify mRNAs whose expression levels correlated to selected clinical features.
Testing the association between 12042 genes and 6 clinical features across 525 samples, statistically thresholded by Q value < 0.05, 4 clinical features related to at least one genes.
-
78 genes correlated to 'AGE'.
-
FBXO17 , KIAA0495 , RANBP17 , NOL3 , TUSC3 , ...
-
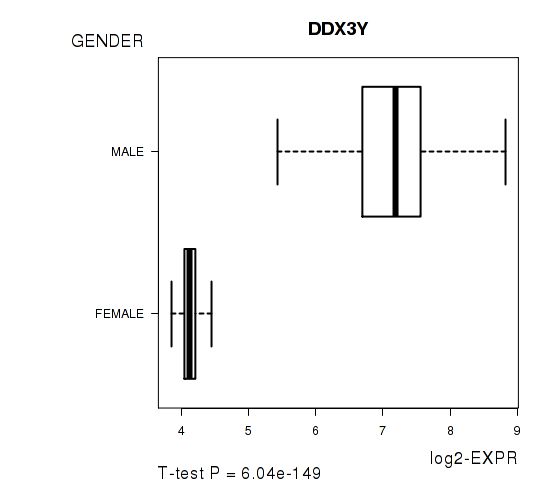
21 genes correlated to 'GENDER'.
-
DDX3Y , RPS4Y1 , JARID1D , EIF1AY , NLGN4Y , ...
-
1 gene correlated to 'KARNOFSKY.PERFORMANCE.SCORE'.
-
TM4SF20
-
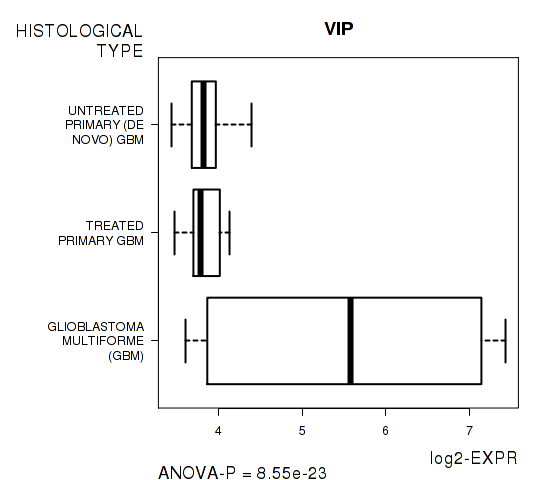
578 genes correlated to 'HISTOLOGICAL.TYPE'.
-
VIP , CDH8 , CLDN3 , KCNV1 , RYR2 , ...
-
No genes correlated to 'Time to Death', and 'RADIATIONS.RADIATION.REGIMENINDICATION'.
Complete statistical result table is provided in Supplement Table 1
Table 1. Get Full Table This table shows the clinical features, statistical methods used, and the number of genes that are significantly associated with each clinical feature at Q value < 0.05.
| Clinical feature | Statistical test | Significant genes | Associated with | Associated with | ||
|---|---|---|---|---|---|---|
| Time to Death | Cox regression test | N=0 | ||||
| AGE | Spearman correlation test | N=78 | older | N=63 | younger | N=15 |
| GENDER | t test | N=21 | male | N=13 | female | N=8 |
| KARNOFSKY PERFORMANCE SCORE | Spearman correlation test | N=1 | higher score | N=1 | lower score | N=0 |
| HISTOLOGICAL TYPE | ANOVA test | N=578 | ||||
| RADIATIONS RADIATION REGIMENINDICATION | t test | N=0 |
Table S1. Basic characteristics of clinical feature: 'Time to Death'
| Time to Death | Duration (Months) | 0.1-127.6 (median=10.4) |
| censored | N = 92 | |
| death | N = 433 | |
| Significant markers | N = 0 |
Table S2. Basic characteristics of clinical feature: 'AGE'
| AGE | Mean (SD) | 57.68 (15) |
| Significant markers | N = 78 | |
| pos. correlated | 63 | |
| neg. correlated | 15 |
Table S3. Get Full Table List of top 10 genes significantly correlated to 'AGE' by Spearman correlation test
| SpearmanCorr | corrP | Q | |
|---|---|---|---|
| FBXO17 | 0.3074 | 5.924e-13 | 7.13e-09 |
| KIAA0495 | 0.2949 | 5.437e-12 | 6.55e-08 |
| RANBP17 | -0.2916 | 9.501e-12 | 1.14e-07 |
| NOL3 | 0.2831 | 3.903e-11 | 4.7e-07 |
| TUSC3 | -0.2761 | 1.217e-10 | 1.46e-06 |
| C14ORF45 | 0.2726 | 2.115e-10 | 2.55e-06 |
| DRG2 | 0.2617 | 1.147e-09 | 1.38e-05 |
| C5ORF21 | 0.2498 | 6.579e-09 | 7.92e-05 |
| CBR1 | 0.2455 | 1.203e-08 | 0.000145 |
| H2AFY2 | -0.2455 | 1.206e-08 | 0.000145 |
Figure S1. Get High-res Image As an example, this figure shows the association of FBXO17 to 'AGE'. P value = 5.92e-13 with Spearman correlation analysis. The straight line presents the best linear regression.

Table S4. Basic characteristics of clinical feature: 'GENDER'
| GENDER | Labels | N |
| FEMALE | 205 | |
| MALE | 320 | |
| Significant markers | N = 21 | |
| Higher in MALE | 13 | |
| Higher in FEMALE | 8 |
Table S5. Get Full Table List of top 10 genes differentially expressed by 'GENDER'
| T(pos if higher in 'MALE') | ttestP | Q | AUC | |
|---|---|---|---|---|
| DDX3Y | 37.88 | 6.04e-149 | 7.27e-145 | 0.9584 |
| RPS4Y1 | 40.8 | 3.155e-144 | 3.8e-140 | 0.9504 |
| JARID1D | 34.8 | 3.172e-138 | 3.82e-134 | 0.9571 |
| EIF1AY | 34.85 | 3.22e-137 | 3.88e-133 | 0.9499 |
| NLGN4Y | 30.29 | 1.034e-111 | 1.24e-107 | 0.9388 |
| UTY | 26.77 | 4.476e-99 | 5.39e-95 | 0.9435 |
| USP9Y | 22.07 | 1.533e-75 | 1.84e-71 | 0.934 |
| CYORF15B | 22.11 | 4.66e-75 | 5.61e-71 | 0.9433 |
| ZFY | 14.7 | 4.243e-41 | 5.11e-37 | 0.8444 |
| HDHD1A | -10.45 | 1.615e-22 | 1.94e-18 | 0.7641 |
Figure S2. Get High-res Image As an example, this figure shows the association of DDX3Y to 'GENDER'. P value = 6.04e-149 with T-test analysis.
One gene related to 'KARNOFSKY.PERFORMANCE.SCORE'.
Table S6. Basic characteristics of clinical feature: 'KARNOFSKY.PERFORMANCE.SCORE'
| KARNOFSKY.PERFORMANCE.SCORE | Mean (SD) | 77.12 (14) |
| Significant markers | N = 1 | |
| pos. correlated | 1 | |
| neg. correlated | 0 |
Table S7. Get Full Table List of one gene significantly correlated to 'KARNOFSKY.PERFORMANCE.SCORE' by Spearman correlation test
| SpearmanCorr | corrP | Q | |
|---|---|---|---|
| TM4SF20 | 0.2356 | 2.62e-06 | 0.0316 |
Figure S3. Get High-res Image As an example, this figure shows the association of TM4SF20 to 'KARNOFSKY.PERFORMANCE.SCORE'. P value = 2.62e-06 with Spearman correlation analysis. The straight line presents the best linear regression.

Table S8. Basic characteristics of clinical feature: 'HISTOLOGICAL.TYPE'
| HISTOLOGICAL.TYPE | Labels | N |
| GLIOBLASTOMA MULTIFORME (GBM) | 6 | |
| TREATED PRIMARY GBM | 20 | |
| UNTREATED PRIMARY (DE NOVO) GBM | 499 | |
| Significant markers | N = 578 |
Table S9. Get Full Table List of top 10 genes differentially expressed by 'HISTOLOGICAL.TYPE'
| ANOVA_P | Q | |
|---|---|---|
| VIP | 8.545e-23 | 1.03e-18 |
| CDH8 | 1.951e-22 | 2.35e-18 |
| CLDN3 | 3.941e-21 | 4.75e-17 |
| KCNV1 | 3.825e-20 | 4.6e-16 |
| RYR2 | 7.965e-20 | 9.59e-16 |
| PAX8 | 2.083e-19 | 2.51e-15 |
| CLCA4 | 3.139e-19 | 3.78e-15 |
| KIAA0774 | 4.213e-19 | 5.07e-15 |
| NEUROD6 | 6.786e-19 | 8.17e-15 |
| CACNG3 | 9.112e-19 | 1.1e-14 |
Figure S4. Get High-res Image As an example, this figure shows the association of VIP to 'HISTOLOGICAL.TYPE'. P value = 8.55e-23 with ANOVA analysis.
No gene related to 'RADIATIONS.RADIATION.REGIMENINDICATION'.
Table S10. Basic characteristics of clinical feature: 'RADIATIONS.RADIATION.REGIMENINDICATION'
| RADIATIONS.RADIATION.REGIMENINDICATION | Labels | N |
| NO | 360 | |
| YES | 165 | |
| Significant markers | N = 0 |
-
Expresson data file = GBM-TP.medianexp.txt
-
Clinical data file = GBM-TP.merged_data.txt
-
Number of patients = 525
-
Number of genes = 12042
-
Number of clinical features = 6
For survival clinical features, Wald's test in univariate Cox regression analysis with proportional hazards model (Andersen and Gill 1982) was used to estimate the P values using the 'coxph' function in R. Kaplan-Meier survival curves were plot using the four quartile subgroups of patients based on expression levels
For continuous numerical clinical features, Spearman's rank correlation coefficients (Spearman 1904) and two-tailed P values were estimated using 'cor.test' function in R
For two-class clinical features, two-tailed Student's t test with unequal variance (Lehmann and Romano 2005) was applied to compare the log2-expression levels between the two clinical classes using 't.test' function in R
For multi-class clinical features (ordinal or nominal), one-way analysis of variance (Howell 2002) was applied to compare the log2-expression levels between different clinical classes using 'anova' function in R
For multiple hypothesis correction, Q value is the False Discovery Rate (FDR) analogue of the P value (Benjamini and Hochberg 1995), defined as the minimum FDR at which the test may be called significant. We used the 'Benjamini and Hochberg' method of 'p.adjust' function in R to convert P values into Q values.
In addition to the links below, the full results of the analysis summarized in this report can also be downloaded programmatically using firehose_get, or interactively from either the Broad GDAC website or TCGA Data Coordination Center Portal.