This pipeline computes the correlation between significant arm-level copy number variations (cnvs) and selected clinical features.
Testing the association between copy number variation 68 arm-level events and 11 clinical features across 139 patients, 23 significant findings detected with Q value < 0.25.
-
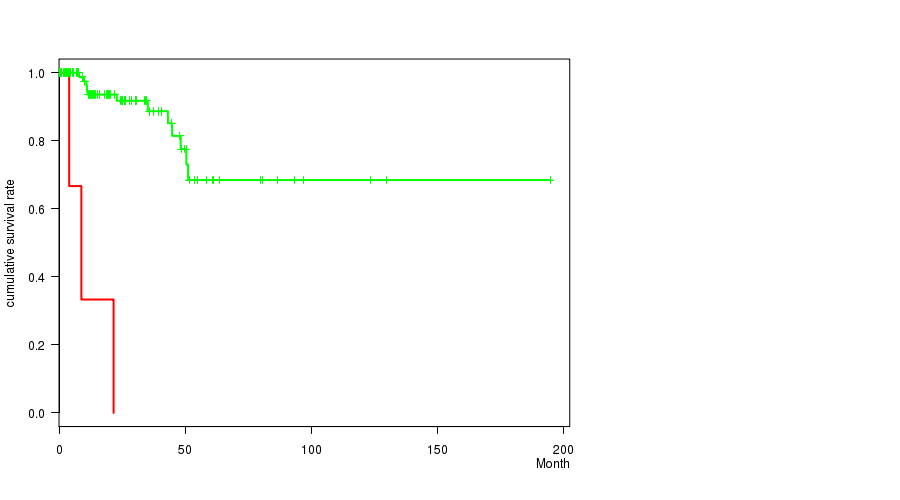
1p gain cnv correlated to 'Time to Death'.
-
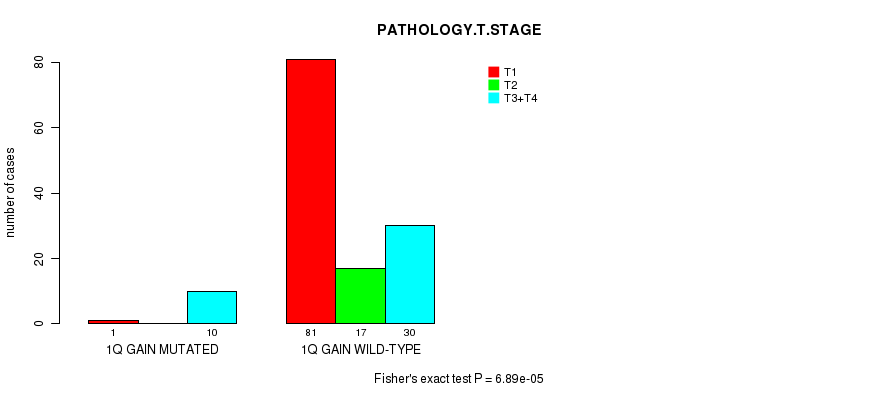
1q gain cnv correlated to 'Time to Death', 'NEOPLASM.DISEASESTAGE', and 'PATHOLOGY.T.STAGE'.
-
6q gain cnv correlated to 'Time to Death'.
-
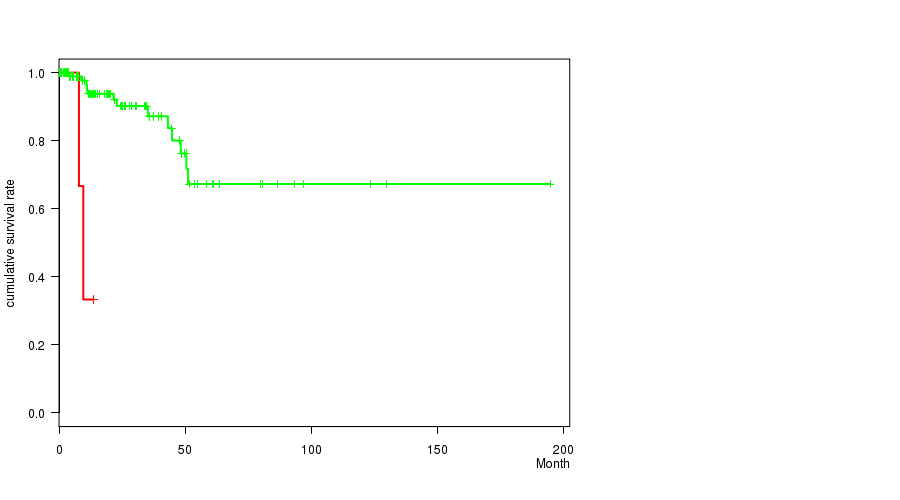
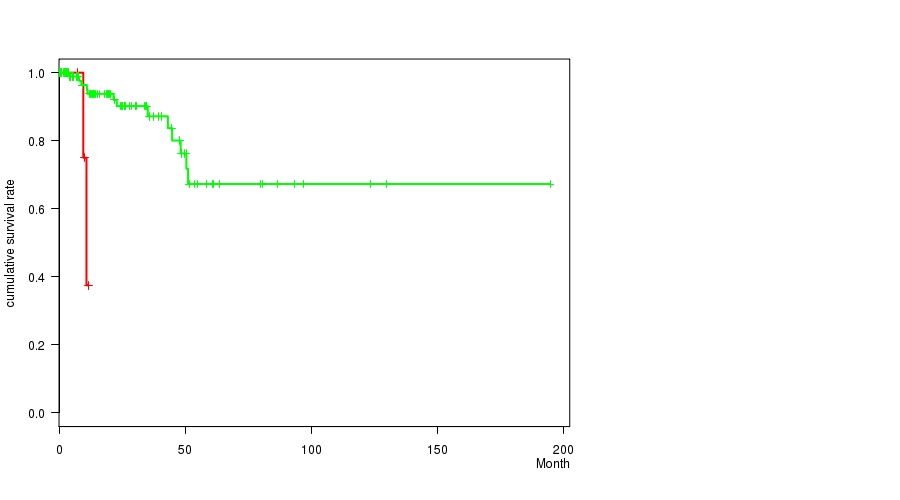
8q gain cnv correlated to 'Time to Death'.
-
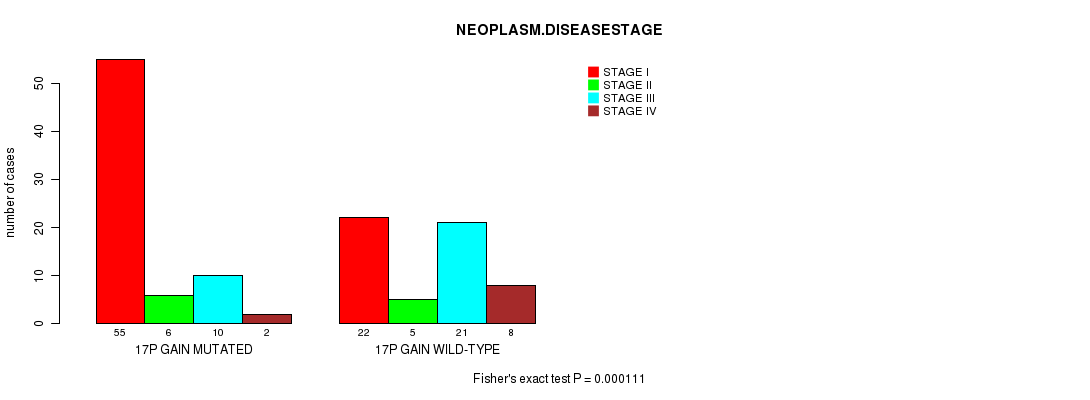
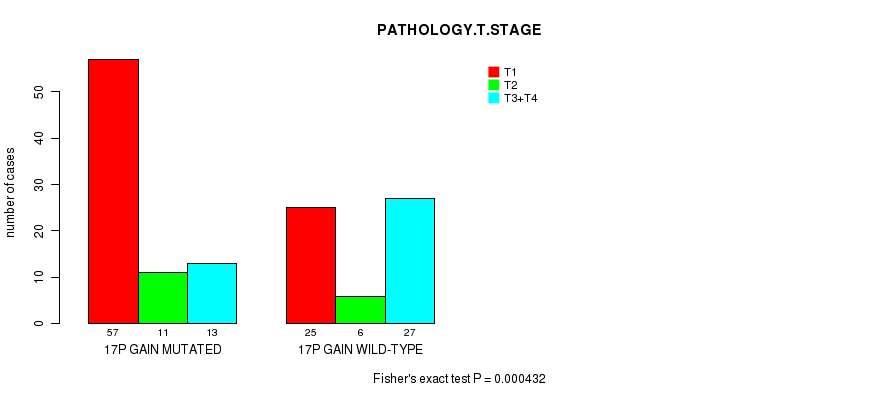
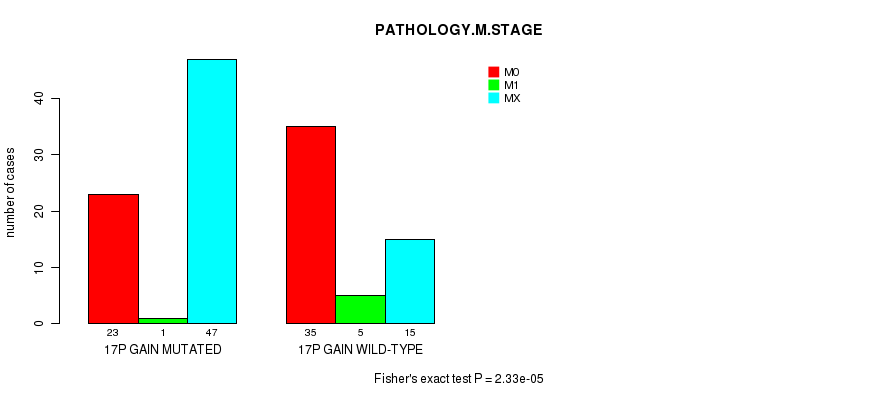
17p gain cnv correlated to 'NEOPLASM.DISEASESTAGE', 'PATHOLOGY.T.STAGE', and 'PATHOLOGY.M.STAGE'.
-
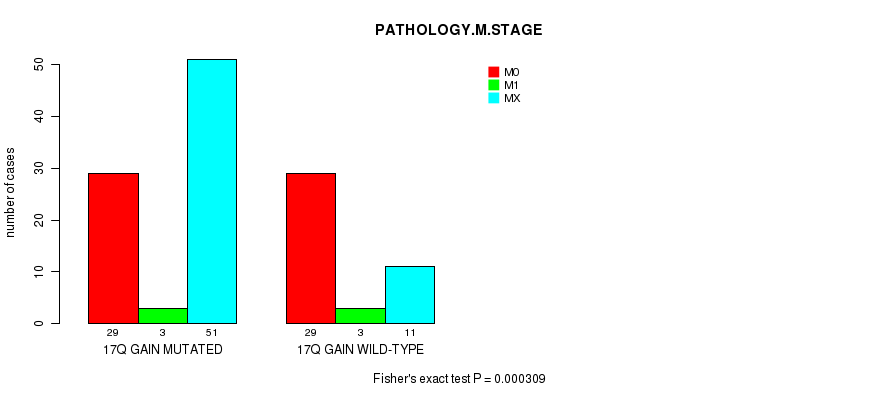
17q gain cnv correlated to 'PATHOLOGY.M.STAGE'.
-
3q loss cnv correlated to 'Time to Death'.
-
8p loss cnv correlated to 'Time to Death'.
-
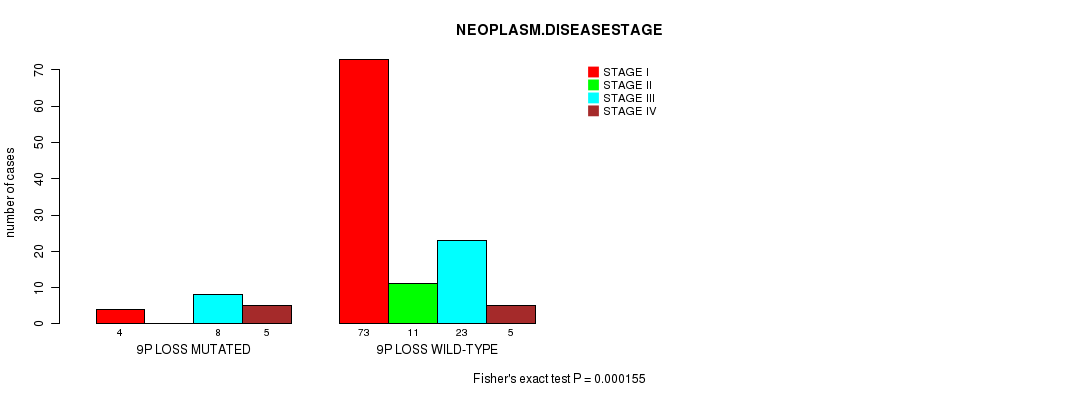
9p loss cnv correlated to 'NEOPLASM.DISEASESTAGE' and 'PATHOLOGY.T.STAGE'.
-
9q loss cnv correlated to 'PATHOLOGY.T.STAGE'.
-
11p loss cnv correlated to 'Time to Death'.
-
11q loss cnv correlated to 'Time to Death' and 'PATHOLOGY.T.STAGE'.
-
15q loss cnv correlated to 'Time to Death'.
-
16p loss cnv correlated to 'Time to Death'.
-
16q loss cnv correlated to 'Time to Death'.
-
17p loss cnv correlated to 'Time to Death'.
-
22q loss cnv correlated to 'PATHOLOGY.T.STAGE'.
Table 1. Get Full Table Overview of the association between significant copy number variation of 68 arm-level events and 11 clinical features. Shown in the table are P values (Q values). Thresholded by Q value < 0.25, 23 significant findings detected.
|
Clinical Features |
Time to Death |
AGE |
NEOPLASM DISEASESTAGE |
PATHOLOGY T STAGE |
PATHOLOGY N STAGE |
PATHOLOGY M STAGE |
GENDER |
KARNOFSKY PERFORMANCE SCORE |
HISTOLOGICAL TYPE |
NUMBERPACKYEARSSMOKED | YEAROFTOBACCOSMOKINGONSET | ||
| nCNV (%) | nWild-Type | logrank test | t-test | Fisher's exact test | Fisher's exact test | Fisher's exact test | Fisher's exact test | Fisher's exact test | t-test | Fisher's exact test | t-test | t-test | |
| 1q gain | 11 (8%) | 128 |
3.7e-06 (0.00211) |
0.375 (1.00) |
0.000163 (0.0912) |
6.89e-05 (0.0389) |
0.379 (1.00) |
0.13 (1.00) |
0.0881 (1.00) |
1 (1.00) |
|||
| 17p gain | 81 (58%) | 58 |
0.0772 (1.00) |
0.0463 (1.00) |
0.000111 (0.0625) |
0.000432 (0.239) |
0.227 (1.00) |
2.33e-05 (0.0132) |
0.024 (1.00) |
0.246 (1.00) |
1 (1.00) |
0.352 (1.00) |
|
| 9p loss | 19 (14%) | 120 |
0.00884 (1.00) |
0.575 (1.00) |
0.000155 (0.0872) |
0.000215 (0.12) |
0.21 (1.00) |
0.0442 (1.00) |
0.00727 (1.00) |
0.37 (1.00) |
1 (1.00) |
||
| 11q loss | 13 (9%) | 126 |
1.31e-05 (0.00743) |
0.0666 (1.00) |
0.00056 (0.309) |
0.000419 (0.232) |
0.0585 (1.00) |
0.18 (1.00) |
0.532 (1.00) |
0.341 (1.00) |
0.452 (1.00) |
||
| 1p gain | 4 (3%) | 135 |
6.27e-11 (3.59e-08) |
0.437 (1.00) |
0.0248 (1.00) |
0.0119 (1.00) |
0.0394 (1.00) |
0.277 (1.00) |
0.0823 (1.00) |
1 (1.00) |
|||
| 6q gain | 3 (2%) | 136 |
2.7e-06 (0.00154) |
0.254 (1.00) |
0.0323 (1.00) |
0.495 (1.00) |
0.00273 (1.00) |
0.554 (1.00) |
0.125 (1.00) |
||||
| 8q gain | 13 (9%) | 126 |
1.27e-05 (0.00722) |
0.82 (1.00) |
0.0392 (1.00) |
0.0331 (1.00) |
0.0305 (1.00) |
0.377 (1.00) |
0.212 (1.00) |
0.502 (1.00) |
1 (1.00) |
||
| 17q gain | 94 (68%) | 45 |
0.607 (1.00) |
0.108 (1.00) |
0.137 (1.00) |
0.139 (1.00) |
0.506 (1.00) |
0.000309 (0.172) |
0.114 (1.00) |
0.651 (1.00) |
0.664 (1.00) |
||
| 3q loss | 4 (3%) | 135 |
1.54e-13 (8.86e-11) |
0.203 (1.00) |
0.00818 (1.00) |
0.0119 (1.00) |
0.164 (1.00) |
0.277 (1.00) |
0.584 (1.00) |
0.163 (1.00) |
|||
| 8p loss | 5 (4%) | 134 |
0.000405 (0.225) |
0.205 (1.00) |
0.0309 (1.00) |
0.504 (1.00) |
0.0111 (1.00) |
0.162 (1.00) |
0.201 (1.00) |
||||
| 9q loss | 20 (14%) | 119 |
0.0168 (1.00) |
0.904 (1.00) |
0.00187 (1.00) |
0.00015 (0.0845) |
0.127 (1.00) |
0.305 (1.00) |
0.0624 (1.00) |
0.385 (1.00) |
0.593 (1.00) |
||
| 11p loss | 10 (7%) | 129 |
0.000286 (0.16) |
0.111 (1.00) |
0.0576 (1.00) |
0.109 (1.00) |
0.164 (1.00) |
0.594 (1.00) |
0.169 (1.00) |
0.367 (1.00) |
|||
| 15q loss | 15 (11%) | 124 |
0.000154 (0.0866) |
0.135 (1.00) |
0.0766 (1.00) |
0.026 (1.00) |
0.217 (1.00) |
0.0814 (1.00) |
0.385 (1.00) |
0.724 (1.00) |
1 (1.00) |
||
| 16p loss | 4 (3%) | 135 |
1.51e-05 (0.00856) |
0.663 (1.00) |
0.199 (1.00) |
0.145 (1.00) |
1 (1.00) |
0.0823 (1.00) |
1 (1.00) |
||||
| 16q loss | 4 (3%) | 135 |
1.51e-05 (0.00856) |
0.663 (1.00) |
0.199 (1.00) |
0.145 (1.00) |
1 (1.00) |
0.0823 (1.00) |
1 (1.00) |
||||
| 17p loss | 8 (6%) | 131 |
2.22e-16 (1.28e-13) |
0.731 (1.00) |
0.000768 (0.419) |
0.0125 (1.00) |
0.00791 (1.00) |
0.0408 (1.00) |
0.0542 (1.00) |
0.472 (1.00) |
1 (1.00) |
||
| 22q loss | 34 (24%) | 105 |
0.37 (1.00) |
0.629 (1.00) |
0.000658 (0.361) |
0.000363 (0.202) |
0.147 (1.00) |
0.237 (1.00) |
0.0184 (1.00) |
0.433 (1.00) |
1 (1.00) |
||
| 2p gain | 24 (17%) | 115 |
0.0751 (1.00) |
0.533 (1.00) |
0.0675 (1.00) |
0.522 (1.00) |
0.203 (1.00) |
0.00311 (1.00) |
0.465 (1.00) |
0.362 (1.00) |
0.276 (1.00) |
||
| 2q gain | 26 (19%) | 113 |
0.159 (1.00) |
0.998 (1.00) |
0.0169 (1.00) |
0.567 (1.00) |
0.127 (1.00) |
0.00508 (1.00) |
0.347 (1.00) |
0.35 (1.00) |
0.312 (1.00) |
||
| 3p gain | 39 (28%) | 100 |
0.226 (1.00) |
0.555 (1.00) |
0.065 (1.00) |
0.0271 (1.00) |
1 (1.00) |
0.345 (1.00) |
0.307 (1.00) |
0.0914 (1.00) |
0.673 (1.00) |
||
| 3q gain | 45 (32%) | 94 |
0.102 (1.00) |
0.421 (1.00) |
0.1 (1.00) |
0.0506 (1.00) |
1 (1.00) |
0.14 (1.00) |
0.173 (1.00) |
0.283 (1.00) |
1 (1.00) |
0.379 (1.00) |
|
| 4p gain | 6 (4%) | 133 |
0.0147 (1.00) |
0.00417 (1.00) |
0.0706 (1.00) |
0.716 (1.00) |
0.53 (1.00) |
0.188 (1.00) |
0.668 (1.00) |
1 (1.00) |
|||
| 4q gain | 5 (4%) | 134 |
0.311 (1.00) |
0.0137 (1.00) |
0.301 (1.00) |
0.654 (1.00) |
0.284 (1.00) |
0.688 (1.00) |
1 (1.00) |
1 (1.00) |
|||
| 5p gain | 21 (15%) | 118 |
0.395 (1.00) |
0.631 (1.00) |
0.216 (1.00) |
0.229 (1.00) |
0.862 (1.00) |
0.405 (1.00) |
0.61 (1.00) |
0.336 (1.00) |
0.591 (1.00) |
||
| 5q gain | 20 (14%) | 119 |
0.116 (1.00) |
0.968 (1.00) |
0.306 (1.00) |
0.337 (1.00) |
1 (1.00) |
0.385 (1.00) |
0.793 (1.00) |
0.336 (1.00) |
0.593 (1.00) |
||
| 6p gain | 5 (4%) | 134 |
0.053 (1.00) |
0.679 (1.00) |
0.0426 (1.00) |
0.0407 (1.00) |
0.434 (1.00) |
0.00272 (1.00) |
0.322 (1.00) |
0.201 (1.00) |
|||
| 7p gain | 81 (58%) | 58 |
0.0927 (1.00) |
0.445 (1.00) |
0.00581 (1.00) |
0.0167 (1.00) |
1 (1.00) |
0.139 (1.00) |
0.133 (1.00) |
0.189 (1.00) |
0.401 (1.00) |
||
| 7q gain | 82 (59%) | 57 |
0.084 (1.00) |
0.376 (1.00) |
0.0033 (1.00) |
0.0111 (1.00) |
1 (1.00) |
0.183 (1.00) |
0.0915 (1.00) |
0.189 (1.00) |
0.401 (1.00) |
||
| 8p gain | 10 (7%) | 129 |
0.033 (1.00) |
0.909 (1.00) |
0.363 (1.00) |
0.269 (1.00) |
0.441 (1.00) |
0.846 (1.00) |
0.49 (1.00) |
1 (1.00) |
|||
| 9p gain | 3 (2%) | 136 |
0.0855 (1.00) |
0.938 (1.00) |
0.0853 (1.00) |
0.0923 (1.00) |
0.663 (1.00) |
1 (1.00) |
1 (1.00) |
||||
| 10p gain | 5 (4%) | 134 |
0.509 (1.00) |
0.942 (1.00) |
0.235 (1.00) |
0.504 (1.00) |
0.373 (1.00) |
1 (1.00) |
1 (1.00) |
||||
| 10q gain | 5 (4%) | 134 |
0.509 (1.00) |
0.942 (1.00) |
0.235 (1.00) |
0.504 (1.00) |
0.373 (1.00) |
1 (1.00) |
1 (1.00) |
||||
| 11p gain | 6 (4%) | 133 |
0.0256 (1.00) |
0.297 (1.00) |
0.0426 (1.00) |
0.0457 (1.00) |
0.721 (1.00) |
0.0109 (1.00) |
1 (1.00) |
1 (1.00) |
|||
| 11q gain | 4 (3%) | 135 |
0.766 (1.00) |
0.126 (1.00) |
0.178 (1.00) |
0.0602 (1.00) |
1 (1.00) |
0.137 (1.00) |
0.584 (1.00) |
1 (1.00) |
|||
| 12p gain | 55 (40%) | 84 |
0.447 (1.00) |
0.708 (1.00) |
0.741 (1.00) |
0.656 (1.00) |
0.493 (1.00) |
0.102 (1.00) |
0.0918 (1.00) |
0.736 (1.00) |
0.0358 (1.00) |
0.352 (1.00) |
|
| 12q gain | 55 (40%) | 84 |
0.447 (1.00) |
0.708 (1.00) |
0.741 (1.00) |
0.656 (1.00) |
0.493 (1.00) |
0.102 (1.00) |
0.0918 (1.00) |
0.736 (1.00) |
0.0358 (1.00) |
0.352 (1.00) |
|
| 13q gain | 15 (11%) | 124 |
0.492 (1.00) |
0.145 (1.00) |
0.602 (1.00) |
0.666 (1.00) |
1 (1.00) |
0.772 (1.00) |
0.182 (1.00) |
0.127 (1.00) |
|||
| 14q gain | 3 (2%) | 136 |
0.0573 (1.00) |
0.0365 (1.00) |
0.663 (1.00) |
0.217 (1.00) |
1 (1.00) |
||||||
| 16p gain | 72 (52%) | 67 |
0.937 (1.00) |
0.355 (1.00) |
0.756 (1.00) |
1 (1.00) |
1 (1.00) |
0.224 (1.00) |
0.00544 (1.00) |
0.488 (1.00) |
0.429 (1.00) |
||
| 16q gain | 70 (50%) | 69 |
0.277 (1.00) |
0.537 (1.00) |
0.63 (1.00) |
0.757 (1.00) |
0.804 (1.00) |
0.0448 (1.00) |
0.0273 (1.00) |
0.327 (1.00) |
0.441 (1.00) |
||
| 18p gain | 7 (5%) | 132 |
0.902 (1.00) |
0.576 (1.00) |
0.467 (1.00) |
0.529 (1.00) |
0.0924 (1.00) |
1 (1.00) |
0.542 (1.00) |
0.271 (1.00) |
|||
| 18q gain | 5 (4%) | 134 |
0.345 (1.00) |
0.943 (1.00) |
0.724 (1.00) |
0.654 (1.00) |
0.469 (1.00) |
1 (1.00) |
0.201 (1.00) |
||||
| 19p gain | 3 (2%) | 136 |
0.64 (1.00) |
0.337 (1.00) |
0.531 (1.00) |
0.495 (1.00) |
1 (1.00) |
0.663 (1.00) |
1 (1.00) |
1 (1.00) |
|||
| 19q gain | 3 (2%) | 136 |
0.64 (1.00) |
0.337 (1.00) |
0.531 (1.00) |
0.495 (1.00) |
1 (1.00) |
0.663 (1.00) |
1 (1.00) |
1 (1.00) |
|||
| 20p gain | 46 (33%) | 93 |
0.932 (1.00) |
0.0655 (1.00) |
0.461 (1.00) |
0.444 (1.00) |
0.876 (1.00) |
0.853 (1.00) |
1 (1.00) |
0.402 (1.00) |
0.093 (1.00) |
||
| 20q gain | 48 (35%) | 91 |
0.604 (1.00) |
0.0497 (1.00) |
0.214 (1.00) |
0.243 (1.00) |
0.771 (1.00) |
0.95 (1.00) |
0.848 (1.00) |
0.402 (1.00) |
0.182 (1.00) |
||
| 21q gain | 6 (4%) | 133 |
0.766 (1.00) |
0.0268 (1.00) |
0.551 (1.00) |
0.25 (1.00) |
0.505 (1.00) |
0.668 (1.00) |
1 (1.00) |
||||
| xq gain | 41 (29%) | 98 |
0.927 (1.00) |
0.885 (1.00) |
0.05 (1.00) |
0.043 (1.00) |
1 (1.00) |
0.353 (1.00) |
0.0418 (1.00) |
0.134 (1.00) |
0.67 (1.00) |
0.379 (1.00) |
|
| 1p loss | 16 (12%) | 123 |
0.664 (1.00) |
0.979 (1.00) |
0.452 (1.00) |
0.639 (1.00) |
0.53 (1.00) |
0.564 (1.00) |
1 (1.00) |
0.341 (1.00) |
1 (1.00) |
||
| 1q loss | 10 (7%) | 129 |
0.507 (1.00) |
0.386 (1.00) |
0.304 (1.00) |
0.645 (1.00) |
0.47 (1.00) |
1 (1.00) |
0.341 (1.00) |
1 (1.00) |
|||
| 3p loss | 11 (8%) | 128 |
0.00962 (1.00) |
0.147 (1.00) |
0.000565 (0.312) |
0.000711 (0.39) |
0.864 (1.00) |
0.0989 (1.00) |
1 (1.00) |
0.396 (1.00) |
|||
| 4p loss | 11 (8%) | 128 |
0.162 (1.00) |
0.0519 (1.00) |
0.00778 (1.00) |
0.0025 (1.00) |
0.0279 (1.00) |
0.46 (1.00) |
0.00314 (1.00) |
1 (1.00) |
|||
| 4q loss | 12 (9%) | 127 |
0.769 (1.00) |
0.231 (1.00) |
0.0261 (1.00) |
0.0242 (1.00) |
0.267 (1.00) |
0.114 (1.00) |
0.044 (1.00) |
0.724 (1.00) |
1 (1.00) |
||
| 5p loss | 5 (4%) | 134 |
0.00118 (0.641) |
0.261 (1.00) |
0.0436 (1.00) |
0.0407 (1.00) |
0.0624 (1.00) |
0.277 (1.00) |
0.162 (1.00) |
1 (1.00) |
|||
| 5q loss | 5 (4%) | 134 |
0.0855 (1.00) |
0.113 (1.00) |
0.199 (1.00) |
0.0407 (1.00) |
0.0394 (1.00) |
0.277 (1.00) |
0.162 (1.00) |
1 (1.00) |
|||
| 6p loss | 11 (8%) | 128 |
0.00679 (1.00) |
0.405 (1.00) |
0.0404 (1.00) |
0.0308 (1.00) |
0.108 (1.00) |
1 (1.00) |
0.0881 (1.00) |
0.193 (1.00) |
1 (1.00) |
||
| 6q loss | 13 (9%) | 126 |
0.0651 (1.00) |
0.947 (1.00) |
0.0445 (1.00) |
0.00544 (1.00) |
0.136 (1.00) |
0.542 (1.00) |
0.0216 (1.00) |
0.363 (1.00) |
1 (1.00) |
||
| 8q loss | 3 (2%) | 136 |
0.00974 (1.00) |
0.641 (1.00) |
0.109 (1.00) |
0.22 (1.00) |
0.137 (1.00) |
0.217 (1.00) |
1 (1.00) |
||||
| 10p loss | 9 (6%) | 130 |
0.204 (1.00) |
0.638 (1.00) |
0.0384 (1.00) |
0.0282 (1.00) |
0.0806 (1.00) |
0.0993 (1.00) |
0.453 (1.00) |
0.403 (1.00) |
1 (1.00) |
||
| 10q loss | 8 (6%) | 131 |
0.151 (1.00) |
0.456 (1.00) |
0.0384 (1.00) |
0.02 (1.00) |
0.0806 (1.00) |
0.0993 (1.00) |
0.698 (1.00) |
0.403 (1.00) |
1 (1.00) |
||
| 13q loss | 12 (9%) | 127 |
0.000764 (0.418) |
0.216 (1.00) |
0.0147 (1.00) |
0.0118 (1.00) |
0.0305 (1.00) |
0.415 (1.00) |
0.0011 (0.596) |
0.341 (1.00) |
1 (1.00) |
||
| 14q loss | 27 (19%) | 112 |
0.206 (1.00) |
0.861 (1.00) |
0.00988 (1.00) |
0.0893 (1.00) |
0.105 (1.00) |
0.134 (1.00) |
0.243 (1.00) |
0.356 (1.00) |
1 (1.00) |
||
| 18p loss | 22 (16%) | 117 |
0.00967 (1.00) |
0.511 (1.00) |
0.00454 (1.00) |
0.00132 (0.714) |
0.127 (1.00) |
0.0821 (1.00) |
0.613 (1.00) |
0.765 (1.00) |
1 (1.00) |
||
| 18q loss | 23 (17%) | 116 |
0.00967 (1.00) |
0.511 (1.00) |
0.00196 (1.00) |
0.00064 (0.352) |
0.127 (1.00) |
0.0751 (1.00) |
0.327 (1.00) |
0.765 (1.00) |
1 (1.00) |
||
| 19p loss | 9 (6%) | 130 |
0.224 (1.00) |
0.606 (1.00) |
0.0858 (1.00) |
0.0282 (1.00) |
0.171 (1.00) |
0.606 (1.00) |
0.453 (1.00) |
0.741 (1.00) |
1 (1.00) |
||
| 19q loss | 8 (6%) | 131 |
0.109 (1.00) |
0.909 (1.00) |
0.0352 (1.00) |
0.00766 (1.00) |
0.171 (1.00) |
0.413 (1.00) |
0.243 (1.00) |
0.741 (1.00) |
1 (1.00) |
||
| 21q loss | 27 (19%) | 112 |
0.979 (1.00) |
0.695 (1.00) |
0.00817 (1.00) |
0.00686 (1.00) |
0.379 (1.00) |
0.136 (1.00) |
0.243 (1.00) |
0.891 (1.00) |
1 (1.00) |
0.408 (1.00) |
|
| xq loss | 16 (12%) | 123 |
0.00108 (0.59) |
0.291 (1.00) |
0.0194 (1.00) |
0.0042 (1.00) |
0.0823 (1.00) |
0.179 (1.00) |
0.0842 (1.00) |
0.478 (1.00) |
0.142 (1.00) |
P value = 6.27e-11 (logrank test), Q value = 3.6e-08
Table S1. Gene #1: '1p gain' versus Clinical Feature #1: 'Time to Death'
| nPatients | nDeath | Duration Range (Median), Month | |
|---|---|---|---|
| ALL | 127 | 15 | 0.0 - 194.8 (14.6) |
| 1P GAIN MUTATED | 3 | 1 | 2.0 - 7.9 (3.7) |
| 1P GAIN WILD-TYPE | 124 | 14 | 0.0 - 194.8 (14.9) |
Figure S1. Get High-res Image Gene #1: '1p gain' versus Clinical Feature #1: 'Time to Death'
P value = 3.7e-06 (logrank test), Q value = 0.0021
Table S2. Gene #2: '1q gain' versus Clinical Feature #1: 'Time to Death'
| nPatients | nDeath | Duration Range (Median), Month | |
|---|---|---|---|
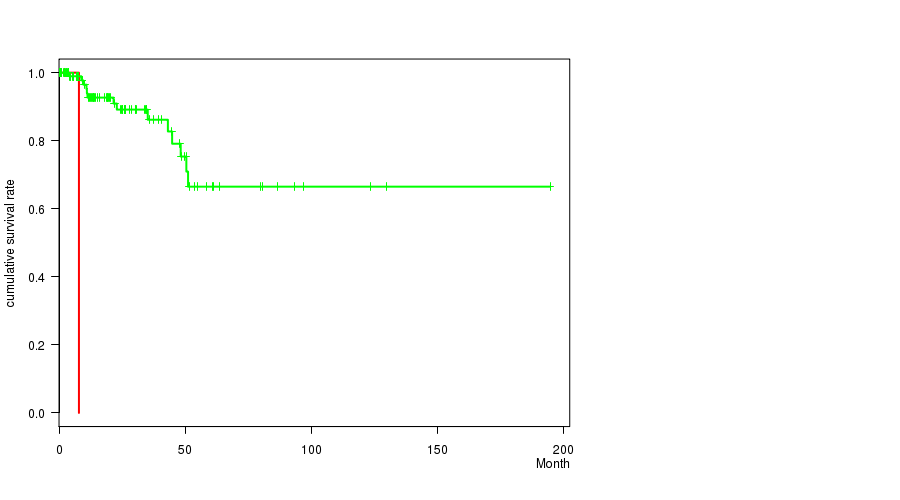
| ALL | 127 | 15 | 0.0 - 194.8 (14.6) |
| 1Q GAIN MUTATED | 10 | 3 | 0.7 - 30.3 (5.8) |
| 1Q GAIN WILD-TYPE | 117 | 12 | 0.0 - 194.8 (15.9) |
Figure S2. Get High-res Image Gene #2: '1q gain' versus Clinical Feature #1: 'Time to Death'

P value = 0.000163 (Fisher's exact test), Q value = 0.091
Table S3. Gene #2: '1q gain' versus Clinical Feature #3: 'NEOPLASM.DISEASESTAGE'
| nPatients | STAGE I | STAGE II | STAGE III | STAGE IV |
|---|---|---|---|---|
| ALL | 77 | 11 | 31 | 10 |
| 1Q GAIN MUTATED | 1 | 0 | 7 | 3 |
| 1Q GAIN WILD-TYPE | 76 | 11 | 24 | 7 |
Figure S3. Get High-res Image Gene #2: '1q gain' versus Clinical Feature #3: 'NEOPLASM.DISEASESTAGE'
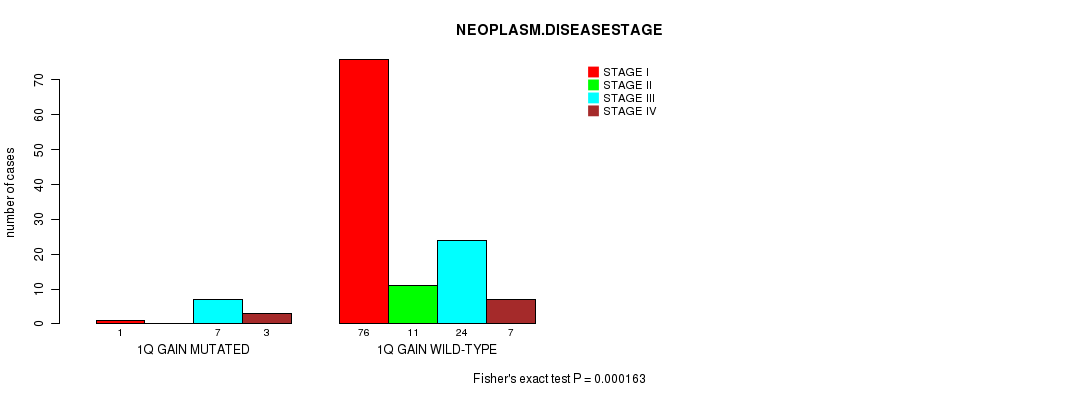
P value = 6.89e-05 (Fisher's exact test), Q value = 0.039
Table S4. Gene #2: '1q gain' versus Clinical Feature #4: 'PATHOLOGY.T.STAGE'
| nPatients | T1 | T2 | T3+T4 |
|---|---|---|---|
| ALL | 82 | 17 | 40 |
| 1Q GAIN MUTATED | 1 | 0 | 10 |
| 1Q GAIN WILD-TYPE | 81 | 17 | 30 |
Figure S4. Get High-res Image Gene #2: '1q gain' versus Clinical Feature #4: 'PATHOLOGY.T.STAGE'
P value = 2.7e-06 (logrank test), Q value = 0.0015
Table S5. Gene #12: '6q gain' versus Clinical Feature #1: 'Time to Death'
| nPatients | nDeath | Duration Range (Median), Month | |
|---|---|---|---|
| ALL | 127 | 15 | 0.0 - 194.8 (14.6) |
| 6Q GAIN MUTATED | 3 | 2 | 7.9 - 13.6 (9.6) |
| 6Q GAIN WILD-TYPE | 124 | 13 | 0.0 - 194.8 (14.9) |
Figure S5. Get High-res Image Gene #12: '6q gain' versus Clinical Feature #1: 'Time to Death'
P value = 1.27e-05 (logrank test), Q value = 0.0072
Table S6. Gene #16: '8q gain' versus Clinical Feature #1: 'Time to Death'
| nPatients | nDeath | Duration Range (Median), Month | |
|---|---|---|---|
| ALL | 127 | 15 | 0.0 - 194.8 (14.6) |
| 8Q GAIN MUTATED | 12 | 4 | 0.2 - 43.2 (6.8) |
| 8Q GAIN WILD-TYPE | 115 | 11 | 0.0 - 194.8 (15.9) |
Figure S6. Get High-res Image Gene #16: '8q gain' versus Clinical Feature #1: 'Time to Death'
P value = 0.000111 (Fisher's exact test), Q value = 0.063
Table S7. Gene #28: '17p gain' versus Clinical Feature #3: 'NEOPLASM.DISEASESTAGE'
| nPatients | STAGE I | STAGE II | STAGE III | STAGE IV |
|---|---|---|---|---|
| ALL | 77 | 11 | 31 | 10 |
| 17P GAIN MUTATED | 55 | 6 | 10 | 2 |
| 17P GAIN WILD-TYPE | 22 | 5 | 21 | 8 |
Figure S7. Get High-res Image Gene #28: '17p gain' versus Clinical Feature #3: 'NEOPLASM.DISEASESTAGE'
P value = 0.000432 (Fisher's exact test), Q value = 0.24
Table S8. Gene #28: '17p gain' versus Clinical Feature #4: 'PATHOLOGY.T.STAGE'
| nPatients | T1 | T2 | T3+T4 |
|---|---|---|---|
| ALL | 82 | 17 | 40 |
| 17P GAIN MUTATED | 57 | 11 | 13 |
| 17P GAIN WILD-TYPE | 25 | 6 | 27 |
Figure S8. Get High-res Image Gene #28: '17p gain' versus Clinical Feature #4: 'PATHOLOGY.T.STAGE'
P value = 2.33e-05 (Fisher's exact test), Q value = 0.013
Table S9. Gene #28: '17p gain' versus Clinical Feature #6: 'PATHOLOGY.M.STAGE'
| nPatients | M0 | M1 | MX |
|---|---|---|---|
| ALL | 58 | 6 | 62 |
| 17P GAIN MUTATED | 23 | 1 | 47 |
| 17P GAIN WILD-TYPE | 35 | 5 | 15 |
Figure S9. Get High-res Image Gene #28: '17p gain' versus Clinical Feature #6: 'PATHOLOGY.M.STAGE'
P value = 0.000309 (Fisher's exact test), Q value = 0.17
Table S10. Gene #29: '17q gain' versus Clinical Feature #6: 'PATHOLOGY.M.STAGE'
| nPatients | M0 | M1 | MX |
|---|---|---|---|
| ALL | 58 | 6 | 62 |
| 17Q GAIN MUTATED | 29 | 3 | 51 |
| 17Q GAIN WILD-TYPE | 29 | 3 | 11 |
Figure S10. Get High-res Image Gene #29: '17q gain' versus Clinical Feature #6: 'PATHOLOGY.M.STAGE'
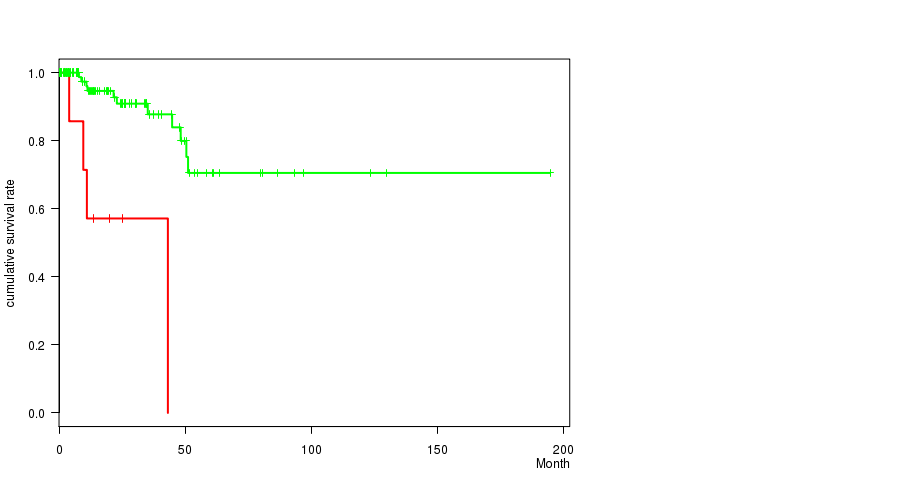
P value = 1.54e-13 (logrank test), Q value = 8.9e-11
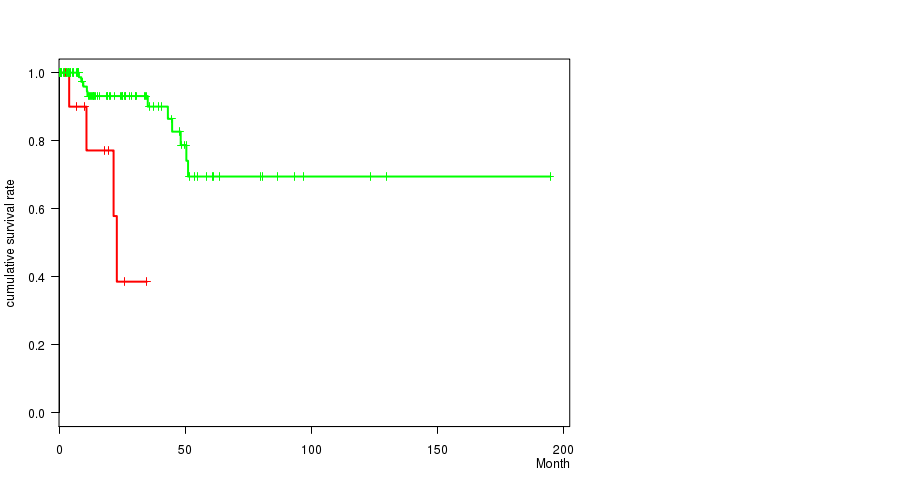
Table S11. Gene #41: '3q loss' versus Clinical Feature #1: 'Time to Death'
| nPatients | nDeath | Duration Range (Median), Month | |
|---|---|---|---|
| ALL | 127 | 15 | 0.0 - 194.8 (14.6) |
| 3Q LOSS MUTATED | 4 | 3 | 3.7 - 21.6 (6.4) |
| 3Q LOSS WILD-TYPE | 123 | 12 | 0.0 - 194.8 (14.6) |
Figure S11. Get High-res Image Gene #41: '3q loss' versus Clinical Feature #1: 'Time to Death'
P value = 0.000405 (logrank test), Q value = 0.22
Table S12. Gene #48: '8p loss' versus Clinical Feature #1: 'Time to Death'
| nPatients | nDeath | Duration Range (Median), Month | |
|---|---|---|---|
| ALL | 127 | 15 | 0.0 - 194.8 (14.6) |
| 8P LOSS MUTATED | 5 | 2 | 7.3 - 11.6 (10.1) |
| 8P LOSS WILD-TYPE | 122 | 13 | 0.0 - 194.8 (15.5) |
Figure S12. Get High-res Image Gene #48: '8p loss' versus Clinical Feature #1: 'Time to Death'
P value = 0.000155 (Fisher's exact test), Q value = 0.087
Table S13. Gene #50: '9p loss' versus Clinical Feature #3: 'NEOPLASM.DISEASESTAGE'
| nPatients | STAGE I | STAGE II | STAGE III | STAGE IV |
|---|---|---|---|---|
| ALL | 77 | 11 | 31 | 10 |
| 9P LOSS MUTATED | 4 | 0 | 8 | 5 |
| 9P LOSS WILD-TYPE | 73 | 11 | 23 | 5 |
Figure S13. Get High-res Image Gene #50: '9p loss' versus Clinical Feature #3: 'NEOPLASM.DISEASESTAGE'
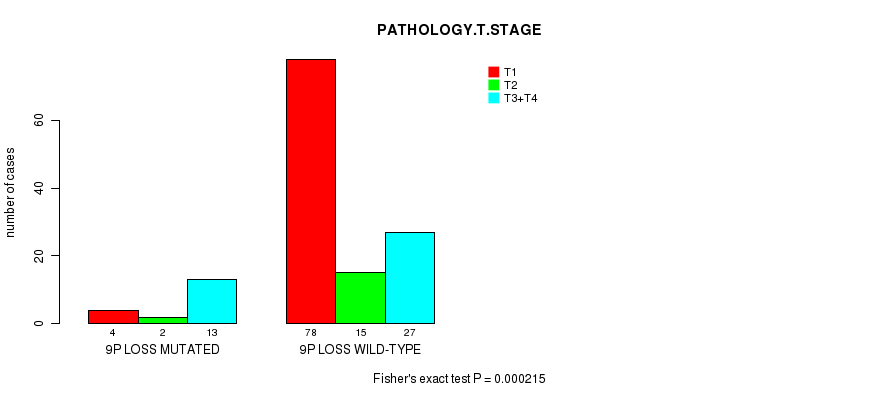
P value = 0.000215 (Fisher's exact test), Q value = 0.12
Table S14. Gene #50: '9p loss' versus Clinical Feature #4: 'PATHOLOGY.T.STAGE'
| nPatients | T1 | T2 | T3+T4 |
|---|---|---|---|
| ALL | 82 | 17 | 40 |
| 9P LOSS MUTATED | 4 | 2 | 13 |
| 9P LOSS WILD-TYPE | 78 | 15 | 27 |
Figure S14. Get High-res Image Gene #50: '9p loss' versus Clinical Feature #4: 'PATHOLOGY.T.STAGE'
P value = 0.00015 (Fisher's exact test), Q value = 0.085
Table S15. Gene #51: '9q loss' versus Clinical Feature #4: 'PATHOLOGY.T.STAGE'
| nPatients | T1 | T2 | T3+T4 |
|---|---|---|---|
| ALL | 82 | 17 | 40 |
| 9Q LOSS MUTATED | 5 | 1 | 14 |
| 9Q LOSS WILD-TYPE | 77 | 16 | 26 |
Figure S15. Get High-res Image Gene #51: '9q loss' versus Clinical Feature #4: 'PATHOLOGY.T.STAGE'

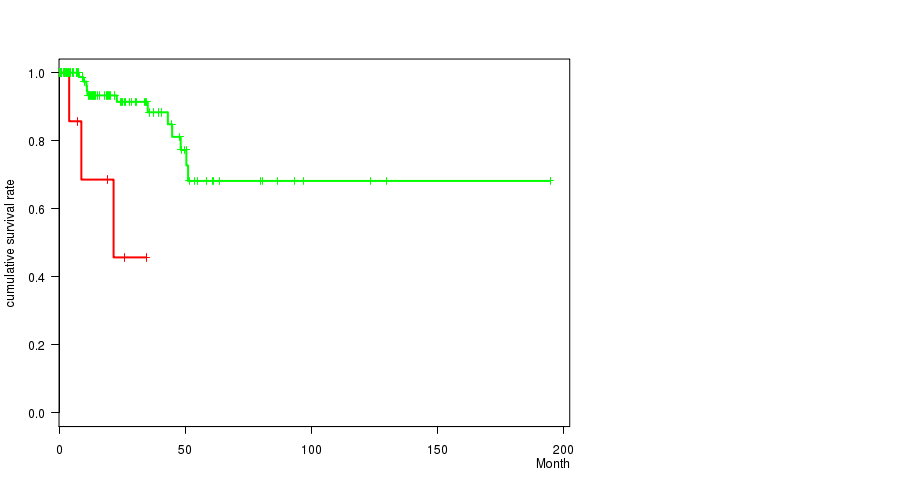
P value = 0.000286 (logrank test), Q value = 0.16
Table S16. Gene #54: '11p loss' versus Clinical Feature #1: 'Time to Death'
| nPatients | nDeath | Duration Range (Median), Month | |
|---|---|---|---|
| ALL | 127 | 15 | 0.0 - 194.8 (14.6) |
| 11P LOSS MUTATED | 9 | 3 | 0.7 - 34.5 (8.8) |
| 11P LOSS WILD-TYPE | 118 | 12 | 0.0 - 194.8 (14.6) |
Figure S16. Get High-res Image Gene #54: '11p loss' versus Clinical Feature #1: 'Time to Death'
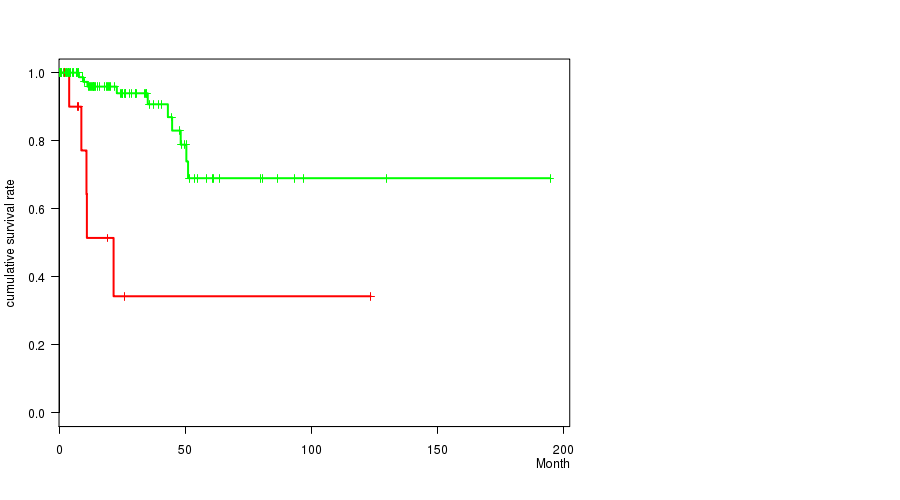
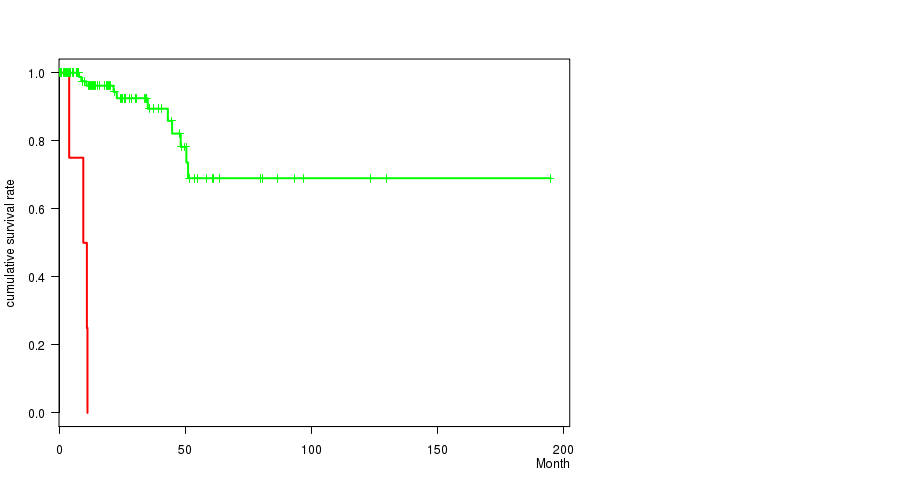
P value = 1.31e-05 (logrank test), Q value = 0.0074
Table S17. Gene #55: '11q loss' versus Clinical Feature #1: 'Time to Death'
| nPatients | nDeath | Duration Range (Median), Month | |
|---|---|---|---|
| ALL | 127 | 15 | 0.0 - 194.8 (14.6) |
| 11Q LOSS MUTATED | 12 | 5 | 2.0 - 123.6 (9.9) |
| 11Q LOSS WILD-TYPE | 115 | 10 | 0.0 - 194.8 (15.1) |
Figure S17. Get High-res Image Gene #55: '11q loss' versus Clinical Feature #1: 'Time to Death'
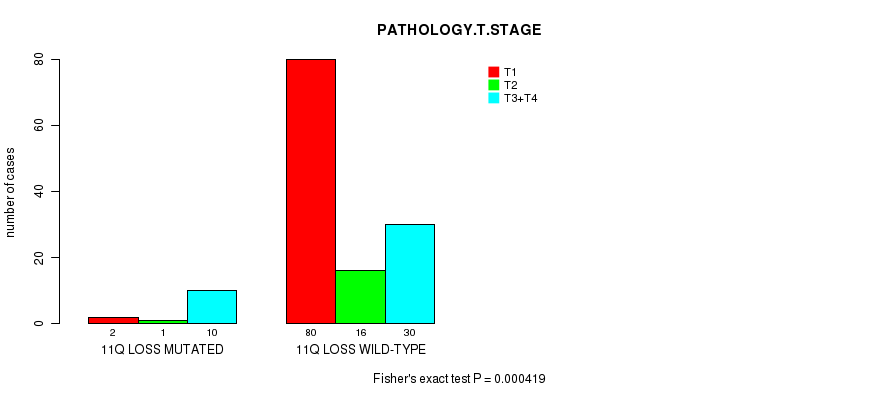
P value = 0.000419 (Fisher's exact test), Q value = 0.23
Table S18. Gene #55: '11q loss' versus Clinical Feature #4: 'PATHOLOGY.T.STAGE'
| nPatients | T1 | T2 | T3+T4 |
|---|---|---|---|
| ALL | 82 | 17 | 40 |
| 11Q LOSS MUTATED | 2 | 1 | 10 |
| 11Q LOSS WILD-TYPE | 80 | 16 | 30 |
Figure S18. Get High-res Image Gene #55: '11q loss' versus Clinical Feature #4: 'PATHOLOGY.T.STAGE'
P value = 0.000154 (logrank test), Q value = 0.087
Table S19. Gene #58: '15q loss' versus Clinical Feature #1: 'Time to Death'
| nPatients | nDeath | Duration Range (Median), Month | |
|---|---|---|---|
| ALL | 127 | 15 | 0.0 - 194.8 (14.6) |
| 15Q LOSS MUTATED | 14 | 4 | 0.1 - 34.8 (10.5) |
| 15Q LOSS WILD-TYPE | 113 | 11 | 0.0 - 194.8 (14.6) |
Figure S19. Get High-res Image Gene #58: '15q loss' versus Clinical Feature #1: 'Time to Death'
P value = 1.51e-05 (logrank test), Q value = 0.0086
Table S20. Gene #59: '16p loss' versus Clinical Feature #1: 'Time to Death'
| nPatients | nDeath | Duration Range (Median), Month | |
|---|---|---|---|
| ALL | 127 | 15 | 0.0 - 194.8 (14.6) |
| 16P LOSS MUTATED | 3 | 2 | 0.7 - 21.6 (11.1) |
| 16P LOSS WILD-TYPE | 124 | 13 | 0.0 - 194.8 (14.6) |
Figure S20. Get High-res Image Gene #59: '16p loss' versus Clinical Feature #1: 'Time to Death'

P value = 1.51e-05 (logrank test), Q value = 0.0086
Table S21. Gene #60: '16q loss' versus Clinical Feature #1: 'Time to Death'
| nPatients | nDeath | Duration Range (Median), Month | |
|---|---|---|---|
| ALL | 127 | 15 | 0.0 - 194.8 (14.6) |
| 16Q LOSS MUTATED | 3 | 2 | 0.7 - 21.6 (11.1) |
| 16Q LOSS WILD-TYPE | 124 | 13 | 0.0 - 194.8 (14.6) |
Figure S21. Get High-res Image Gene #60: '16q loss' versus Clinical Feature #1: 'Time to Death'
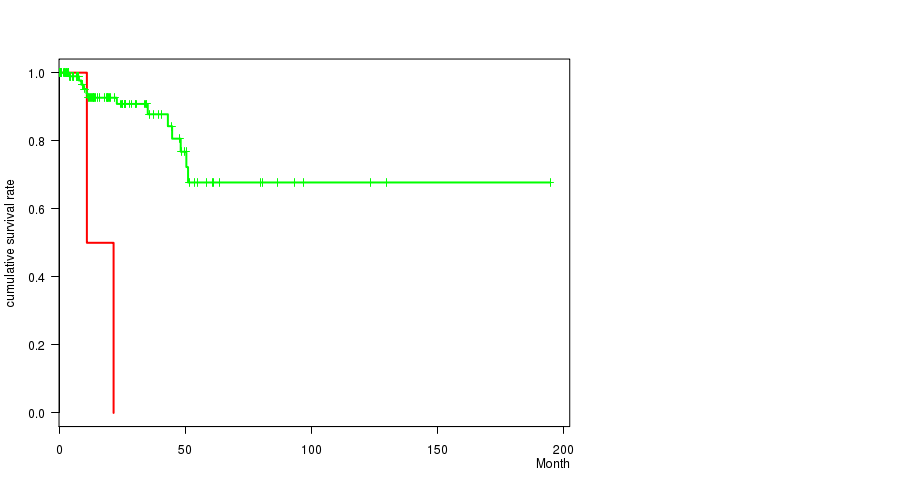
P value = 2.22e-16 (logrank test), Q value = 1.3e-13
Table S22. Gene #61: '17p loss' versus Clinical Feature #1: 'Time to Death'
| nPatients | nDeath | Duration Range (Median), Month | |
|---|---|---|---|
| ALL | 127 | 15 | 0.0 - 194.8 (14.6) |
| 17P LOSS MUTATED | 6 | 4 | 0.2 - 11.3 (6.8) |
| 17P LOSS WILD-TYPE | 121 | 11 | 0.0 - 194.8 (15.9) |
Figure S22. Get High-res Image Gene #61: '17p loss' versus Clinical Feature #1: 'Time to Death'
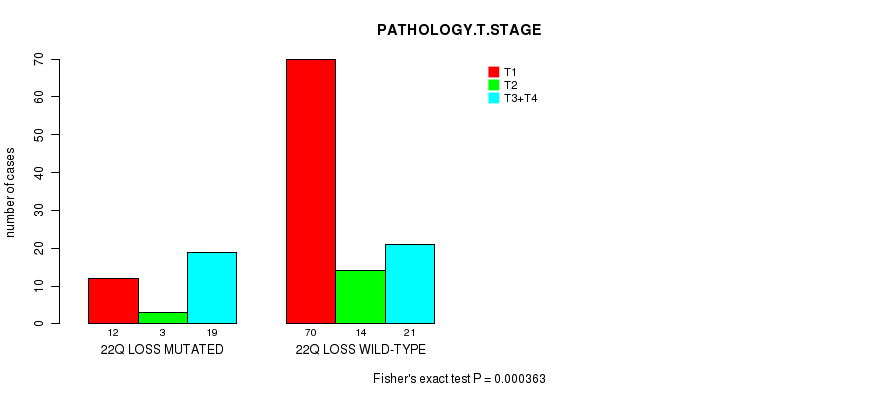
P value = 0.000363 (Fisher's exact test), Q value = 0.2
Table S23. Gene #67: '22q loss' versus Clinical Feature #4: 'PATHOLOGY.T.STAGE'
| nPatients | T1 | T2 | T3+T4 |
|---|---|---|---|
| ALL | 82 | 17 | 40 |
| 22Q LOSS MUTATED | 12 | 3 | 19 |
| 22Q LOSS WILD-TYPE | 70 | 14 | 21 |
Figure S23. Get High-res Image Gene #67: '22q loss' versus Clinical Feature #4: 'PATHOLOGY.T.STAGE'
-
Copy number data file = transformed.cor.cli.txt
-
Clinical data file = KIRP-TP.merged_data.txt
-
Number of patients = 139
-
Number of significantly arm-level cnvs = 68
-
Number of selected clinical features = 11
-
Exclude regions that fewer than K tumors have mutations, K = 3
For survival clinical features, the Kaplan-Meier survival curves of tumors with and without gene mutations were plotted and the statistical significance P values were estimated by logrank test (Bland and Altman 2004) using the 'survdiff' function in R
For continuous numerical clinical features, two-tailed Student's t test with unequal variance (Lehmann and Romano 2005) was applied to compare the clinical values between tumors with and without gene mutations using 't.test' function in R
For binary or multi-class clinical features (nominal or ordinal), two-tailed Fisher's exact tests (Fisher 1922) were used to estimate the P values using the 'fisher.test' function in R
For multiple hypothesis correction, Q value is the False Discovery Rate (FDR) analogue of the P value (Benjamini and Hochberg 1995), defined as the minimum FDR at which the test may be called significant. We used the 'Benjamini and Hochberg' method of 'p.adjust' function in R to convert P values into Q values.
In addition to the links below, the full results of the analysis summarized in this report can also be downloaded programmatically using firehose_get, or interactively from either the Broad GDAC website or TCGA Data Coordination Center Portal.