This pipeline computes the correlation between significant copy number variation (cnv focal) genes and molecular subtypes.
Testing the association between copy number variation 30 focal events and 6 molecular subtypes across 191 patients, 31 significant findings detected with P value < 0.05 and Q value < 0.25.
-
3p cnv correlated to 'CN_CNMF'.
-
3q cnv correlated to 'CN_CNMF'.
-
4p cnv correlated to 'CN_CNMF'.
-
4q cnv correlated to 'CN_CNMF'.
-
5q cnv correlated to 'CN_CNMF'.
-
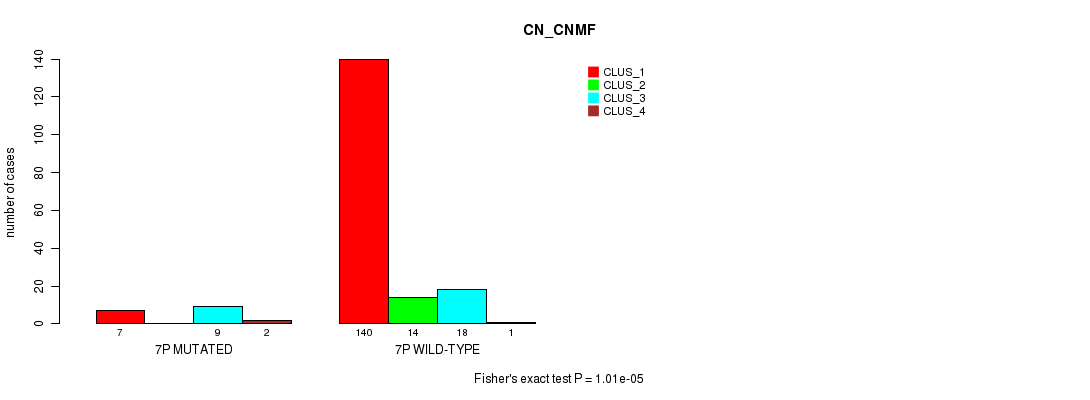
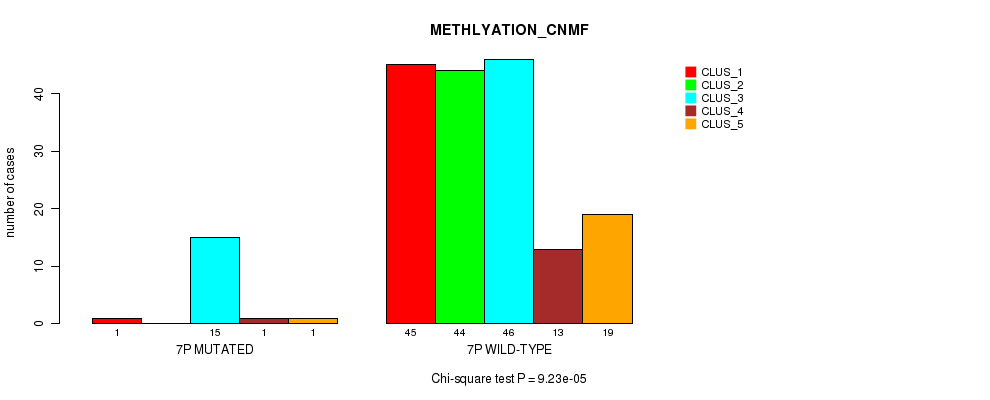
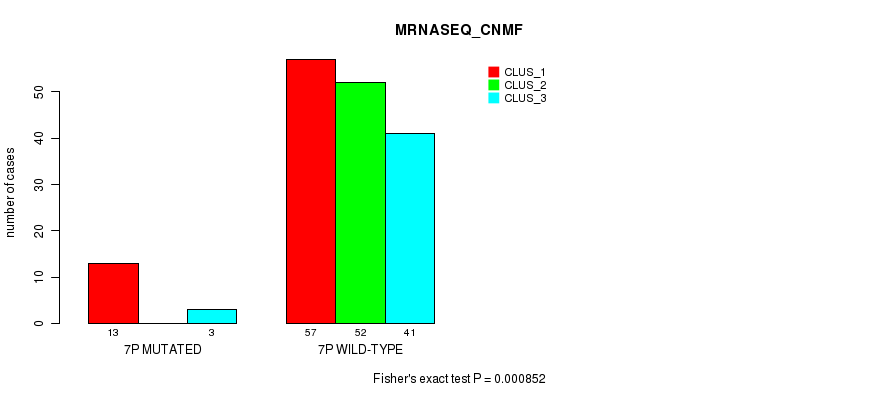
7p cnv correlated to 'CN_CNMF', 'METHLYATION_CNMF', 'MRNASEQ_CNMF', 'MRNASEQ_CHIERARCHICAL', 'MIRSEQ_CNMF', and 'MIRSEQ_CHIERARCHICAL'.
-
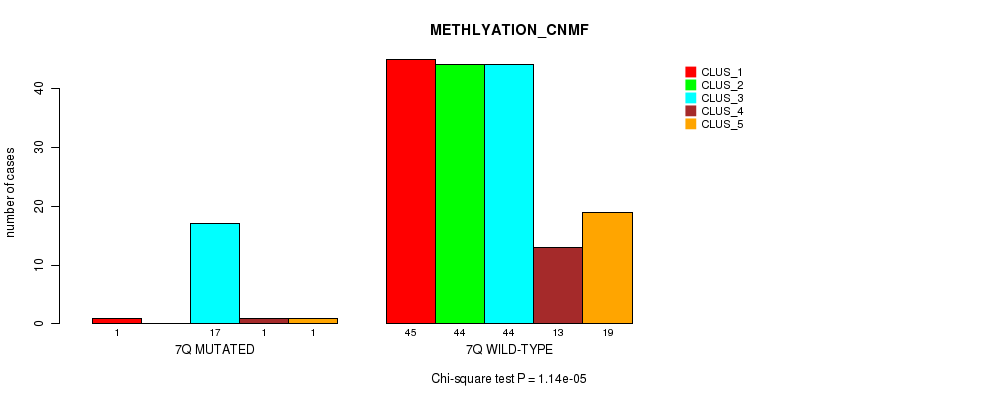
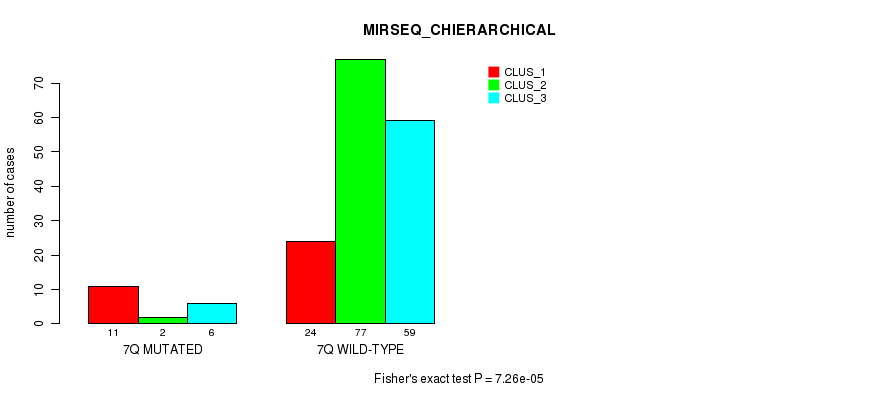
7q cnv correlated to 'CN_CNMF', 'METHLYATION_CNMF', and 'MIRSEQ_CHIERARCHICAL'.
-
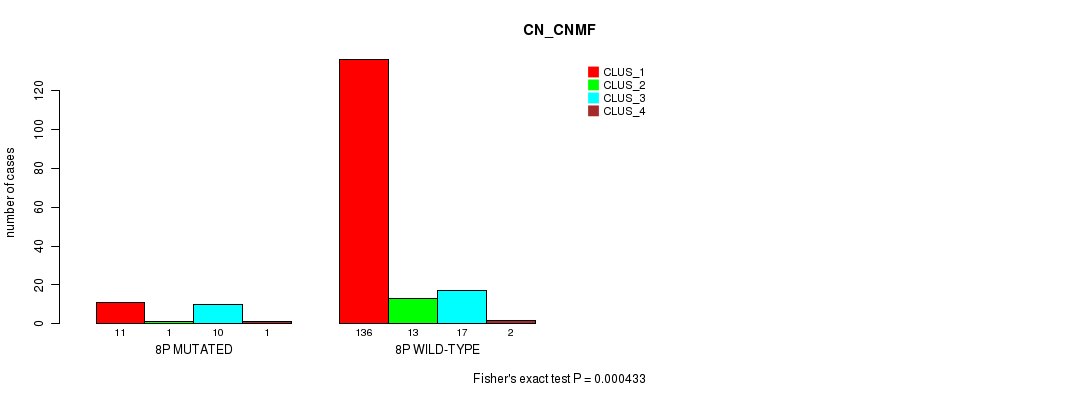
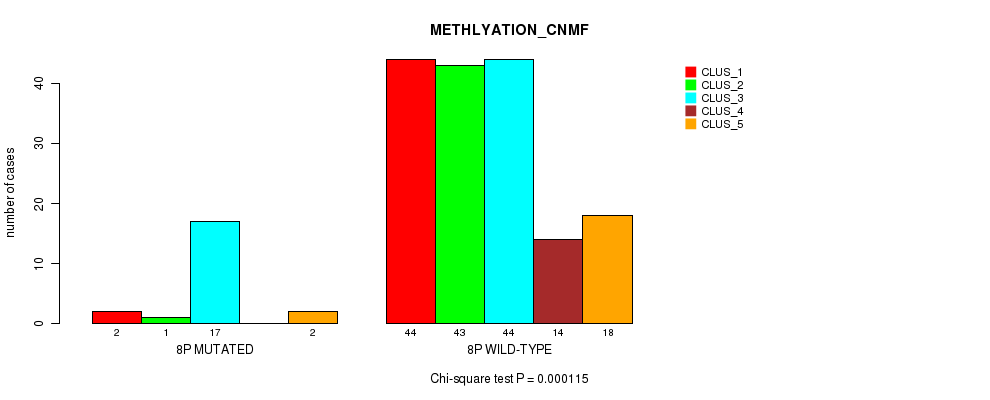
8p cnv correlated to 'CN_CNMF' and 'METHLYATION_CNMF'.
-
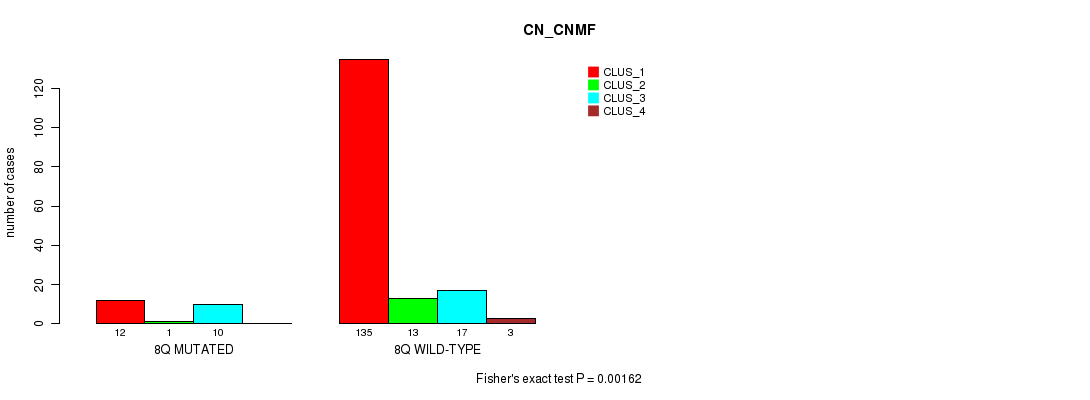
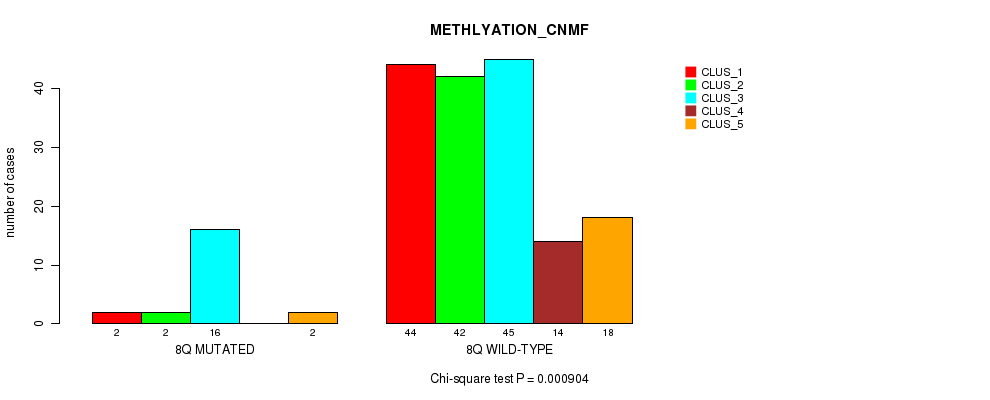
8q cnv correlated to 'CN_CNMF' and 'METHLYATION_CNMF'.
-
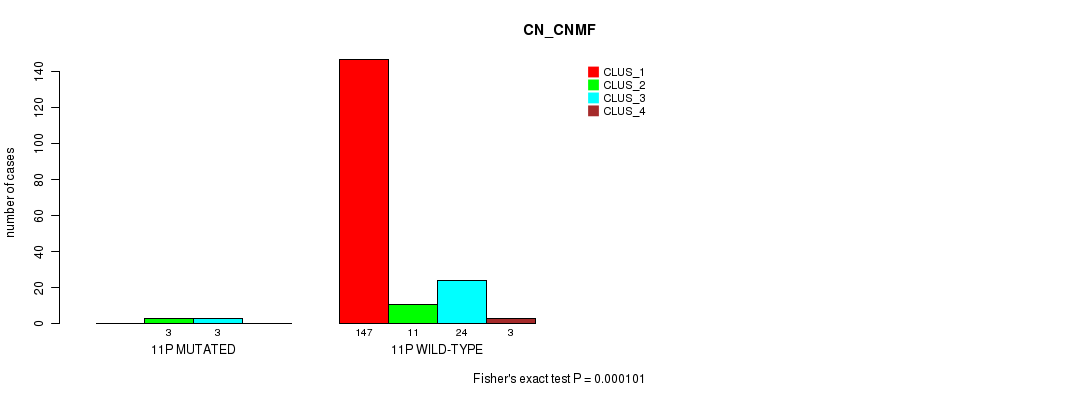
11p cnv correlated to 'CN_CNMF'.
-
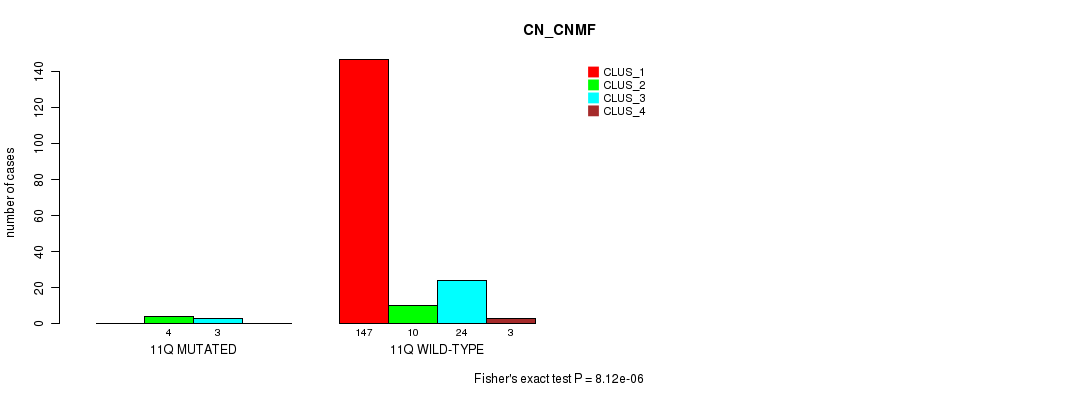
11q cnv correlated to 'CN_CNMF'.
-
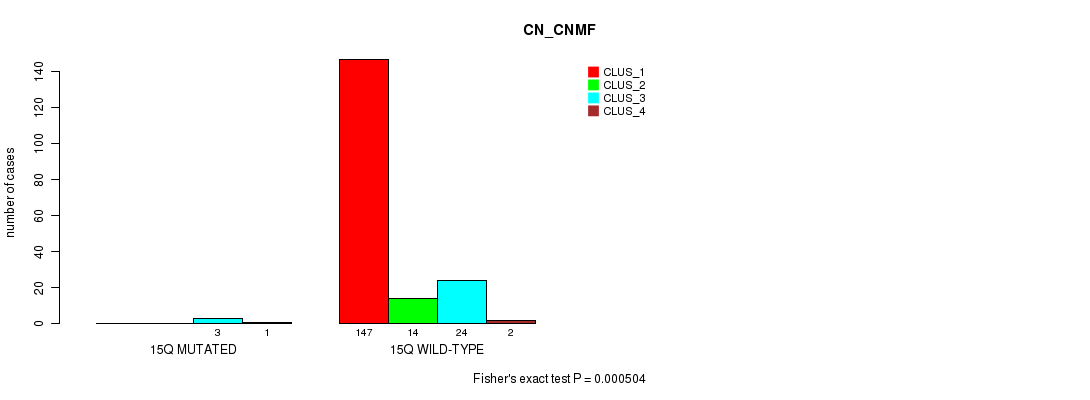
15q cnv correlated to 'CN_CNMF'.
-
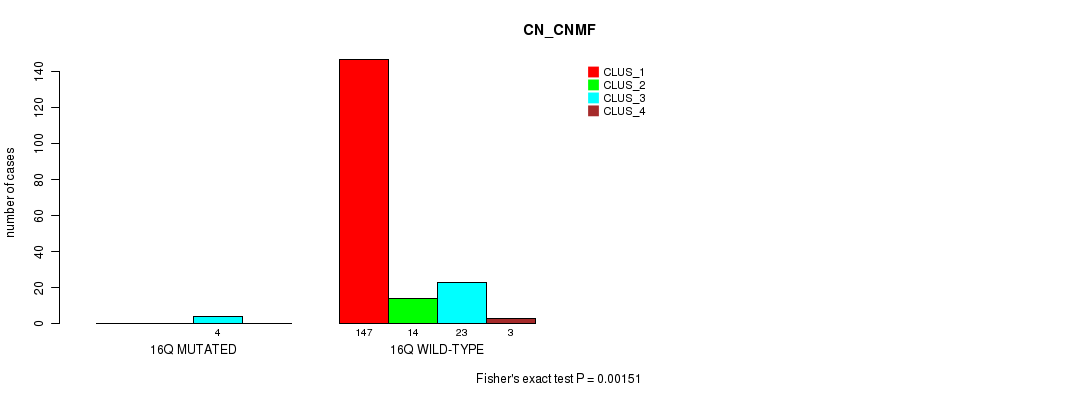
16q cnv correlated to 'CN_CNMF'.
-
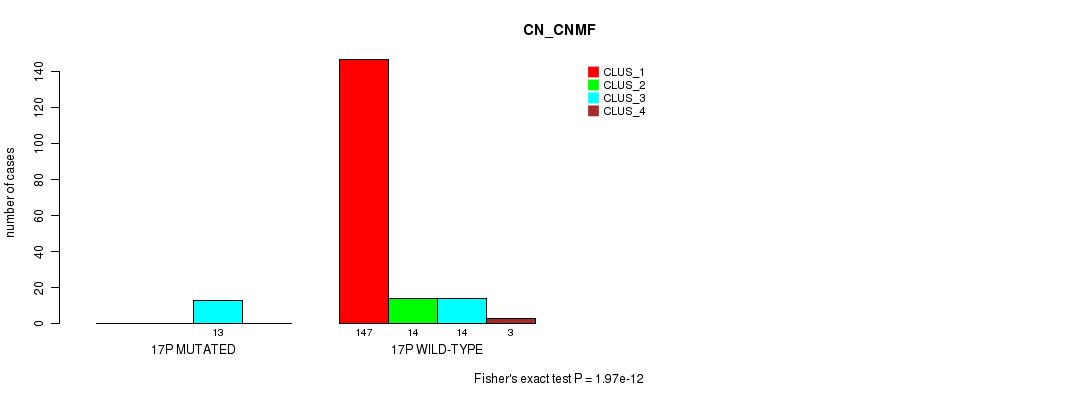
17p cnv correlated to 'CN_CNMF'.
-
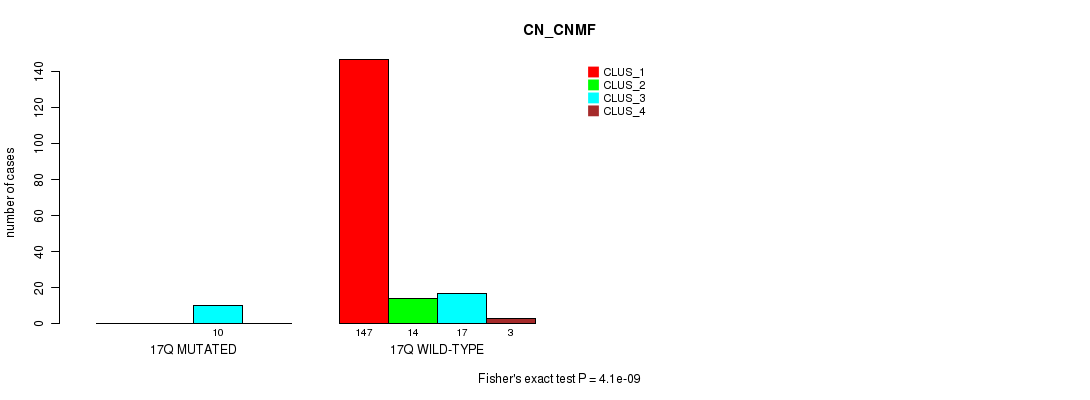
17q cnv correlated to 'CN_CNMF'.
-
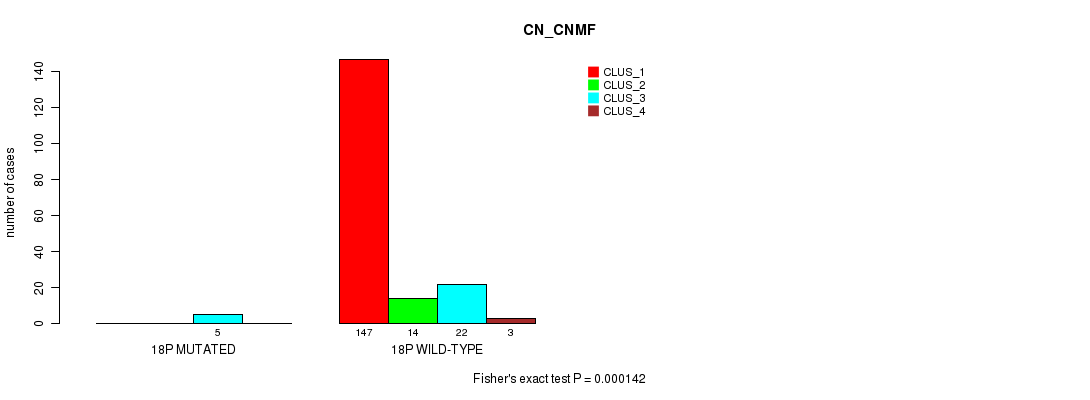
18p cnv correlated to 'CN_CNMF'.
-
18q cnv correlated to 'CN_CNMF'.
-
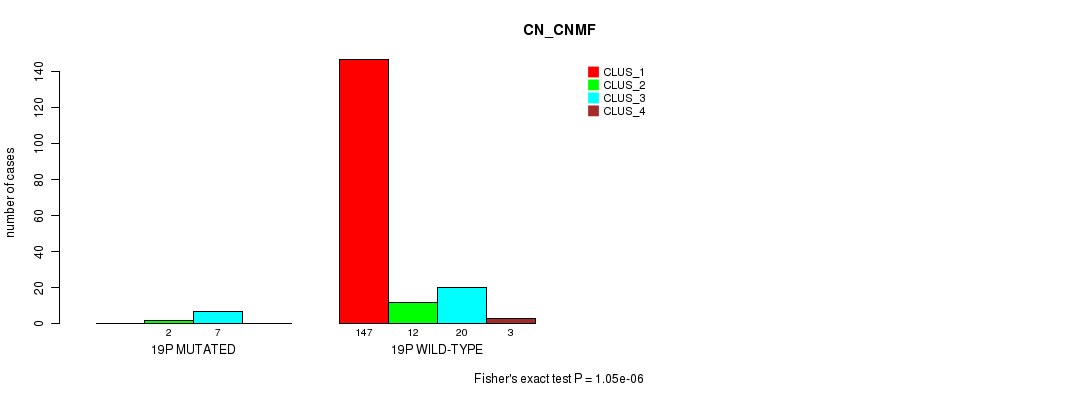
19p cnv correlated to 'CN_CNMF'.
-
19q cnv correlated to 'CN_CNMF'.
-
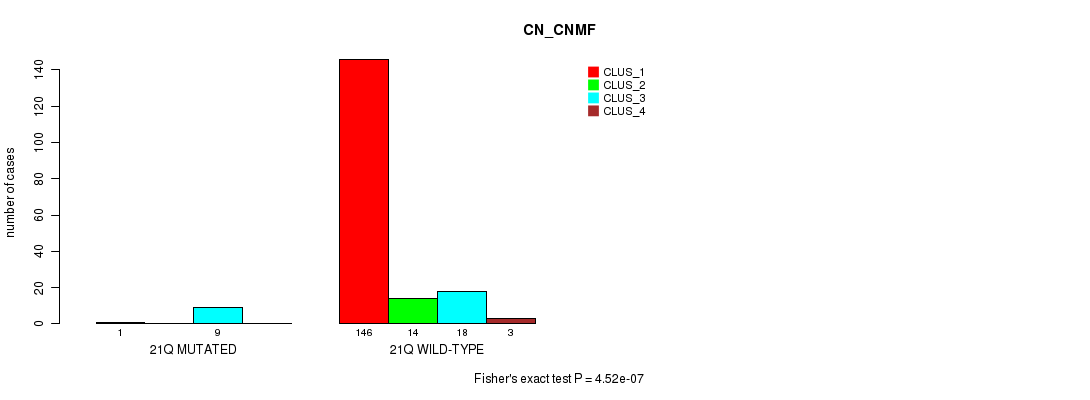
21q cnv correlated to 'CN_CNMF'.
-
22q cnv correlated to 'CN_CNMF'.
-
xq cnv correlated to 'CN_CNMF'.
Table 1. Get Full Table Overview of the association between significant copy number variation of 30 focal events and 6 molecular subtypes. Shown in the table are P values (Q values). Thresholded by P value < 0.05 and Q value < 0.25, 31 significant findings detected.
|
Clinical Features |
CN CNMF |
METHLYATION CNMF |
MRNASEQ CNMF |
MRNASEQ CHIERARCHICAL |
MIRSEQ CNMF |
MIRSEQ CHIERARCHICAL |
||
| nCNV (%) | nWild-Type | Fisher's exact test | Chi-square test | Fisher's exact test | Fisher's exact test | Fisher's exact test | Fisher's exact test | |
| 7p | 18 (9%) | 173 |
1.01e-05 (0.00173) |
9.23e-05 (0.0153) |
0.000852 (0.136) |
0.00141 (0.219) |
0.00123 (0.194) |
5.37e-05 (0.00902) |
| 7q | 20 (10%) | 171 |
3.95e-06 (0.000687) |
1.14e-05 (0.00195) |
0.00641 (0.885) |
0.0125 (1.00) |
0.00168 (0.25) |
7.26e-05 (0.0121) |
| 8p | 23 (12%) | 168 |
0.000433 (0.0702) |
0.000115 (0.0189) |
0.0138 (1.00) |
0.00397 (0.583) |
0.00452 (0.651) |
0.043 (1.00) |
| 8q | 23 (12%) | 168 |
0.00162 (0.243) |
0.000904 (0.144) |
0.0138 (1.00) |
0.00397 (0.583) |
0.00745 (1.00) |
0.114 (1.00) |
| 3p | 4 (2%) | 187 |
0.00151 (0.232) |
0.185 (1.00) |
0.467 (1.00) |
0.604 (1.00) |
0.0147 (1.00) |
0.0116 (1.00) |
| 3q | 4 (2%) | 187 |
0.00151 (0.232) |
0.185 (1.00) |
0.467 (1.00) |
0.604 (1.00) |
0.0147 (1.00) |
0.0116 (1.00) |
| 4p | 6 (3%) | 185 |
0.00126 (0.197) |
0.284 (1.00) |
1 (1.00) |
1 (1.00) |
0.895 (1.00) |
0.863 (1.00) |
| 4q | 6 (3%) | 185 |
0.00126 (0.197) |
0.284 (1.00) |
1 (1.00) |
1 (1.00) |
0.895 (1.00) |
0.863 (1.00) |
| 5q | 6 (3%) | 185 |
3.23e-05 (0.00549) |
0.0134 (1.00) |
0.224 (1.00) |
0.664 (1.00) |
0.0318 (1.00) |
0.0205 (1.00) |
| 11p | 6 (3%) | 185 |
0.000101 (0.0167) |
0.0134 (1.00) |
0.124 (1.00) |
0.665 (1.00) |
0.206 (1.00) |
0.139 (1.00) |
| 11q | 7 (4%) | 184 |
8.12e-06 (0.00141) |
0.00516 (0.733) |
0.0668 (1.00) |
0.425 (1.00) |
0.291 (1.00) |
0.271 (1.00) |
| 15q | 4 (2%) | 187 |
0.000504 (0.0811) |
0.654 (1.00) |
0.066 (1.00) |
0.301 (1.00) |
0.0228 (1.00) |
0.0116 (1.00) |
| 16q | 4 (2%) | 187 |
0.00151 (0.232) |
0.0808 (1.00) |
0.786 (1.00) |
1 (1.00) |
0.0147 (1.00) |
0.0116 (1.00) |
| 17p | 13 (7%) | 178 |
1.97e-12 (3.54e-10) |
0.00581 (0.808) |
0.151 (1.00) |
0.0624 (1.00) |
0.16 (1.00) |
0.00532 (0.745) |
| 17q | 10 (5%) | 181 |
4.1e-09 (7.35e-07) |
0.0499 (1.00) |
0.218 (1.00) |
0.167 (1.00) |
0.192 (1.00) |
0.00208 (0.308) |
| 18p | 5 (3%) | 186 |
0.000142 (0.0231) |
0.0335 (1.00) |
1 (1.00) |
1 (1.00) |
0.248 (1.00) |
0.329 (1.00) |
| 18q | 4 (2%) | 187 |
0.00151 (0.232) |
0.0808 (1.00) |
0.467 (1.00) |
1 (1.00) |
0.101 (1.00) |
0.0704 (1.00) |
| 19p | 9 (5%) | 182 |
1.05e-06 (0.000186) |
0.584 (1.00) |
0.597 (1.00) |
0.718 (1.00) |
1 (1.00) |
0.362 (1.00) |
| 19q | 9 (5%) | 182 |
1.05e-06 (0.000186) |
0.584 (1.00) |
0.597 (1.00) |
0.718 (1.00) |
1 (1.00) |
0.362 (1.00) |
| 21q | 10 (5%) | 181 |
4.52e-07 (8.05e-05) |
0.0509 (1.00) |
0.0349 (1.00) |
0.718 (1.00) |
0.023 (1.00) |
0.0731 (1.00) |
| 22q | 11 (6%) | 180 |
4.56e-05 (0.00771) |
0.00841 (1.00) |
0.0367 (1.00) |
0.101 (1.00) |
0.018 (1.00) |
0.0548 (1.00) |
| xq | 8 (4%) | 183 |
6.53e-07 (0.000116) |
0.106 (1.00) |
0.0668 (1.00) |
0.425 (1.00) |
0.0482 (1.00) |
0.0113 (1.00) |
| 1p | 3 (2%) | 188 |
0.00511 (0.731) |
0.185 (1.00) |
0.186 (1.00) |
0.552 (1.00) |
0.0923 (1.00) |
0.0481 (1.00) |
| 5p | 3 (2%) | 188 |
0.113 (1.00) |
0.658 (1.00) |
0.786 (1.00) |
1 (1.00) |
0.0618 (1.00) |
0.145 (1.00) |
| 9p | 3 (2%) | 188 |
0.113 (1.00) |
0.185 (1.00) |
0.186 (1.00) |
0.552 (1.00) |
0.0618 (1.00) |
0.0481 (1.00) |
| 9q | 3 (2%) | 188 |
0.113 (1.00) |
0.185 (1.00) |
0.186 (1.00) |
0.552 (1.00) |
0.0618 (1.00) |
0.0481 (1.00) |
| 10p | 3 (2%) | 188 |
0.012 (1.00) |
0.185 (1.00) |
0.186 (1.00) |
0.552 (1.00) |
0.552 (1.00) |
0.222 (1.00) |
| 10q | 4 (2%) | 187 |
0.00421 (0.611) |
0.0808 (1.00) |
0.066 (1.00) |
0.301 (1.00) |
0.248 (1.00) |
0.0704 (1.00) |
| 12p | 4 (2%) | 187 |
0.00809 (1.00) |
0.0759 (1.00) |
0.374 (1.00) |
0.301 (1.00) |
0.483 (1.00) |
0.0704 (1.00) |
| 13q | 7 (4%) | 184 |
0.00982 (1.00) |
0.00516 (0.733) |
0.0668 (1.00) |
0.0965 (1.00) |
0.735 (1.00) |
0.198 (1.00) |
P value = 0.00151 (Fisher's exact test), Q value = 0.23
Table S1. Gene #2: '3p' versus Molecular Subtype #1: 'CN_CNMF'
| nPatients | CLUS_1 | CLUS_2 | CLUS_3 | CLUS_4 |
|---|---|---|---|---|
| ALL | 147 | 14 | 27 | 3 |
| 3P MUTATED | 0 | 0 | 4 | 0 |
| 3P WILD-TYPE | 147 | 14 | 23 | 3 |
Figure S1. Get High-res Image Gene #2: '3p' versus Molecular Subtype #1: 'CN_CNMF'

P value = 0.00151 (Fisher's exact test), Q value = 0.23
Table S2. Gene #3: '3q' versus Molecular Subtype #1: 'CN_CNMF'
| nPatients | CLUS_1 | CLUS_2 | CLUS_3 | CLUS_4 |
|---|---|---|---|---|
| ALL | 147 | 14 | 27 | 3 |
| 3Q MUTATED | 0 | 0 | 4 | 0 |
| 3Q WILD-TYPE | 147 | 14 | 23 | 3 |
Figure S2. Get High-res Image Gene #3: '3q' versus Molecular Subtype #1: 'CN_CNMF'

P value = 0.00126 (Fisher's exact test), Q value = 0.2
Table S3. Gene #4: '4p' versus Molecular Subtype #1: 'CN_CNMF'
| nPatients | CLUS_1 | CLUS_2 | CLUS_3 | CLUS_4 |
|---|---|---|---|---|
| ALL | 147 | 14 | 27 | 3 |
| 4P MUTATED | 1 | 0 | 5 | 0 |
| 4P WILD-TYPE | 146 | 14 | 22 | 3 |
Figure S3. Get High-res Image Gene #4: '4p' versus Molecular Subtype #1: 'CN_CNMF'

P value = 0.00126 (Fisher's exact test), Q value = 0.2
Table S4. Gene #5: '4q' versus Molecular Subtype #1: 'CN_CNMF'
| nPatients | CLUS_1 | CLUS_2 | CLUS_3 | CLUS_4 |
|---|---|---|---|---|
| ALL | 147 | 14 | 27 | 3 |
| 4Q MUTATED | 1 | 0 | 5 | 0 |
| 4Q WILD-TYPE | 146 | 14 | 22 | 3 |
Figure S4. Get High-res Image Gene #5: '4q' versus Molecular Subtype #1: 'CN_CNMF'

P value = 3.23e-05 (Fisher's exact test), Q value = 0.0055
Table S5. Gene #7: '5q' versus Molecular Subtype #1: 'CN_CNMF'
| nPatients | CLUS_1 | CLUS_2 | CLUS_3 | CLUS_4 |
|---|---|---|---|---|
| ALL | 147 | 14 | 27 | 3 |
| 5Q MUTATED | 0 | 0 | 6 | 0 |
| 5Q WILD-TYPE | 147 | 14 | 21 | 3 |
Figure S5. Get High-res Image Gene #7: '5q' versus Molecular Subtype #1: 'CN_CNMF'

P value = 1.01e-05 (Fisher's exact test), Q value = 0.0017
Table S6. Gene #8: '7p' versus Molecular Subtype #1: 'CN_CNMF'
| nPatients | CLUS_1 | CLUS_2 | CLUS_3 | CLUS_4 |
|---|---|---|---|---|
| ALL | 147 | 14 | 27 | 3 |
| 7P MUTATED | 7 | 0 | 9 | 2 |
| 7P WILD-TYPE | 140 | 14 | 18 | 1 |
Figure S6. Get High-res Image Gene #8: '7p' versus Molecular Subtype #1: 'CN_CNMF'
P value = 9.23e-05 (Chi-square test), Q value = 0.015
Table S7. Gene #8: '7p' versus Molecular Subtype #2: 'METHLYATION_CNMF'
| nPatients | CLUS_1 | CLUS_2 | CLUS_3 | CLUS_4 | CLUS_5 |
|---|---|---|---|---|---|
| ALL | 46 | 44 | 61 | 14 | 20 |
| 7P MUTATED | 1 | 0 | 15 | 1 | 1 |
| 7P WILD-TYPE | 45 | 44 | 46 | 13 | 19 |
Figure S7. Get High-res Image Gene #8: '7p' versus Molecular Subtype #2: 'METHLYATION_CNMF'
P value = 0.000852 (Fisher's exact test), Q value = 0.14
Table S8. Gene #8: '7p' versus Molecular Subtype #3: 'MRNASEQ_CNMF'
| nPatients | CLUS_1 | CLUS_2 | CLUS_3 |
|---|---|---|---|
| ALL | 70 | 52 | 44 |
| 7P MUTATED | 13 | 0 | 3 |
| 7P WILD-TYPE | 57 | 52 | 41 |
Figure S8. Get High-res Image Gene #8: '7p' versus Molecular Subtype #3: 'MRNASEQ_CNMF'
P value = 0.00141 (Fisher's exact test), Q value = 0.22
Table S9. Gene #8: '7p' versus Molecular Subtype #4: 'MRNASEQ_CHIERARCHICAL'
| nPatients | CLUS_1 | CLUS_2 |
|---|---|---|
| ALL | 56 | 110 |
| 7P MUTATED | 0 | 16 |
| 7P WILD-TYPE | 56 | 94 |
Figure S9. Get High-res Image Gene #8: '7p' versus Molecular Subtype #4: 'MRNASEQ_CHIERARCHICAL'

P value = 0.00123 (Fisher's exact test), Q value = 0.19
Table S10. Gene #8: '7p' versus Molecular Subtype #5: 'MIRSEQ_CNMF'
| nPatients | CLUS_1 | CLUS_2 | CLUS_3 | CLUS_4 |
|---|---|---|---|---|
| ALL | 58 | 37 | 41 | 43 |
| 7P MUTATED | 1 | 10 | 3 | 4 |
| 7P WILD-TYPE | 57 | 27 | 38 | 39 |
Figure S10. Get High-res Image Gene #8: '7p' versus Molecular Subtype #5: 'MIRSEQ_CNMF'

P value = 5.37e-05 (Fisher's exact test), Q value = 0.009
Table S11. Gene #8: '7p' versus Molecular Subtype #6: 'MIRSEQ_CHIERARCHICAL'
| nPatients | CLUS_1 | CLUS_2 | CLUS_3 |
|---|---|---|---|
| ALL | 35 | 79 | 65 |
| 7P MUTATED | 11 | 2 | 5 |
| 7P WILD-TYPE | 24 | 77 | 60 |
Figure S11. Get High-res Image Gene #8: '7p' versus Molecular Subtype #6: 'MIRSEQ_CHIERARCHICAL'

P value = 3.95e-06 (Fisher's exact test), Q value = 0.00069
Table S12. Gene #9: '7q' versus Molecular Subtype #1: 'CN_CNMF'
| nPatients | CLUS_1 | CLUS_2 | CLUS_3 | CLUS_4 |
|---|---|---|---|---|
| ALL | 147 | 14 | 27 | 3 |
| 7Q MUTATED | 8 | 0 | 10 | 2 |
| 7Q WILD-TYPE | 139 | 14 | 17 | 1 |
Figure S12. Get High-res Image Gene #9: '7q' versus Molecular Subtype #1: 'CN_CNMF'

P value = 1.14e-05 (Chi-square test), Q value = 0.0019
Table S13. Gene #9: '7q' versus Molecular Subtype #2: 'METHLYATION_CNMF'
| nPatients | CLUS_1 | CLUS_2 | CLUS_3 | CLUS_4 | CLUS_5 |
|---|---|---|---|---|---|
| ALL | 46 | 44 | 61 | 14 | 20 |
| 7Q MUTATED | 1 | 0 | 17 | 1 | 1 |
| 7Q WILD-TYPE | 45 | 44 | 44 | 13 | 19 |
Figure S13. Get High-res Image Gene #9: '7q' versus Molecular Subtype #2: 'METHLYATION_CNMF'
P value = 7.26e-05 (Fisher's exact test), Q value = 0.012
Table S14. Gene #9: '7q' versus Molecular Subtype #6: 'MIRSEQ_CHIERARCHICAL'
| nPatients | CLUS_1 | CLUS_2 | CLUS_3 |
|---|---|---|---|
| ALL | 35 | 79 | 65 |
| 7Q MUTATED | 11 | 2 | 6 |
| 7Q WILD-TYPE | 24 | 77 | 59 |
Figure S14. Get High-res Image Gene #9: '7q' versus Molecular Subtype #6: 'MIRSEQ_CHIERARCHICAL'
P value = 0.000433 (Fisher's exact test), Q value = 0.07
Table S15. Gene #10: '8p' versus Molecular Subtype #1: 'CN_CNMF'
| nPatients | CLUS_1 | CLUS_2 | CLUS_3 | CLUS_4 |
|---|---|---|---|---|
| ALL | 147 | 14 | 27 | 3 |
| 8P MUTATED | 11 | 1 | 10 | 1 |
| 8P WILD-TYPE | 136 | 13 | 17 | 2 |
Figure S15. Get High-res Image Gene #10: '8p' versus Molecular Subtype #1: 'CN_CNMF'
P value = 0.000115 (Chi-square test), Q value = 0.019
Table S16. Gene #10: '8p' versus Molecular Subtype #2: 'METHLYATION_CNMF'
| nPatients | CLUS_1 | CLUS_2 | CLUS_3 | CLUS_4 | CLUS_5 |
|---|---|---|---|---|---|
| ALL | 46 | 44 | 61 | 14 | 20 |
| 8P MUTATED | 2 | 1 | 17 | 0 | 2 |
| 8P WILD-TYPE | 44 | 43 | 44 | 14 | 18 |
Figure S16. Get High-res Image Gene #10: '8p' versus Molecular Subtype #2: 'METHLYATION_CNMF'
P value = 0.00162 (Fisher's exact test), Q value = 0.24
Table S17. Gene #11: '8q' versus Molecular Subtype #1: 'CN_CNMF'
| nPatients | CLUS_1 | CLUS_2 | CLUS_3 | CLUS_4 |
|---|---|---|---|---|
| ALL | 147 | 14 | 27 | 3 |
| 8Q MUTATED | 12 | 1 | 10 | 0 |
| 8Q WILD-TYPE | 135 | 13 | 17 | 3 |
Figure S17. Get High-res Image Gene #11: '8q' versus Molecular Subtype #1: 'CN_CNMF'
P value = 0.000904 (Chi-square test), Q value = 0.14
Table S18. Gene #11: '8q' versus Molecular Subtype #2: 'METHLYATION_CNMF'
| nPatients | CLUS_1 | CLUS_2 | CLUS_3 | CLUS_4 | CLUS_5 |
|---|---|---|---|---|---|
| ALL | 46 | 44 | 61 | 14 | 20 |
| 8Q MUTATED | 2 | 2 | 16 | 0 | 2 |
| 8Q WILD-TYPE | 44 | 42 | 45 | 14 | 18 |
Figure S18. Get High-res Image Gene #11: '8q' versus Molecular Subtype #2: 'METHLYATION_CNMF'
P value = 0.000101 (Fisher's exact test), Q value = 0.017
Table S19. Gene #16: '11p' versus Molecular Subtype #1: 'CN_CNMF'
| nPatients | CLUS_1 | CLUS_2 | CLUS_3 | CLUS_4 |
|---|---|---|---|---|
| ALL | 147 | 14 | 27 | 3 |
| 11P MUTATED | 0 | 3 | 3 | 0 |
| 11P WILD-TYPE | 147 | 11 | 24 | 3 |
Figure S19. Get High-res Image Gene #16: '11p' versus Molecular Subtype #1: 'CN_CNMF'
P value = 8.12e-06 (Fisher's exact test), Q value = 0.0014
Table S20. Gene #17: '11q' versus Molecular Subtype #1: 'CN_CNMF'
| nPatients | CLUS_1 | CLUS_2 | CLUS_3 | CLUS_4 |
|---|---|---|---|---|
| ALL | 147 | 14 | 27 | 3 |
| 11Q MUTATED | 0 | 4 | 3 | 0 |
| 11Q WILD-TYPE | 147 | 10 | 24 | 3 |
Figure S20. Get High-res Image Gene #17: '11q' versus Molecular Subtype #1: 'CN_CNMF'
P value = 0.000504 (Fisher's exact test), Q value = 0.081
Table S21. Gene #20: '15q' versus Molecular Subtype #1: 'CN_CNMF'
| nPatients | CLUS_1 | CLUS_2 | CLUS_3 | CLUS_4 |
|---|---|---|---|---|
| ALL | 147 | 14 | 27 | 3 |
| 15Q MUTATED | 0 | 0 | 3 | 1 |
| 15Q WILD-TYPE | 147 | 14 | 24 | 2 |
Figure S21. Get High-res Image Gene #20: '15q' versus Molecular Subtype #1: 'CN_CNMF'
P value = 0.00151 (Fisher's exact test), Q value = 0.23
Table S22. Gene #21: '16q' versus Molecular Subtype #1: 'CN_CNMF'
| nPatients | CLUS_1 | CLUS_2 | CLUS_3 | CLUS_4 |
|---|---|---|---|---|
| ALL | 147 | 14 | 27 | 3 |
| 16Q MUTATED | 0 | 0 | 4 | 0 |
| 16Q WILD-TYPE | 147 | 14 | 23 | 3 |
Figure S22. Get High-res Image Gene #21: '16q' versus Molecular Subtype #1: 'CN_CNMF'
P value = 1.97e-12 (Fisher's exact test), Q value = 3.5e-10
Table S23. Gene #22: '17p' versus Molecular Subtype #1: 'CN_CNMF'
| nPatients | CLUS_1 | CLUS_2 | CLUS_3 | CLUS_4 |
|---|---|---|---|---|
| ALL | 147 | 14 | 27 | 3 |
| 17P MUTATED | 0 | 0 | 13 | 0 |
| 17P WILD-TYPE | 147 | 14 | 14 | 3 |
Figure S23. Get High-res Image Gene #22: '17p' versus Molecular Subtype #1: 'CN_CNMF'
P value = 4.1e-09 (Fisher's exact test), Q value = 7.3e-07
Table S24. Gene #23: '17q' versus Molecular Subtype #1: 'CN_CNMF'
| nPatients | CLUS_1 | CLUS_2 | CLUS_3 | CLUS_4 |
|---|---|---|---|---|
| ALL | 147 | 14 | 27 | 3 |
| 17Q MUTATED | 0 | 0 | 10 | 0 |
| 17Q WILD-TYPE | 147 | 14 | 17 | 3 |
Figure S24. Get High-res Image Gene #23: '17q' versus Molecular Subtype #1: 'CN_CNMF'
P value = 0.000142 (Fisher's exact test), Q value = 0.023
Table S25. Gene #24: '18p' versus Molecular Subtype #1: 'CN_CNMF'
| nPatients | CLUS_1 | CLUS_2 | CLUS_3 | CLUS_4 |
|---|---|---|---|---|
| ALL | 147 | 14 | 27 | 3 |
| 18P MUTATED | 0 | 0 | 5 | 0 |
| 18P WILD-TYPE | 147 | 14 | 22 | 3 |
Figure S25. Get High-res Image Gene #24: '18p' versus Molecular Subtype #1: 'CN_CNMF'
P value = 0.00151 (Fisher's exact test), Q value = 0.23
Table S26. Gene #25: '18q' versus Molecular Subtype #1: 'CN_CNMF'
| nPatients | CLUS_1 | CLUS_2 | CLUS_3 | CLUS_4 |
|---|---|---|---|---|
| ALL | 147 | 14 | 27 | 3 |
| 18Q MUTATED | 0 | 0 | 4 | 0 |
| 18Q WILD-TYPE | 147 | 14 | 23 | 3 |
Figure S26. Get High-res Image Gene #25: '18q' versus Molecular Subtype #1: 'CN_CNMF'

P value = 1.05e-06 (Fisher's exact test), Q value = 0.00019
Table S27. Gene #26: '19p' versus Molecular Subtype #1: 'CN_CNMF'
| nPatients | CLUS_1 | CLUS_2 | CLUS_3 | CLUS_4 |
|---|---|---|---|---|
| ALL | 147 | 14 | 27 | 3 |
| 19P MUTATED | 0 | 2 | 7 | 0 |
| 19P WILD-TYPE | 147 | 12 | 20 | 3 |
Figure S27. Get High-res Image Gene #26: '19p' versus Molecular Subtype #1: 'CN_CNMF'
P value = 1.05e-06 (Fisher's exact test), Q value = 0.00019
Table S28. Gene #27: '19q' versus Molecular Subtype #1: 'CN_CNMF'
| nPatients | CLUS_1 | CLUS_2 | CLUS_3 | CLUS_4 |
|---|---|---|---|---|
| ALL | 147 | 14 | 27 | 3 |
| 19Q MUTATED | 0 | 2 | 7 | 0 |
| 19Q WILD-TYPE | 147 | 12 | 20 | 3 |
Figure S28. Get High-res Image Gene #27: '19q' versus Molecular Subtype #1: 'CN_CNMF'

P value = 4.52e-07 (Fisher's exact test), Q value = 8e-05
Table S29. Gene #28: '21q' versus Molecular Subtype #1: 'CN_CNMF'
| nPatients | CLUS_1 | CLUS_2 | CLUS_3 | CLUS_4 |
|---|---|---|---|---|
| ALL | 147 | 14 | 27 | 3 |
| 21Q MUTATED | 1 | 0 | 9 | 0 |
| 21Q WILD-TYPE | 146 | 14 | 18 | 3 |
Figure S29. Get High-res Image Gene #28: '21q' versus Molecular Subtype #1: 'CN_CNMF'
P value = 4.56e-05 (Fisher's exact test), Q value = 0.0077
Table S30. Gene #29: '22q' versus Molecular Subtype #1: 'CN_CNMF'
| nPatients | CLUS_1 | CLUS_2 | CLUS_3 | CLUS_4 |
|---|---|---|---|---|
| ALL | 147 | 14 | 27 | 3 |
| 22Q MUTATED | 2 | 2 | 7 | 0 |
| 22Q WILD-TYPE | 145 | 12 | 20 | 3 |
Figure S30. Get High-res Image Gene #29: '22q' versus Molecular Subtype #1: 'CN_CNMF'

P value = 6.53e-07 (Fisher's exact test), Q value = 0.00012
Table S31. Gene #30: 'xq' versus Molecular Subtype #1: 'CN_CNMF'
| nPatients | CLUS_1 | CLUS_2 | CLUS_3 | CLUS_4 |
|---|---|---|---|---|
| ALL | 147 | 14 | 27 | 3 |
| XQ MUTATED | 0 | 1 | 5 | 2 |
| XQ WILD-TYPE | 147 | 13 | 22 | 1 |
Figure S31. Get High-res Image Gene #30: 'xq' versus Molecular Subtype #1: 'CN_CNMF'

-
Copy number data file = transformed.cor.cli.txt
-
Molecular subtype file = LAML-TB.transferedmergedcluster.txt
-
Number of patients = 191
-
Number of significantly focal cnvs = 30
-
Number of molecular subtypes = 6
-
Exclude genes that fewer than K tumors have alterations, K = 3
For binary or multi-class clinical features (nominal or ordinal), two-tailed Fisher's exact tests (Fisher 1922) were used to estimate the P values using the 'fisher.test' function in R
For multi-class clinical features (nominal or ordinal), Chi-square tests (Greenwood and Nikulin 1996) were used to estimate the P values using the 'chisq.test' function in R
For multiple hypothesis correction, Q value is the False Discovery Rate (FDR) analogue of the P value (Benjamini and Hochberg 1995), defined as the minimum FDR at which the test may be called significant. We used the 'Benjamini and Hochberg' method of 'p.adjust' function in R to convert P values into Q values.
In addition to the links below, the full results of the analysis summarized in this report can also be downloaded programmatically using firehose_get, or interactively from either the Broad GDAC website or TCGA Data Coordination Center Portal.