This pipeline computes the correlation between significant arm-level copy number variations (cnvs) and selected clinical features.
Testing the association between copy number variation 72 arm-level events and 6 clinical features across 276 patients, 18 significant findings detected with Q value < 0.25.
-
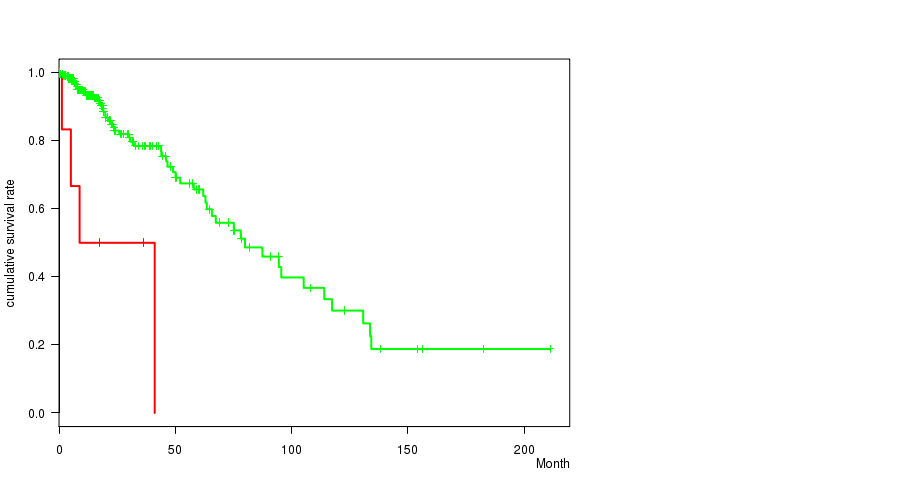
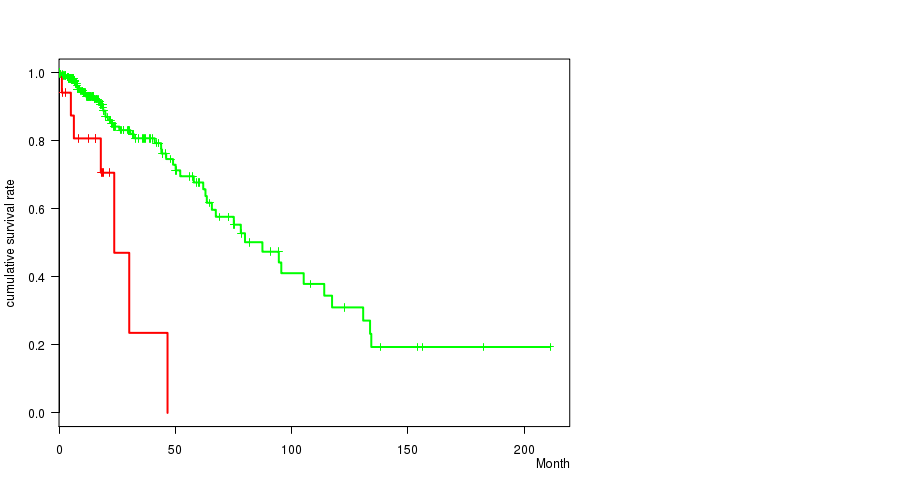
3q gain cnv correlated to 'Time to Death'.
-
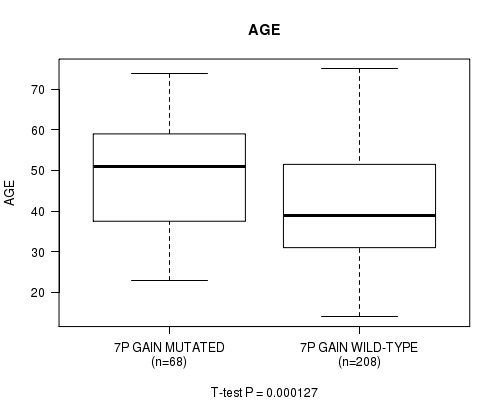
7p gain cnv correlated to 'AGE'.
-
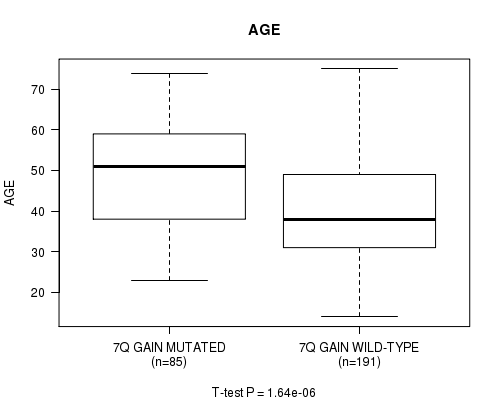
7q gain cnv correlated to 'AGE'.
-
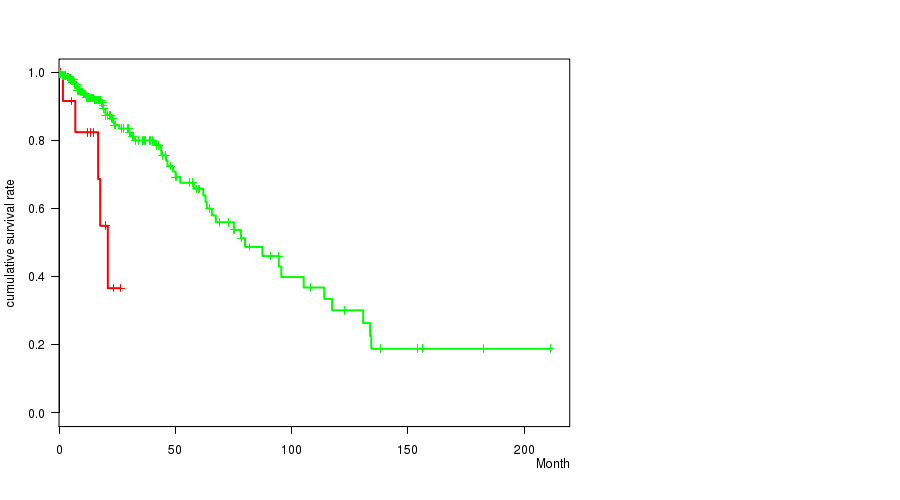
19q gain cnv correlated to 'Time to Death'.
-
20p gain cnv correlated to 'Time to Death' and 'AGE'.
-
20q gain cnv correlated to 'Time to Death' and 'AGE'.
-
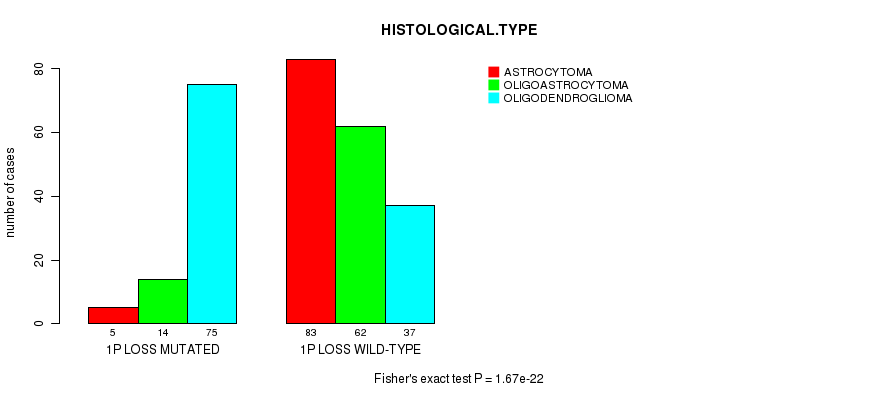
1p loss cnv correlated to 'HISTOLOGICAL.TYPE'.
-
6p loss cnv correlated to 'Time to Death'.
-
6q loss cnv correlated to 'Time to Death'.
-
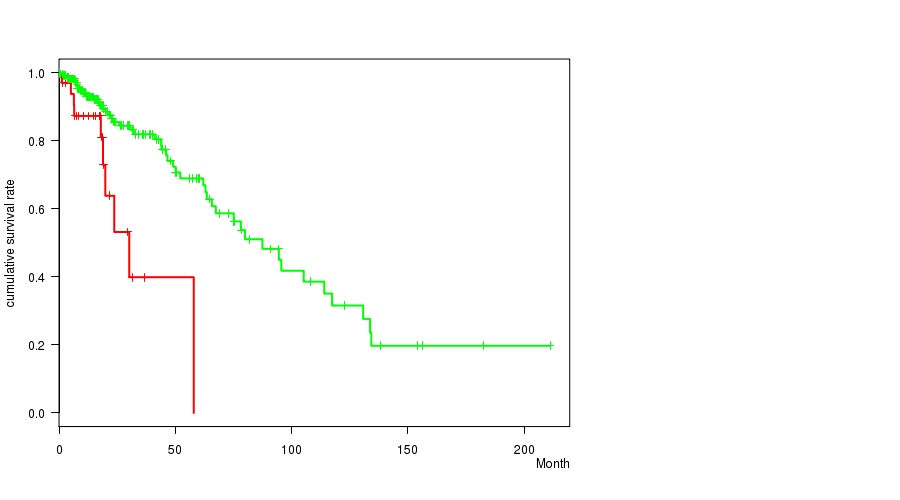
9p loss cnv correlated to 'Time to Death'.
-
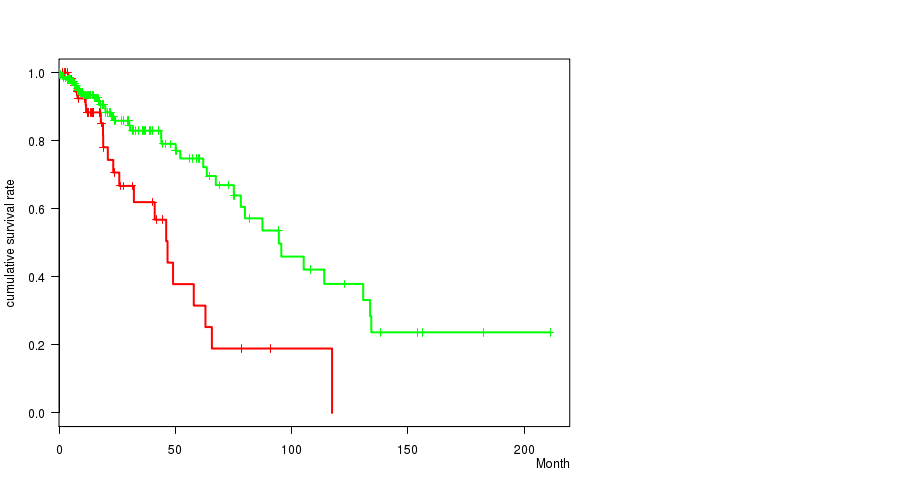
10p loss cnv correlated to 'Time to Death' and 'AGE'.
-
10q loss cnv correlated to 'Time to Death' and 'AGE'.
-
11q loss cnv correlated to 'Time to Death'.
-
19q loss cnv correlated to 'HISTOLOGICAL.TYPE'.
Table 1. Get Full Table Overview of the association between significant copy number variation of 72 arm-level events and 6 clinical features. Shown in the table are P values (Q values). Thresholded by Q value < 0.25, 18 significant findings detected.
|
Clinical Features |
Time to Death |
AGE | GENDER |
KARNOFSKY PERFORMANCE SCORE |
HISTOLOGICAL TYPE |
RADIATIONS RADIATION REGIMENINDICATION |
||
| nCNV (%) | nWild-Type | logrank test | t-test | Fisher's exact test | t-test | Fisher's exact test | Fisher's exact test | |
| 20p gain | 24 (9%) | 252 |
1.78e-07 (7.52e-05) |
3.27e-05 (0.0137) |
0.521 (1.00) |
0.891 (1.00) |
0.588 (1.00) |
0.823 (1.00) |
| 20q gain | 25 (9%) | 251 |
1.23e-07 (5.2e-05) |
0.000317 (0.131) |
0.148 (1.00) |
0.678 (1.00) |
0.722 (1.00) |
0.823 (1.00) |
| 10p loss | 44 (16%) | 232 |
4.5e-13 (1.92e-10) |
1.92e-10 (8.15e-08) |
0.0697 (1.00) |
0.0763 (1.00) |
0.00125 (0.509) |
0.486 (1.00) |
| 10q loss | 52 (19%) | 224 |
3.22e-06 (0.00135) |
3.11e-09 (1.32e-06) |
0.0315 (1.00) |
0.222 (1.00) |
0.00181 (0.733) |
0.624 (1.00) |
| 3q gain | 7 (3%) | 269 |
8.71e-05 (0.0363) |
0.0968 (1.00) |
0.707 (1.00) |
0.305 (1.00) |
0.0718 (1.00) |
0.685 (1.00) |
| 7p gain | 68 (25%) | 208 |
0.00425 (1.00) |
0.000127 (0.0527) |
0.208 (1.00) |
0.473 (1.00) |
0.249 (1.00) |
0.552 (1.00) |
| 7q gain | 85 (31%) | 191 |
0.00186 (0.748) |
1.64e-06 (0.000688) |
0.15 (1.00) |
0.227 (1.00) |
0.205 (1.00) |
0.677 (1.00) |
| 19q gain | 14 (5%) | 262 |
0.000574 (0.236) |
0.00177 (0.717) |
0.584 (1.00) |
0.741 (1.00) |
0.158 (1.00) |
0.774 (1.00) |
| 1p loss | 94 (34%) | 182 |
0.0766 (1.00) |
0.0102 (1.00) |
0.525 (1.00) |
0.668 (1.00) |
1.67e-22 (7.15e-20) |
0.057 (1.00) |
| 6p loss | 18 (7%) | 258 |
7.16e-05 (0.0299) |
0.468 (1.00) |
1 (1.00) |
0.384 (1.00) |
0.0979 (1.00) |
0.798 (1.00) |
| 6q loss | 35 (13%) | 241 |
0.000547 (0.225) |
0.0864 (1.00) |
0.587 (1.00) |
0.147 (1.00) |
0.00121 (0.495) |
0.176 (1.00) |
| 9p loss | 63 (23%) | 213 |
0.000449 (0.185) |
0.0389 (1.00) |
0.195 (1.00) |
0.37 (1.00) |
0.149 (1.00) |
0.0466 (1.00) |
| 11q loss | 13 (5%) | 263 |
0.00021 (0.0871) |
0.39 (1.00) |
0.582 (1.00) |
0.127 (1.00) |
0.157 (1.00) |
0.235 (1.00) |
| 19q loss | 110 (40%) | 166 |
0.246 (1.00) |
0.0909 (1.00) |
0.902 (1.00) |
0.699 (1.00) |
8.9e-19 (3.8e-16) |
0.188 (1.00) |
| 1p gain | 9 (3%) | 267 |
0.002 (0.803) |
0.0454 (1.00) |
0.31 (1.00) |
0.0178 (1.00) |
0.00986 (1.00) |
1 (1.00) |
| 1q gain | 14 (5%) | 262 |
0.43 (1.00) |
0.000704 (0.289) |
0.179 (1.00) |
0.241 (1.00) |
0.325 (1.00) |
0.774 (1.00) |
| 2p gain | 6 (2%) | 270 |
0.575 (1.00) |
0.135 (1.00) |
1 (1.00) |
0.406 (1.00) |
0.671 (1.00) |
1 (1.00) |
| 2q gain | 5 (2%) | 271 |
0.897 (1.00) |
0.287 (1.00) |
0.664 (1.00) |
0.406 (1.00) |
0.525 (1.00) |
0.659 (1.00) |
| 3p gain | 7 (3%) | 269 |
0.00604 (1.00) |
0.102 (1.00) |
0.254 (1.00) |
0.773 (1.00) |
0.183 (1.00) |
0.685 (1.00) |
| 4p gain | 6 (2%) | 270 |
0.32 (1.00) |
0.974 (1.00) |
0.223 (1.00) |
0.854 (1.00) |
0.156 (1.00) |
0.668 (1.00) |
| 6p gain | 5 (2%) | 271 |
0.736 (1.00) |
0.332 (1.00) |
0.184 (1.00) |
0.0178 (1.00) |
0.525 (1.00) |
1 (1.00) |
| 8p gain | 24 (9%) | 252 |
0.418 (1.00) |
0.995 (1.00) |
0.0908 (1.00) |
0.546 (1.00) |
0.305 (1.00) |
0.823 (1.00) |
| 8q gain | 31 (11%) | 245 |
0.424 (1.00) |
0.249 (1.00) |
0.127 (1.00) |
0.163 (1.00) |
0.0317 (1.00) |
1 (1.00) |
| 9p gain | 10 (4%) | 266 |
0.0062 (1.00) |
0.023 (1.00) |
0.195 (1.00) |
0.866 (1.00) |
0.781 (1.00) |
1 (1.00) |
| 9q gain | 12 (4%) | 264 |
0.0016 (0.651) |
0.0345 (1.00) |
0.0143 (1.00) |
0.708 (1.00) |
0.339 (1.00) |
0.757 (1.00) |
| 10p gain | 30 (11%) | 246 |
0.902 (1.00) |
0.0257 (1.00) |
0.0318 (1.00) |
0.00466 (1.00) |
0.041 (1.00) |
0.00362 (1.00) |
| 10q gain | 4 (1%) | 272 |
0.74 (1.00) |
0.104 (1.00) |
0.127 (1.00) |
0.234 (1.00) |
0.1 (1.00) |
|
| 11p gain | 19 (7%) | 257 |
0.692 (1.00) |
0.0488 (1.00) |
0.343 (1.00) |
0.739 (1.00) |
0.498 (1.00) |
1 (1.00) |
| 11q gain | 32 (12%) | 244 |
0.78 (1.00) |
0.024 (1.00) |
0.259 (1.00) |
0.922 (1.00) |
0.572 (1.00) |
1 (1.00) |
| 12p gain | 23 (8%) | 253 |
0.548 (1.00) |
0.825 (1.00) |
0.131 (1.00) |
0.358 (1.00) |
1 (1.00) |
0.643 (1.00) |
| 12q gain | 10 (4%) | 266 |
0.0199 (1.00) |
0.435 (1.00) |
0.351 (1.00) |
0.92 (1.00) |
0.509 (1.00) |
|
| 14q gain | 3 (1%) | 273 |
0.491 (1.00) |
0.371 (1.00) |
1 (1.00) |
1 (1.00) |
0.244 (1.00) |
|
| 15q gain | 4 (1%) | 272 |
0.347 (1.00) |
0.0736 (1.00) |
0.627 (1.00) |
0.386 (1.00) |
0.687 (1.00) |
0.597 (1.00) |
| 16p gain | 10 (4%) | 266 |
0.284 (1.00) |
0.109 (1.00) |
1 (1.00) |
0.617 (1.00) |
0.156 (1.00) |
0.732 (1.00) |
| 16q gain | 11 (4%) | 265 |
0.135 (1.00) |
0.284 (1.00) |
0.759 (1.00) |
0.386 (1.00) |
0.085 (1.00) |
0.341 (1.00) |
| 17p gain | 8 (3%) | 268 |
0.0639 (1.00) |
0.119 (1.00) |
0.295 (1.00) |
0.915 (1.00) |
0.161 (1.00) |
0.715 (1.00) |
| 17q gain | 9 (3%) | 267 |
0.0704 (1.00) |
0.25 (1.00) |
0.513 (1.00) |
0.763 (1.00) |
0.528 (1.00) |
1 (1.00) |
| 18p gain | 9 (3%) | 267 |
0.0637 (1.00) |
0.878 (1.00) |
1 (1.00) |
0.143 (1.00) |
0.296 (1.00) |
0.723 (1.00) |
| 18q gain | 7 (3%) | 269 |
0.129 (1.00) |
0.568 (1.00) |
1 (1.00) |
0.224 (1.00) |
0.889 (1.00) |
0.435 (1.00) |
| 19p gain | 49 (18%) | 227 |
0.26 (1.00) |
0.00213 (0.852) |
0.876 (1.00) |
0.608 (1.00) |
0.00732 (1.00) |
0.867 (1.00) |
| 21q gain | 14 (5%) | 262 |
0.355 (1.00) |
0.0903 (1.00) |
0.789 (1.00) |
0.391 (1.00) |
0.206 (1.00) |
0.774 (1.00) |
| 22q gain | 7 (3%) | 269 |
0.251 (1.00) |
0.232 (1.00) |
0.707 (1.00) |
0.773 (1.00) |
0.061 (1.00) |
0.685 (1.00) |
| xq gain | 23 (8%) | 253 |
0.518 (1.00) |
0.401 (1.00) |
0.0787 (1.00) |
0.536 (1.00) |
0.306 (1.00) |
0.489 (1.00) |
| 1q loss | 15 (5%) | 261 |
0.867 (1.00) |
0.059 (1.00) |
0.603 (1.00) |
0.0921 (1.00) |
0.0299 (1.00) |
0.573 (1.00) |
| 2p loss | 11 (4%) | 265 |
0.17 (1.00) |
0.553 (1.00) |
0.234 (1.00) |
0.564 (1.00) |
0.5 (1.00) |
1 (1.00) |
| 2q loss | 10 (4%) | 266 |
0.851 (1.00) |
0.0436 (1.00) |
0.351 (1.00) |
0.816 (1.00) |
0.172 (1.00) |
1 (1.00) |
| 3p loss | 13 (5%) | 263 |
0.0298 (1.00) |
0.385 (1.00) |
0.777 (1.00) |
0.0718 (1.00) |
0.517 (1.00) |
1 (1.00) |
| 3q loss | 17 (6%) | 259 |
0.0454 (1.00) |
0.806 (1.00) |
0.21 (1.00) |
0.599 (1.00) |
0.736 (1.00) |
0.792 (1.00) |
| 4p loss | 43 (16%) | 233 |
0.829 (1.00) |
0.00398 (1.00) |
0.619 (1.00) |
0.4 (1.00) |
0.0165 (1.00) |
0.724 (1.00) |
| 4q loss | 54 (20%) | 222 |
0.711 (1.00) |
0.115 (1.00) |
0.447 (1.00) |
0.626 (1.00) |
0.00958 (1.00) |
0.628 (1.00) |
| 5p loss | 26 (9%) | 250 |
0.468 (1.00) |
0.0875 (1.00) |
0.837 (1.00) |
0.225 (1.00) |
0.015 (1.00) |
0.125 (1.00) |
| 5q loss | 23 (8%) | 253 |
0.113 (1.00) |
0.459 (1.00) |
0.663 (1.00) |
0.751 (1.00) |
0.179 (1.00) |
0.106 (1.00) |
| 8p loss | 10 (4%) | 266 |
0.04 (1.00) |
0.288 (1.00) |
0.757 (1.00) |
0.447 (1.00) |
0.156 (1.00) |
0.732 (1.00) |
| 8q loss | 7 (3%) | 269 |
0.00718 (1.00) |
0.454 (1.00) |
0.707 (1.00) |
0.391 (1.00) |
0.43 (1.00) |
1 (1.00) |
| 9q loss | 25 (9%) | 251 |
0.00717 (1.00) |
0.111 (1.00) |
0.675 (1.00) |
0.0775 (1.00) |
0.747 (1.00) |
1 (1.00) |
| 11p loss | 38 (14%) | 238 |
0.285 (1.00) |
0.166 (1.00) |
0.387 (1.00) |
0.812 (1.00) |
0.166 (1.00) |
0.852 (1.00) |
| 12p loss | 13 (5%) | 263 |
0.673 (1.00) |
0.372 (1.00) |
0.582 (1.00) |
0.251 (1.00) |
0.211 (1.00) |
0.762 (1.00) |
| 12q loss | 26 (9%) | 250 |
0.566 (1.00) |
0.6 (1.00) |
0.685 (1.00) |
0.599 (1.00) |
0.0527 (1.00) |
0.511 (1.00) |
| 13q loss | 68 (25%) | 208 |
0.272 (1.00) |
0.607 (1.00) |
0.401 (1.00) |
0.837 (1.00) |
0.133 (1.00) |
0.0376 (1.00) |
| 14q loss | 39 (14%) | 237 |
0.00301 (1.00) |
0.00813 (1.00) |
0.303 (1.00) |
0.143 (1.00) |
0.388 (1.00) |
0.712 (1.00) |
| 15q loss | 22 (8%) | 254 |
0.313 (1.00) |
0.545 (1.00) |
0.38 (1.00) |
0.732 (1.00) |
0.96 (1.00) |
0.642 (1.00) |
| 16p loss | 8 (3%) | 268 |
0.208 (1.00) |
0.00922 (1.00) |
0.73 (1.00) |
0.194 (1.00) |
1 (1.00) |
1 (1.00) |
| 16q loss | 14 (5%) | 262 |
0.0727 (1.00) |
0.00446 (1.00) |
0.789 (1.00) |
0.816 (1.00) |
0.736 (1.00) |
0.774 (1.00) |
| 17p loss | 12 (4%) | 264 |
0.000774 (0.317) |
0.0538 (1.00) |
0.395 (1.00) |
0.0247 (1.00) |
0.653 (1.00) |
0.348 (1.00) |
| 17q loss | 8 (3%) | 268 |
0.0369 (1.00) |
0.177 (1.00) |
1 (1.00) |
0.158 (1.00) |
0.493 (1.00) |
1 (1.00) |
| 18p loss | 36 (13%) | 240 |
0.749 (1.00) |
0.221 (1.00) |
0.0501 (1.00) |
0.484 (1.00) |
0.501 (1.00) |
1 (1.00) |
| 18q loss | 34 (12%) | 242 |
0.491 (1.00) |
0.227 (1.00) |
0.202 (1.00) |
0.68 (1.00) |
0.244 (1.00) |
1 (1.00) |
| 19p loss | 15 (5%) | 261 |
0.913 (1.00) |
0.222 (1.00) |
0.426 (1.00) |
0.501 (1.00) |
0.844 (1.00) |
0.258 (1.00) |
| 20p loss | 3 (1%) | 273 |
0.531 (1.00) |
0.52 (1.00) |
0.596 (1.00) |
1 (1.00) |
1 (1.00) |
|
| 21q loss | 20 (7%) | 256 |
0.701 (1.00) |
0.503 (1.00) |
0.245 (1.00) |
0.0765 (1.00) |
0.0534 (1.00) |
0.321 (1.00) |
| 22q loss | 31 (11%) | 245 |
0.0225 (1.00) |
0.00902 (1.00) |
0.182 (1.00) |
0.0332 (1.00) |
0.192 (1.00) |
0.839 (1.00) |
| xq loss | 35 (13%) | 241 |
0.14 (1.00) |
0.404 (1.00) |
0.72 (1.00) |
0.607 (1.00) |
0.241 (1.00) |
0.847 (1.00) |
P value = 8.71e-05 (logrank test), Q value = 0.036
Table S1. Gene #6: '3q gain' versus Clinical Feature #1: 'Time to Death'
| nPatients | nDeath | Duration Range (Median), Month | |
|---|---|---|---|
| ALL | 275 | 59 | 0.0 - 211.2 (15.4) |
| 3Q GAIN MUTATED | 7 | 4 | 0.2 - 41.1 (8.8) |
| 3Q GAIN WILD-TYPE | 268 | 55 | 0.0 - 211.2 (15.4) |
Figure S1. Get High-res Image Gene #6: '3q gain' versus Clinical Feature #1: 'Time to Death'
P value = 0.000127 (t-test), Q value = 0.053
Table S2. Gene #9: '7p gain' versus Clinical Feature #2: 'AGE'
| nPatients | Mean (Std.Dev) | |
|---|---|---|
| ALL | 276 | 43.1 (13.3) |
| 7P GAIN MUTATED | 68 | 48.6 (13.1) |
| 7P GAIN WILD-TYPE | 208 | 41.3 (13.0) |
Figure S2. Get High-res Image Gene #9: '7p gain' versus Clinical Feature #2: 'AGE'
P value = 1.64e-06 (t-test), Q value = 0.00069
Table S3. Gene #10: '7q gain' versus Clinical Feature #2: 'AGE'
| nPatients | Mean (Std.Dev) | |
|---|---|---|
| ALL | 276 | 43.1 (13.3) |
| 7Q GAIN MUTATED | 85 | 49.0 (13.2) |
| 7Q GAIN WILD-TYPE | 191 | 40.5 (12.6) |
Figure S3. Get High-res Image Gene #10: '7q gain' versus Clinical Feature #2: 'AGE'
P value = 0.000574 (logrank test), Q value = 0.24
Table S4. Gene #30: '19q gain' versus Clinical Feature #1: 'Time to Death'
| nPatients | nDeath | Duration Range (Median), Month | |
|---|---|---|---|
| ALL | 275 | 59 | 0.0 - 211.2 (15.4) |
| 19Q GAIN MUTATED | 14 | 5 | 0.5 - 26.3 (14.1) |
| 19Q GAIN WILD-TYPE | 261 | 54 | 0.0 - 211.2 (15.4) |
Figure S4. Get High-res Image Gene #30: '19q gain' versus Clinical Feature #1: 'Time to Death'
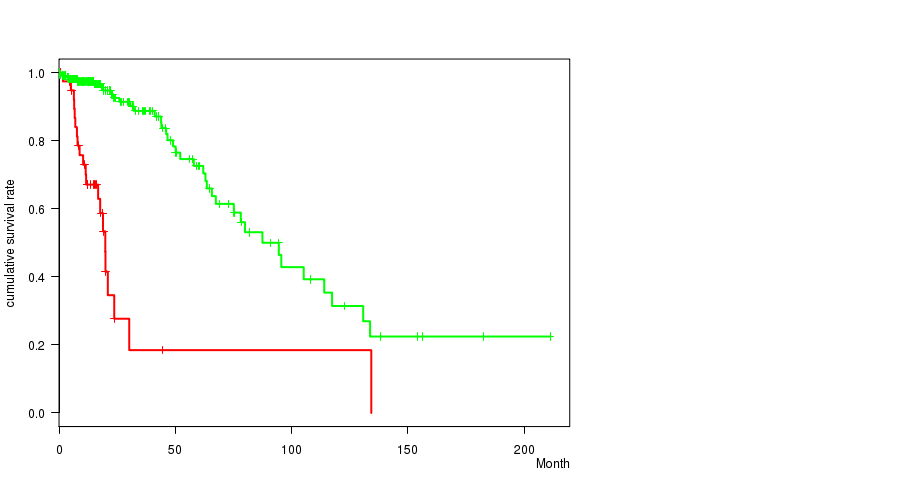
P value = 1.78e-07 (logrank test), Q value = 7.5e-05
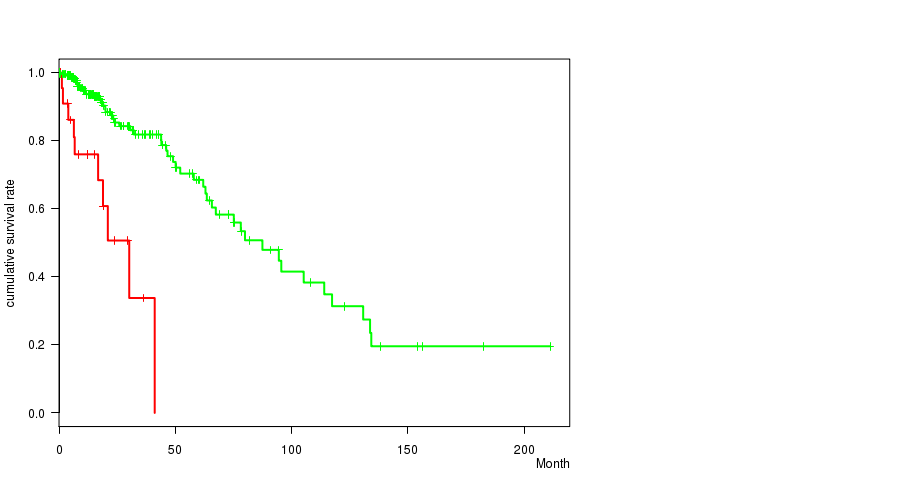
Table S5. Gene #31: '20p gain' versus Clinical Feature #1: 'Time to Death'
| nPatients | nDeath | Duration Range (Median), Month | |
|---|---|---|---|
| ALL | 275 | 59 | 0.0 - 211.2 (15.4) |
| 20P GAIN MUTATED | 24 | 10 | 0.5 - 41.1 (12.3) |
| 20P GAIN WILD-TYPE | 251 | 49 | 0.0 - 211.2 (15.5) |
Figure S5. Get High-res Image Gene #31: '20p gain' versus Clinical Feature #1: 'Time to Death'
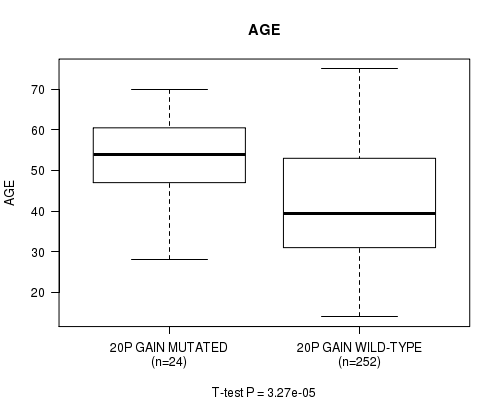
P value = 3.27e-05 (t-test), Q value = 0.014
Table S6. Gene #31: '20p gain' versus Clinical Feature #2: 'AGE'
| nPatients | Mean (Std.Dev) | |
|---|---|---|
| ALL | 276 | 43.1 (13.3) |
| 20P GAIN MUTATED | 24 | 53.5 (10.7) |
| 20P GAIN WILD-TYPE | 252 | 42.1 (13.2) |
Figure S6. Get High-res Image Gene #31: '20p gain' versus Clinical Feature #2: 'AGE'
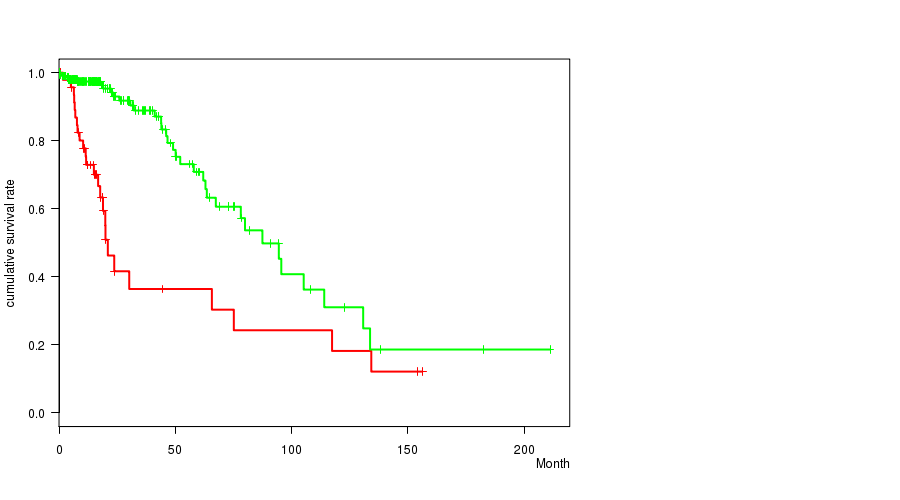
P value = 1.23e-07 (logrank test), Q value = 5.2e-05
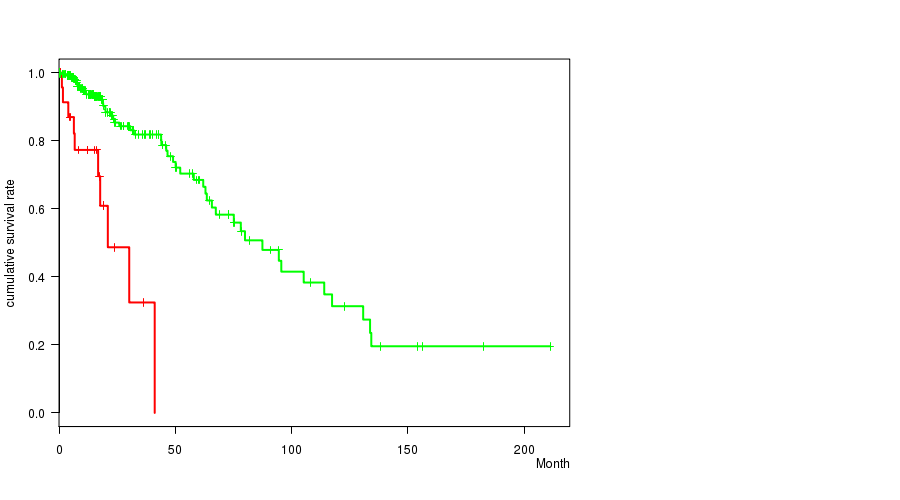
Table S7. Gene #32: '20q gain' versus Clinical Feature #1: 'Time to Death'
| nPatients | nDeath | Duration Range (Median), Month | |
|---|---|---|---|
| ALL | 275 | 59 | 0.0 - 211.2 (15.4) |
| 20Q GAIN MUTATED | 25 | 10 | 0.5 - 41.1 (12.4) |
| 20Q GAIN WILD-TYPE | 250 | 49 | 0.0 - 211.2 (15.5) |
Figure S7. Get High-res Image Gene #32: '20q gain' versus Clinical Feature #1: 'Time to Death'
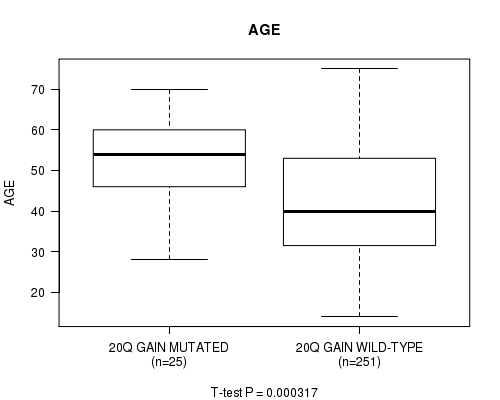
P value = 0.000317 (t-test), Q value = 0.13
Table S8. Gene #32: '20q gain' versus Clinical Feature #2: 'AGE'
| nPatients | Mean (Std.Dev) | |
|---|---|---|
| ALL | 276 | 43.1 (13.3) |
| 20Q GAIN MUTATED | 25 | 52.5 (12.0) |
| 20Q GAIN WILD-TYPE | 251 | 42.2 (13.1) |
Figure S8. Get High-res Image Gene #32: '20q gain' versus Clinical Feature #2: 'AGE'
P value = 1.67e-22 (Fisher's exact test), Q value = 7.1e-20
Table S9. Gene #36: '1p loss' versus Clinical Feature #5: 'HISTOLOGICAL.TYPE'
| nPatients | ASTROCYTOMA | OLIGOASTROCYTOMA | OLIGODENDROGLIOMA |
|---|---|---|---|
| ALL | 88 | 76 | 112 |
| 1P LOSS MUTATED | 5 | 14 | 75 |
| 1P LOSS WILD-TYPE | 83 | 62 | 37 |
Figure S9. Get High-res Image Gene #36: '1p loss' versus Clinical Feature #5: 'HISTOLOGICAL.TYPE'
P value = 7.16e-05 (logrank test), Q value = 0.03
Table S10. Gene #46: '6p loss' versus Clinical Feature #1: 'Time to Death'
| nPatients | nDeath | Duration Range (Median), Month | |
|---|---|---|---|
| ALL | 275 | 59 | 0.0 - 211.2 (15.4) |
| 6P LOSS MUTATED | 18 | 7 | 0.2 - 46.6 (15.6) |
| 6P LOSS WILD-TYPE | 257 | 52 | 0.0 - 211.2 (15.3) |
Figure S10. Get High-res Image Gene #46: '6p loss' versus Clinical Feature #1: 'Time to Death'
P value = 0.000547 (logrank test), Q value = 0.23
Table S11. Gene #47: '6q loss' versus Clinical Feature #1: 'Time to Death'
| nPatients | nDeath | Duration Range (Median), Month | |
|---|---|---|---|
| ALL | 275 | 59 | 0.0 - 211.2 (15.4) |
| 6Q LOSS MUTATED | 35 | 10 | 0.1 - 57.9 (17.3) |
| 6Q LOSS WILD-TYPE | 240 | 49 | 0.0 - 211.2 (15.1) |
Figure S11. Get High-res Image Gene #47: '6q loss' versus Clinical Feature #1: 'Time to Death'
P value = 0.000449 (logrank test), Q value = 0.19
Table S12. Gene #50: '9p loss' versus Clinical Feature #1: 'Time to Death'
| nPatients | nDeath | Duration Range (Median), Month | |
|---|---|---|---|
| ALL | 275 | 59 | 0.0 - 211.2 (15.4) |
| 9P LOSS MUTATED | 63 | 21 | 0.1 - 117.4 (14.9) |
| 9P LOSS WILD-TYPE | 212 | 38 | 0.0 - 211.2 (15.4) |
Figure S12. Get High-res Image Gene #50: '9p loss' versus Clinical Feature #1: 'Time to Death'
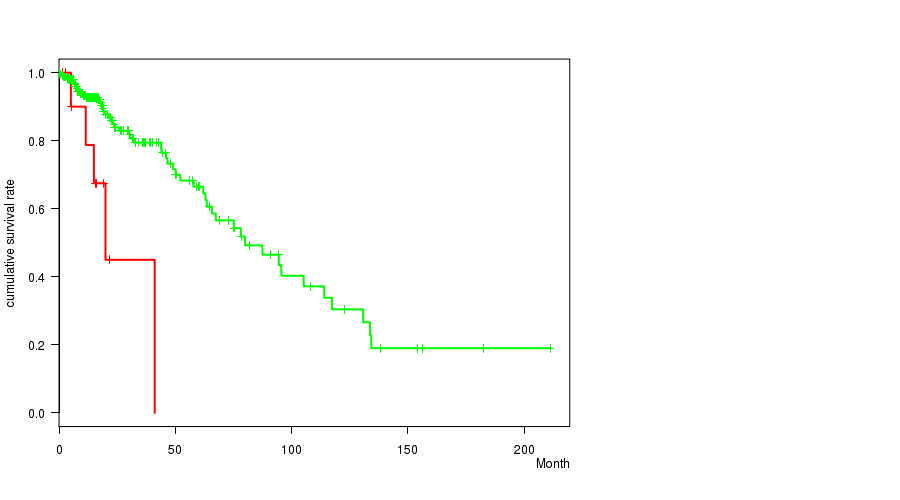
P value = 4.5e-13 (logrank test), Q value = 1.9e-10
Table S13. Gene #52: '10p loss' versus Clinical Feature #1: 'Time to Death'
| nPatients | nDeath | Duration Range (Median), Month | |
|---|---|---|---|
| ALL | 275 | 59 | 0.0 - 211.2 (15.4) |
| 10P LOSS MUTATED | 44 | 21 | 0.1 - 134.3 (12.2) |
| 10P LOSS WILD-TYPE | 231 | 38 | 0.0 - 211.2 (16.0) |
Figure S13. Get High-res Image Gene #52: '10p loss' versus Clinical Feature #1: 'Time to Death'
P value = 1.92e-10 (t-test), Q value = 8.1e-08
Table S14. Gene #52: '10p loss' versus Clinical Feature #2: 'AGE'
| nPatients | Mean (Std.Dev) | |
|---|---|---|
| ALL | 276 | 43.1 (13.3) |
| 10P LOSS MUTATED | 44 | 54.9 (11.1) |
| 10P LOSS WILD-TYPE | 232 | 40.9 (12.5) |
Figure S14. Get High-res Image Gene #52: '10p loss' versus Clinical Feature #2: 'AGE'

P value = 3.22e-06 (logrank test), Q value = 0.0014
Table S15. Gene #53: '10q loss' versus Clinical Feature #1: 'Time to Death'
| nPatients | nDeath | Duration Range (Median), Month | |
|---|---|---|---|
| ALL | 275 | 59 | 0.0 - 211.2 (15.4) |
| 10Q LOSS MUTATED | 52 | 25 | 0.1 - 156.2 (14.1) |
| 10Q LOSS WILD-TYPE | 223 | 34 | 0.0 - 211.2 (15.7) |
Figure S15. Get High-res Image Gene #53: '10q loss' versus Clinical Feature #1: 'Time to Death'
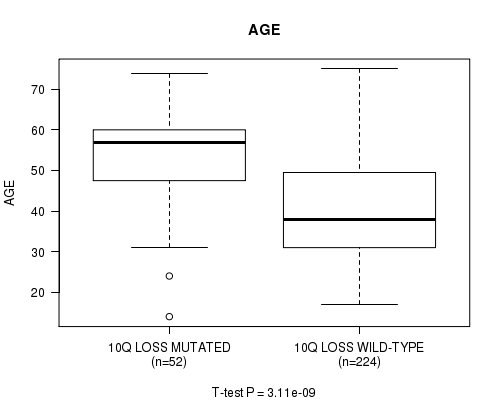
P value = 3.11e-09 (t-test), Q value = 1.3e-06
Table S16. Gene #53: '10q loss' versus Clinical Feature #2: 'AGE'
| nPatients | Mean (Std.Dev) | |
|---|---|---|
| ALL | 276 | 43.1 (13.3) |
| 10Q LOSS MUTATED | 52 | 53.4 (12.3) |
| 10Q LOSS WILD-TYPE | 224 | 40.7 (12.4) |
Figure S16. Get High-res Image Gene #53: '10q loss' versus Clinical Feature #2: 'AGE'
P value = 0.00021 (logrank test), Q value = 0.087
Table S17. Gene #55: '11q loss' versus Clinical Feature #1: 'Time to Death'
| nPatients | nDeath | Duration Range (Median), Month | |
|---|---|---|---|
| ALL | 275 | 59 | 0.0 - 211.2 (15.4) |
| 11Q LOSS MUTATED | 13 | 5 | 0.2 - 41.1 (15.0) |
| 11Q LOSS WILD-TYPE | 262 | 54 | 0.0 - 211.2 (15.4) |
Figure S17. Get High-res Image Gene #55: '11q loss' versus Clinical Feature #1: 'Time to Death'
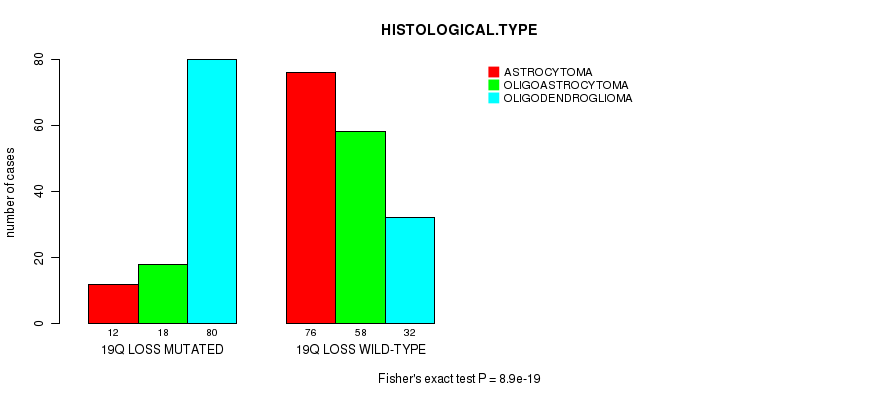
P value = 8.9e-19 (Fisher's exact test), Q value = 3.8e-16
Table S18. Gene #68: '19q loss' versus Clinical Feature #5: 'HISTOLOGICAL.TYPE'
| nPatients | ASTROCYTOMA | OLIGOASTROCYTOMA | OLIGODENDROGLIOMA |
|---|---|---|---|
| ALL | 88 | 76 | 112 |
| 19Q LOSS MUTATED | 12 | 18 | 80 |
| 19Q LOSS WILD-TYPE | 76 | 58 | 32 |
Figure S18. Get High-res Image Gene #68: '19q loss' versus Clinical Feature #5: 'HISTOLOGICAL.TYPE'
-
Copy number data file = transformed.cor.cli.txt
-
Clinical data file = LGG-TP.merged_data.txt
-
Number of patients = 276
-
Number of significantly arm-level cnvs = 72
-
Number of selected clinical features = 6
-
Exclude regions that fewer than K tumors have mutations, K = 3
For survival clinical features, the Kaplan-Meier survival curves of tumors with and without gene mutations were plotted and the statistical significance P values were estimated by logrank test (Bland and Altman 2004) using the 'survdiff' function in R
For continuous numerical clinical features, two-tailed Student's t test with unequal variance (Lehmann and Romano 2005) was applied to compare the clinical values between tumors with and without gene mutations using 't.test' function in R
For binary or multi-class clinical features (nominal or ordinal), two-tailed Fisher's exact tests (Fisher 1922) were used to estimate the P values using the 'fisher.test' function in R
For multiple hypothesis correction, Q value is the False Discovery Rate (FDR) analogue of the P value (Benjamini and Hochberg 1995), defined as the minimum FDR at which the test may be called significant. We used the 'Benjamini and Hochberg' method of 'p.adjust' function in R to convert P values into Q values.
In addition to the links below, the full results of the analysis summarized in this report can also be downloaded programmatically using firehose_get, or interactively from either the Broad GDAC website or TCGA Data Coordination Center Portal.