This pipeline computes the correlation between significant arm-level copy number variations (cnvs) and selected clinical features.
Testing the association between copy number variation 61 arm-level events and 12 clinical features across 57 patients, 5 significant findings detected with Q value < 0.25.
-
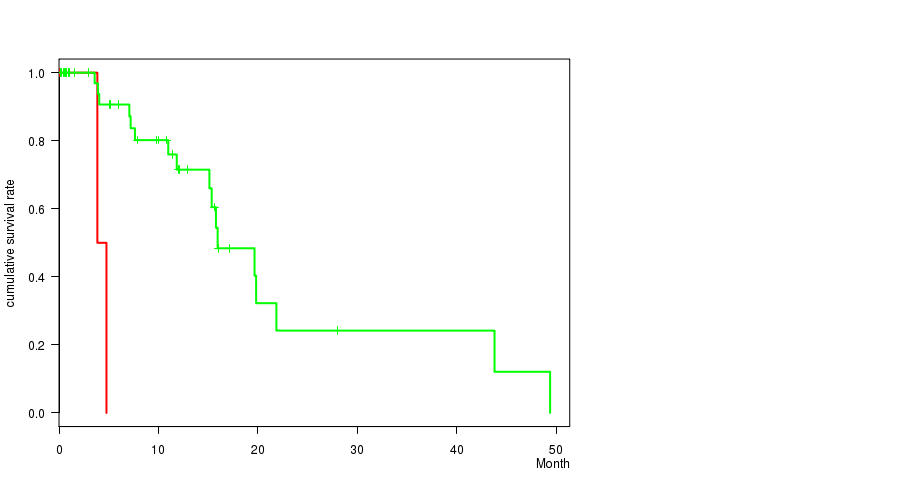
3p gain cnv correlated to 'Time to Death'.
-
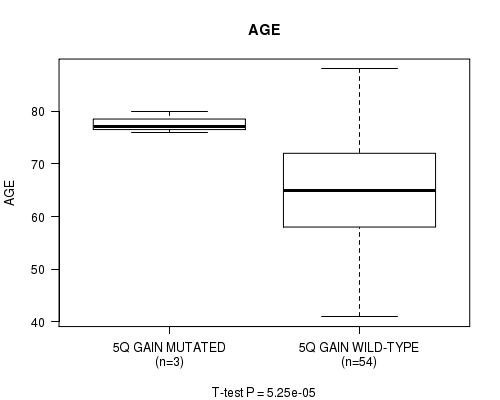
5q gain cnv correlated to 'AGE'.
-
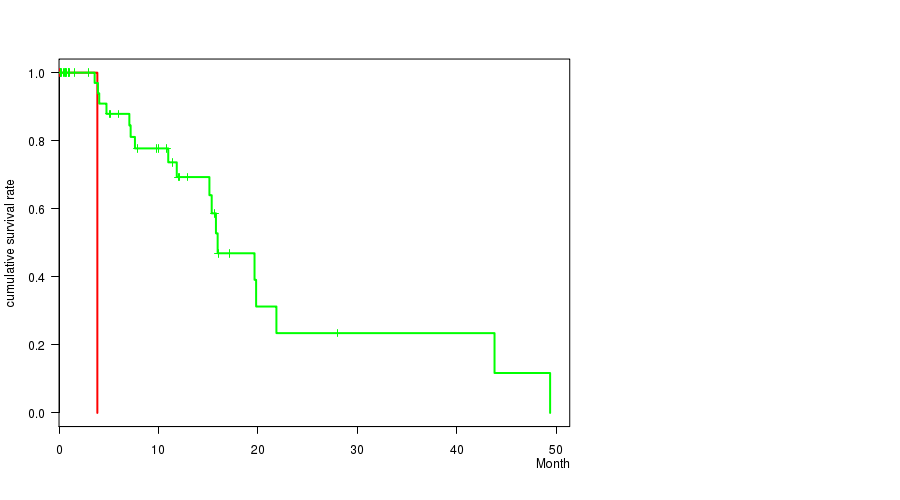
17q gain cnv correlated to 'Time to Death'.
-
22q gain cnv correlated to 'Time to Death'.
-
20p loss cnv correlated to 'Time to Death'.
Table 1. Get Full Table Overview of the association between significant copy number variation of 61 arm-level events and 12 clinical features. Shown in the table are P values (Q values). Thresholded by Q value < 0.25, 5 significant findings detected.
|
Clinical Features |
Time to Death |
AGE |
NEOPLASM DISEASESTAGE |
PATHOLOGY T STAGE |
PATHOLOGY N STAGE |
PATHOLOGY M STAGE |
GENDER |
HISTOLOGICAL TYPE |
NUMBERPACKYEARSSMOKED | YEAROFTOBACCOSMOKINGONSET |
COMPLETENESS OF RESECTION |
NUMBER OF LYMPH NODES |
||
| nCNV (%) | nWild-Type | logrank test | t-test | Chi-square test | Fisher's exact test | Fisher's exact test | Fisher's exact test | Fisher's exact test | Fisher's exact test | t-test | t-test | Fisher's exact test | t-test | |
| 3p gain | 3 (5%) | 54 |
8.5e-05 (0.0537) |
0.0281 (1.00) |
0.895 (1.00) |
1 (1.00) |
1 (1.00) |
1 (1.00) |
0.587 (1.00) |
1 (1.00) |
1 (1.00) |
0.904 (1.00) |
||
| 5q gain | 3 (5%) | 54 |
5.25e-05 (0.0332) |
0.895 (1.00) |
1 (1.00) |
1 (1.00) |
1 (1.00) |
0.587 (1.00) |
1 (1.00) |
0.603 (1.00) |
0.438 (1.00) |
|||
| 17q gain | 3 (5%) | 54 |
8.5e-05 (0.0537) |
0.835 (1.00) |
0.895 (1.00) |
1 (1.00) |
1 (1.00) |
0.333 (1.00) |
0.587 (1.00) |
1 (1.00) |
0.771 (1.00) |
|||
| 22q gain | 3 (5%) | 54 |
9.36e-05 (0.059) |
0.895 (1.00) |
0.895 (1.00) |
1 (1.00) |
1 (1.00) |
1 (1.00) |
1 (1.00) |
1 (1.00) |
0.744 (1.00) |
|||
| 20p loss | 4 (7%) | 53 |
9.22e-09 (5.84e-06) |
0.813 (1.00) |
0.892 (1.00) |
0.367 (1.00) |
0.563 (1.00) |
0.394 (1.00) |
1 (1.00) |
0.32 (1.00) |
0.0294 (1.00) |
0.961 (1.00) |
||
| 1p gain | 3 (5%) | 54 |
0.82 (1.00) |
0.941 (1.00) |
1 (1.00) |
0.568 (1.00) |
0.61 (1.00) |
0.587 (1.00) |
1 (1.00) |
1 (1.00) |
0.891 (1.00) |
|||
| 1q gain | 12 (21%) | 45 |
0.705 (1.00) |
0.827 (1.00) |
0.679 (1.00) |
0.325 (1.00) |
1 (1.00) |
0.211 (1.00) |
0.117 (1.00) |
0.659 (1.00) |
0.184 (1.00) |
0.14 (1.00) |
1 (1.00) |
0.973 (1.00) |
| 2p gain | 6 (11%) | 51 |
0.642 (1.00) |
0.368 (1.00) |
0.623 (1.00) |
1 (1.00) |
0.629 (1.00) |
0.0657 (1.00) |
0.396 (1.00) |
1 (1.00) |
0.261 (1.00) |
0.281 (1.00) |
0.484 (1.00) |
0.586 (1.00) |
| 2q gain | 7 (12%) | 50 |
0.3 (1.00) |
0.563 (1.00) |
0.702 (1.00) |
1 (1.00) |
1 (1.00) |
0.0548 (1.00) |
0.228 (1.00) |
1 (1.00) |
0.261 (1.00) |
0.281 (1.00) |
0.366 (1.00) |
0.919 (1.00) |
| 3q gain | 7 (12%) | 50 |
0.102 (1.00) |
0.436 (1.00) |
0.453 (1.00) |
0.562 (1.00) |
0.346 (1.00) |
0.321 (1.00) |
0.691 (1.00) |
1 (1.00) |
0.556 (1.00) |
0.385 (1.00) |
||
| 4p gain | 3 (5%) | 54 |
0.849 (1.00) |
0.117 (1.00) |
1 (1.00) |
1 (1.00) |
0.0192 (1.00) |
0.242 (1.00) |
1 (1.00) |
1 (1.00) |
0.218 (1.00) |
|||
| 4q gain | 3 (5%) | 54 |
0.849 (1.00) |
0.117 (1.00) |
1 (1.00) |
1 (1.00) |
0.0192 (1.00) |
0.242 (1.00) |
1 (1.00) |
1 (1.00) |
0.218 (1.00) |
|||
| 5p gain | 5 (9%) | 52 |
0.681 (1.00) |
0.0559 (1.00) |
0.947 (1.00) |
1 (1.00) |
1 (1.00) |
0.7 (1.00) |
0.651 (1.00) |
0.385 (1.00) |
0.294 (1.00) |
0.246 (1.00) |
||
| 7p gain | 13 (23%) | 44 |
0.921 (1.00) |
0.941 (1.00) |
0.685 (1.00) |
0.319 (1.00) |
1 (1.00) |
0.234 (1.00) |
0.22 (1.00) |
1 (1.00) |
0.00396 (1.00) |
0.908 (1.00) |
||
| 7q gain | 12 (21%) | 45 |
0.8 (1.00) |
0.842 (1.00) |
0.647 (1.00) |
0.325 (1.00) |
0.71 (1.00) |
0.211 (1.00) |
0.349 (1.00) |
1 (1.00) |
0.0102 (1.00) |
0.643 (1.00) |
||
| 8p gain | 8 (14%) | 49 |
0.00145 (0.909) |
0.573 (1.00) |
0.269 (1.00) |
0.58 (1.00) |
0.391 (1.00) |
1 (1.00) |
1 (1.00) |
1 (1.00) |
0.556 (1.00) |
0.522 (1.00) |
||
| 8q gain | 15 (26%) | 42 |
0.469 (1.00) |
0.629 (1.00) |
0.677 (1.00) |
1 (1.00) |
0.486 (1.00) |
0.56 (1.00) |
0.236 (1.00) |
1 (1.00) |
0.3 (1.00) |
0.89 (1.00) |
||
| 9q gain | 3 (5%) | 54 |
0.0262 (1.00) |
0.881 (1.00) |
0.118 (1.00) |
1 (1.00) |
0.146 (1.00) |
0.333 (1.00) |
0.0889 (1.00) |
1 (1.00) |
0.603 (1.00) |
0.725 (1.00) |
||
| 11p gain | 6 (11%) | 51 |
0.671 (1.00) |
0.779 (1.00) |
0.623 (1.00) |
1 (1.00) |
0.629 (1.00) |
0.507 (1.00) |
0.396 (1.00) |
1 (1.00) |
0.116 (1.00) |
0.496 (1.00) |
||
| 11q gain | 6 (11%) | 51 |
0.458 (1.00) |
0.157 (1.00) |
0.623 (1.00) |
1 (1.00) |
0.629 (1.00) |
0.507 (1.00) |
0.396 (1.00) |
1 (1.00) |
0.484 (1.00) |
0.353 (1.00) |
||
| 12p gain | 6 (11%) | 51 |
0.174 (1.00) |
0.223 (1.00) |
0.653 (1.00) |
0.504 (1.00) |
1 (1.00) |
0.38 (1.00) |
0.0828 (1.00) |
0.0836 (1.00) |
0.14 (1.00) |
0.651 (1.00) |
||
| 12q gain | 5 (9%) | 52 |
0.0343 (1.00) |
0.366 (1.00) |
0.83 (1.00) |
1 (1.00) |
0.319 (1.00) |
0.293 (1.00) |
0.167 (1.00) |
0.0579 (1.00) |
0.0612 (1.00) |
0.37 (1.00) |
||
| 13q gain | 4 (7%) | 53 |
0.302 (1.00) |
0.987 (1.00) |
0.892 (1.00) |
1 (1.00) |
0.563 (1.00) |
1 (1.00) |
0.617 (1.00) |
0.32 (1.00) |
0.347 (1.00) |
0.799 (1.00) |
||
| 14q gain | 7 (12%) | 50 |
0.968 (1.00) |
0.459 (1.00) |
0.439 (1.00) |
1 (1.00) |
0.669 (1.00) |
0.253 (1.00) |
1 (1.00) |
1 (1.00) |
0.366 (1.00) |
0.93 (1.00) |
||
| 15q gain | 4 (7%) | 53 |
0.0168 (1.00) |
0.121 (1.00) |
0.892 (1.00) |
1 (1.00) |
0.563 (1.00) |
1 (1.00) |
1 (1.00) |
1 (1.00) |
1 (1.00) |
0.218 (1.00) |
||
| 16p gain | 6 (11%) | 51 |
0.797 (1.00) |
0.274 (1.00) |
0.307 (1.00) |
0.504 (1.00) |
0.151 (1.00) |
0.141 (1.00) |
0.0828 (1.00) |
0.445 (1.00) |
0.0266 (1.00) |
0.0836 (1.00) |
||
| 16q gain | 7 (12%) | 50 |
0.949 (1.00) |
0.231 (1.00) |
0.453 (1.00) |
0.562 (1.00) |
0.346 (1.00) |
0.123 (1.00) |
0.228 (1.00) |
0.501 (1.00) |
0.0629 (1.00) |
0.229 (1.00) |
||
| 18p gain | 6 (11%) | 51 |
0.674 (1.00) |
0.339 (1.00) |
0.512 (1.00) |
1 (1.00) |
0.629 (1.00) |
0.259 (1.00) |
0.396 (1.00) |
0.445 (1.00) |
0.14 (1.00) |
0.0258 (1.00) |
||
| 19p gain | 3 (5%) | 54 |
0.897 (1.00) |
0.549 (1.00) |
0.941 (1.00) |
1 (1.00) |
0.568 (1.00) |
0.333 (1.00) |
0.587 (1.00) |
1 (1.00) |
0.0958 (1.00) |
|||
| 19q gain | 6 (11%) | 51 |
0.59 (1.00) |
0.792 (1.00) |
0.407 (1.00) |
1 (1.00) |
1 (1.00) |
1 (1.00) |
0.396 (1.00) |
1 (1.00) |
0.0417 (1.00) |
0.455 (1.00) |
1 (1.00) |
0.446 (1.00) |
| 20p gain | 10 (18%) | 47 |
0.342 (1.00) |
0.0483 (1.00) |
0.855 (1.00) |
1 (1.00) |
1 (1.00) |
1 (1.00) |
0.16 (1.00) |
0.641 (1.00) |
0.106 (1.00) |
0.771 (1.00) |
||
| 20q gain | 11 (19%) | 46 |
0.342 (1.00) |
0.0289 (1.00) |
0.833 (1.00) |
1 (1.00) |
0.714 (1.00) |
0.835 (1.00) |
0.0891 (1.00) |
1 (1.00) |
0.214 (1.00) |
0.308 (1.00) |
||
| 1p loss | 7 (12%) | 50 |
0.359 (1.00) |
0.103 (1.00) |
0.913 (1.00) |
1 (1.00) |
0.669 (1.00) |
0.4 (1.00) |
0.691 (1.00) |
1 (1.00) |
0.393 (1.00) |
0.057 (1.00) |
0.556 (1.00) |
0.314 (1.00) |
| 2p loss | 6 (11%) | 51 |
0.434 (1.00) |
0.663 (1.00) |
0.936 (1.00) |
1 (1.00) |
1 (1.00) |
1 (1.00) |
1 (1.00) |
0.445 (1.00) |
0.14 (1.00) |
0.504 (1.00) |
||
| 3p loss | 11 (19%) | 46 |
0.62 (1.00) |
0.554 (1.00) |
0.821 (1.00) |
1 (1.00) |
1 (1.00) |
0.563 (1.00) |
0.0155 (1.00) |
1 (1.00) |
0.261 (1.00) |
0.149 (1.00) |
0.227 (1.00) |
|
| 3q loss | 5 (9%) | 52 |
0.564 (1.00) |
0.434 (1.00) |
0.493 (1.00) |
1 (1.00) |
0.587 (1.00) |
0.491 (1.00) |
0.0157 (1.00) |
1 (1.00) |
0.484 (1.00) |
0.278 (1.00) |
||
| 4p loss | 6 (11%) | 51 |
0.171 (1.00) |
0.066 (1.00) |
0.936 (1.00) |
1 (1.00) |
1 (1.00) |
1 (1.00) |
0.0828 (1.00) |
1 (1.00) |
0.366 (1.00) |
0.484 (1.00) |
||
| 4q loss | 5 (9%) | 52 |
0.952 (1.00) |
0.00953 (1.00) |
0.947 (1.00) |
1 (1.00) |
1 (1.00) |
0.7 (1.00) |
0.0157 (1.00) |
1 (1.00) |
0.116 (1.00) |
0.832 (1.00) |
||
| 5q loss | 5 (9%) | 52 |
0.9 (1.00) |
0.4 (1.00) |
0.83 (1.00) |
1 (1.00) |
0.319 (1.00) |
0.7 (1.00) |
0.651 (1.00) |
0.385 (1.00) |
0.0979 (1.00) |
0.399 (1.00) |
||
| 6p loss | 20 (35%) | 37 |
0.182 (1.00) |
0.636 (1.00) |
0.568 (1.00) |
0.41 (1.00) |
0.53 (1.00) |
0.0855 (1.00) |
0.164 (1.00) |
0.737 (1.00) |
0.973 (1.00) |
0.362 (1.00) |
0.39 (1.00) |
0.825 (1.00) |
| 6q loss | 23 (40%) | 34 |
0.649 (1.00) |
0.492 (1.00) |
0.357 (1.00) |
0.385 (1.00) |
0.532 (1.00) |
0.0184 (1.00) |
0.794 (1.00) |
0.783 (1.00) |
0.969 (1.00) |
0.528 (1.00) |
0.553 (1.00) |
0.73 (1.00) |
| 8p loss | 8 (14%) | 49 |
0.708 (1.00) |
0.501 (1.00) |
0.431 (1.00) |
1 (1.00) |
1 (1.00) |
0.352 (1.00) |
0.448 (1.00) |
0.501 (1.00) |
0.158 (1.00) |
0.59 (1.00) |
||
| 9p loss | 22 (39%) | 35 |
0.173 (1.00) |
0.951 (1.00) |
0.171 (1.00) |
0.389 (1.00) |
0.0556 (1.00) |
0.324 (1.00) |
1 (1.00) |
1 (1.00) |
0.324 (1.00) |
0.102 (1.00) |
0.155 (1.00) |
0.0667 (1.00) |
| 9q loss | 12 (21%) | 45 |
0.395 (1.00) |
0.596 (1.00) |
0.636 (1.00) |
1 (1.00) |
0.258 (1.00) |
0.708 (1.00) |
1 (1.00) |
1 (1.00) |
0.7 (1.00) |
0.155 (1.00) |
||
| 10p loss | 10 (18%) | 47 |
0.159 (1.00) |
0.236 (1.00) |
0.275 (1.00) |
0.281 (1.00) |
0.694 (1.00) |
0.278 (1.00) |
0.486 (1.00) |
0.641 (1.00) |
0.624 (1.00) |
0.439 (1.00) |
0.395 (1.00) |
0.972 (1.00) |
| 10q loss | 10 (18%) | 47 |
0.295 (1.00) |
0.209 (1.00) |
0.855 (1.00) |
1 (1.00) |
1 (1.00) |
0.278 (1.00) |
0.486 (1.00) |
0.641 (1.00) |
0.16 (1.00) |
0.395 (1.00) |
0.32 (1.00) |
|
| 11p loss | 5 (9%) | 52 |
0.646 (1.00) |
0.527 (1.00) |
0.947 (1.00) |
1 (1.00) |
1 (1.00) |
0.111 (1.00) |
0.651 (1.00) |
1 (1.00) |
1 (1.00) |
0.596 (1.00) |
||
| 11q loss | 4 (7%) | 53 |
0.519 (1.00) |
0.769 (1.00) |
0.94 (1.00) |
1 (1.00) |
1 (1.00) |
0.682 (1.00) |
0.322 (1.00) |
0.32 (1.00) |
0.159 (1.00) |
0.338 (1.00) |
||
| 12p loss | 6 (11%) | 51 |
0.458 (1.00) |
0.796 (1.00) |
0.221 (1.00) |
1 (1.00) |
0.151 (1.00) |
0.0251 (1.00) |
0.396 (1.00) |
1 (1.00) |
0.0629 (1.00) |
0.121 (1.00) |
||
| 12q loss | 7 (12%) | 50 |
0.274 (1.00) |
0.496 (1.00) |
0.453 (1.00) |
0.562 (1.00) |
0.346 (1.00) |
0.0217 (1.00) |
0.691 (1.00) |
1 (1.00) |
0.261 (1.00) |
0.176 (1.00) |
0.102 (1.00) |
|
| 13q loss | 9 (16%) | 48 |
0.922 (1.00) |
0.343 (1.00) |
0.439 (1.00) |
0.575 (1.00) |
0.427 (1.00) |
0.189 (1.00) |
0.275 (1.00) |
0.262 (1.00) |
0.393 (1.00) |
0.681 (1.00) |
0.106 (1.00) |
0.277 (1.00) |
| 15q loss | 8 (14%) | 49 |
0.829 (1.00) |
0.642 (1.00) |
0.35 (1.00) |
1 (1.00) |
0.391 (1.00) |
0.0827 (1.00) |
0.124 (1.00) |
0.501 (1.00) |
0.556 (1.00) |
0.109 (1.00) |
||
| 17p loss | 20 (35%) | 37 |
0.293 (1.00) |
0.368 (1.00) |
0.173 (1.00) |
0.0809 (1.00) |
0.749 (1.00) |
0.199 (1.00) |
0.781 (1.00) |
0.737 (1.00) |
0.168 (1.00) |
0.111 (1.00) |
0.000825 (0.519) |
0.623 (1.00) |
| 17q loss | 9 (16%) | 48 |
0.81 (1.00) |
0.734 (1.00) |
0.679 (1.00) |
0.575 (1.00) |
1 (1.00) |
0.315 (1.00) |
0.275 (1.00) |
0.144 (1.00) |
0.0427 (1.00) |
0.133 (1.00) |
||
| 18p loss | 21 (37%) | 36 |
0.912 (1.00) |
0.072 (1.00) |
0.264 (1.00) |
0.659 (1.00) |
0.751 (1.00) |
1 (1.00) |
0.789 (1.00) |
0.77 (1.00) |
0.258 (1.00) |
0.863 (1.00) |
0.301 (1.00) |
0.839 (1.00) |
| 18q loss | 30 (53%) | 27 |
0.424 (1.00) |
0.678 (1.00) |
0.273 (1.00) |
1 (1.00) |
1 (1.00) |
0.329 (1.00) |
0.431 (1.00) |
0.799 (1.00) |
0.582 (1.00) |
0.206 (1.00) |
0.03 (1.00) |
0.512 (1.00) |
| 19p loss | 6 (11%) | 51 |
0.993 (1.00) |
0.91 (1.00) |
0.407 (1.00) |
1 (1.00) |
1 (1.00) |
0.259 (1.00) |
0.678 (1.00) |
1 (1.00) |
0.74 (1.00) |
0.45 (1.00) |
||
| 19q loss | 5 (9%) | 52 |
0.993 (1.00) |
0.934 (1.00) |
0.342 (1.00) |
1 (1.00) |
1 (1.00) |
0.165 (1.00) |
1 (1.00) |
1 (1.00) |
0.484 (1.00) |
0.484 (1.00) |
||
| 21q loss | 19 (33%) | 38 |
0.303 (1.00) |
0.234 (1.00) |
0.0999 (1.00) |
0.164 (1.00) |
0.109 (1.00) |
0.054 (1.00) |
0.407 (1.00) |
1 (1.00) |
0.651 (1.00) |
0.537 (1.00) |
0.0374 (1.00) |
0.1 (1.00) |
| 22q loss | 9 (16%) | 48 |
0.416 (1.00) |
0.773 (1.00) |
0.553 (1.00) |
0.575 (1.00) |
0.674 (1.00) |
0.189 (1.00) |
0.00797 (1.00) |
0.552 (1.00) |
0.0518 (1.00) |
0.538 (1.00) |
||
| xq loss | 3 (5%) | 54 |
0.313 (1.00) |
0.383 (1.00) |
0.941 (1.00) |
1 (1.00) |
0.568 (1.00) |
0.333 (1.00) |
1 (1.00) |
1 (1.00) |
1 (1.00) |
0.594 (1.00) |
P value = 8.5e-05 (logrank test), Q value = 0.054
Table S1. Gene #5: '3p gain' versus Clinical Feature #1: 'Time to Death'
| nPatients | nDeath | Duration Range (Median), Month | |
|---|---|---|---|
| ALL | 54 | 19 | 0.0 - 49.4 (5.6) |
| 3P GAIN MUTATED | 3 | 2 | 0.1 - 4.8 (3.9) |
| 3P GAIN WILD-TYPE | 51 | 17 | 0.0 - 49.4 (7.1) |
Figure S1. Get High-res Image Gene #5: '3p gain' versus Clinical Feature #1: 'Time to Death'

P value = 5.25e-05 (t-test), Q value = 0.033
Table S2. Gene #10: '5q gain' versus Clinical Feature #2: 'AGE'
| nPatients | Mean (Std.Dev) | |
|---|---|---|
| ALL | 57 | 66.2 (10.4) |
| 5Q GAIN MUTATED | 3 | 77.7 (2.1) |
| 5Q GAIN WILD-TYPE | 54 | 65.5 (10.3) |
Figure S2. Get High-res Image Gene #10: '5q gain' versus Clinical Feature #2: 'AGE'
P value = 8.5e-05 (logrank test), Q value = 0.054
Table S3. Gene #25: '17q gain' versus Clinical Feature #1: 'Time to Death'
| nPatients | nDeath | Duration Range (Median), Month | |
|---|---|---|---|
| ALL | 54 | 19 | 0.0 - 49.4 (5.6) |
| 17Q GAIN MUTATED | 3 | 2 | 0.0 - 4.8 (3.9) |
| 17Q GAIN WILD-TYPE | 51 | 17 | 0.1 - 49.4 (7.1) |
Figure S3. Get High-res Image Gene #25: '17q gain' versus Clinical Feature #1: 'Time to Death'
P value = 9.36e-05 (logrank test), Q value = 0.059
Table S4. Gene #31: '22q gain' versus Clinical Feature #1: 'Time to Death'
| nPatients | nDeath | Duration Range (Median), Month | |
|---|---|---|---|
| ALL | 54 | 19 | 0.0 - 49.4 (5.6) |
| 22Q GAIN MUTATED | 3 | 1 | 0.0 - 3.9 (0.1) |
| 22Q GAIN WILD-TYPE | 51 | 18 | 0.1 - 49.4 (7.1) |
Figure S4. Get High-res Image Gene #31: '22q gain' versus Clinical Feature #1: 'Time to Death'
P value = 9.22e-09 (logrank test), Q value = 5.8e-06
Table S5. Gene #58: '20p loss' versus Clinical Feature #1: 'Time to Death'
| nPatients | nDeath | Duration Range (Median), Month | |
|---|---|---|---|
| ALL | 54 | 19 | 0.0 - 49.4 (5.6) |
| 20P LOSS MUTATED | 3 | 1 | 0.8 - 3.6 (1.5) |
| 20P LOSS WILD-TYPE | 51 | 18 | 0.0 - 49.4 (7.1) |
Figure S5. Get High-res Image Gene #58: '20p loss' versus Clinical Feature #1: 'Time to Death'

-
Copy number data file = transformed.cor.cli.txt
-
Clinical data file = PAAD-TP.merged_data.txt
-
Number of patients = 57
-
Number of significantly arm-level cnvs = 61
-
Number of selected clinical features = 12
-
Exclude regions that fewer than K tumors have mutations, K = 3
For survival clinical features, the Kaplan-Meier survival curves of tumors with and without gene mutations were plotted and the statistical significance P values were estimated by logrank test (Bland and Altman 2004) using the 'survdiff' function in R
For continuous numerical clinical features, two-tailed Student's t test with unequal variance (Lehmann and Romano 2005) was applied to compare the clinical values between tumors with and without gene mutations using 't.test' function in R
For multi-class clinical features (nominal or ordinal), Chi-square tests (Greenwood and Nikulin 1996) were used to estimate the P values using the 'chisq.test' function in R
For binary or multi-class clinical features (nominal or ordinal), two-tailed Fisher's exact tests (Fisher 1922) were used to estimate the P values using the 'fisher.test' function in R
For multiple hypothesis correction, Q value is the False Discovery Rate (FDR) analogue of the P value (Benjamini and Hochberg 1995), defined as the minimum FDR at which the test may be called significant. We used the 'Benjamini and Hochberg' method of 'p.adjust' function in R to convert P values into Q values.
In addition to the links below, the full results of the analysis summarized in this report can also be downloaded programmatically using firehose_get, or interactively from either the Broad GDAC website or TCGA Data Coordination Center Portal.