This pipeline computes the correlation between significant copy number variation (cnv focal) genes and molecular subtypes.
Testing the association between copy number variation 40 focal events and 8 molecular subtypes across 81 patients, 59 significant findings detected with P value < 0.05 and Q value < 0.25.
-
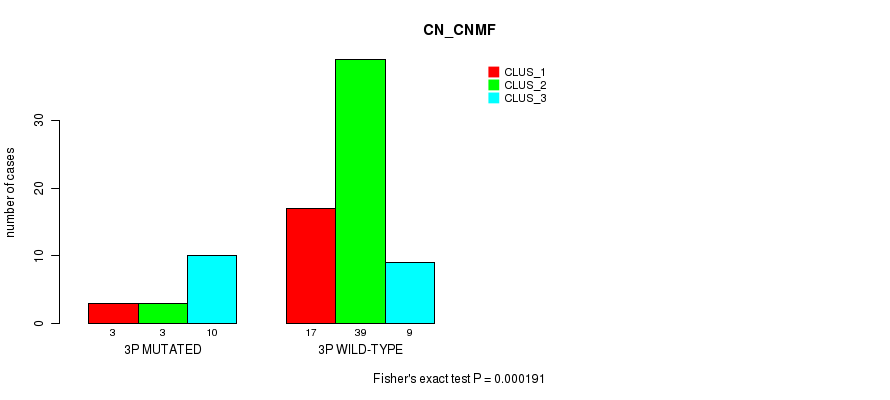
3p cnv correlated to 'CN_CNMF'.
-
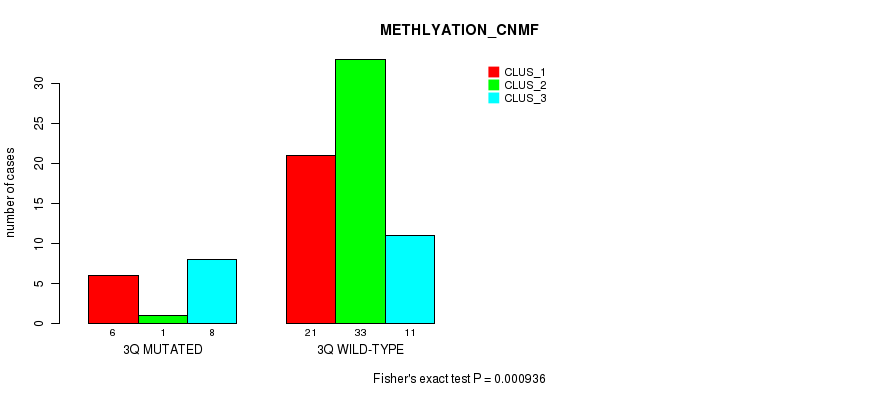
3q cnv correlated to 'METHLYATION_CNMF'.
-
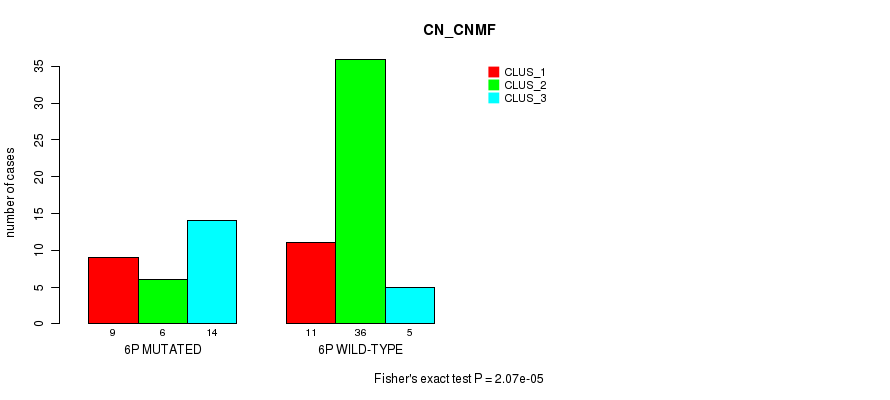
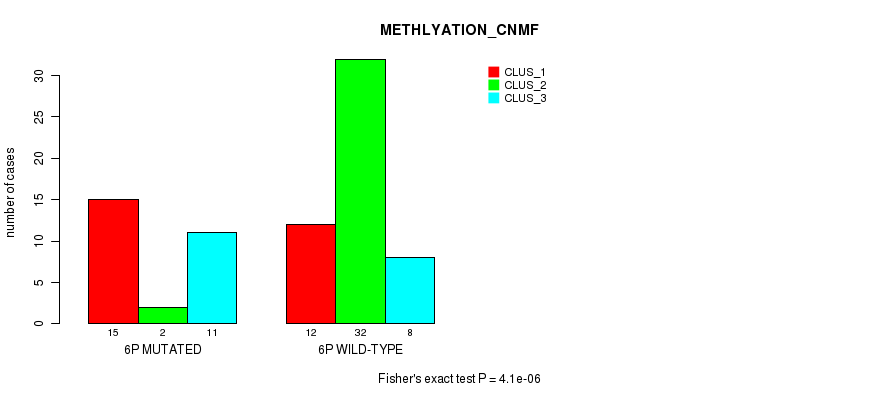
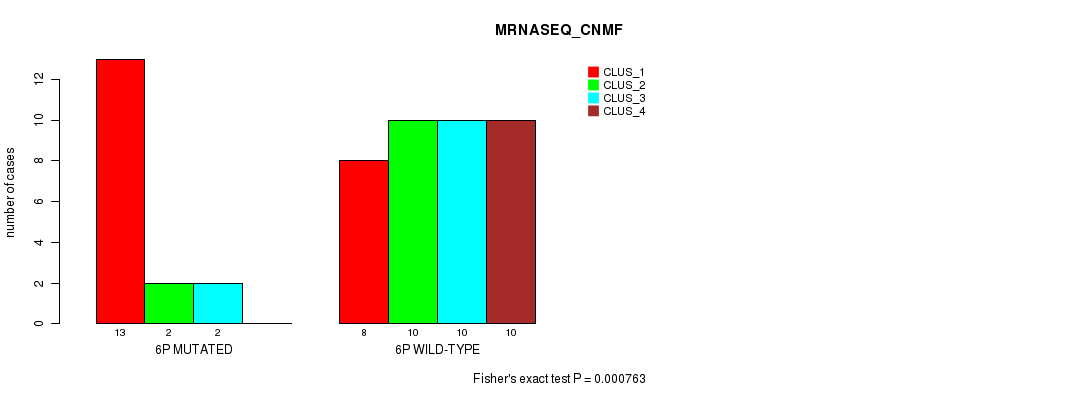
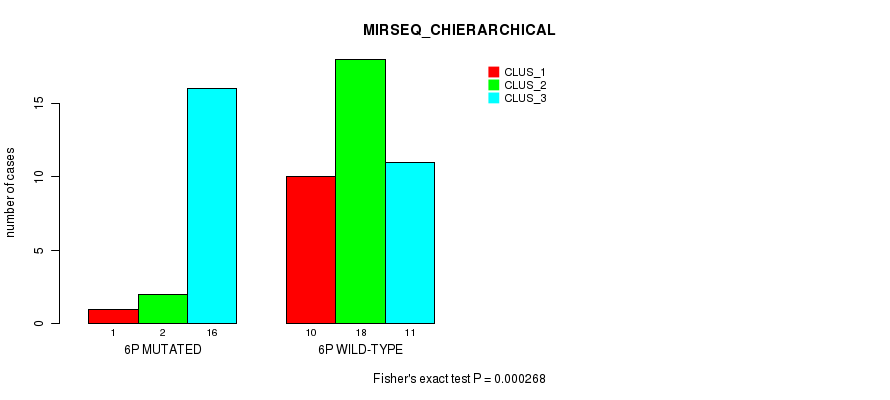
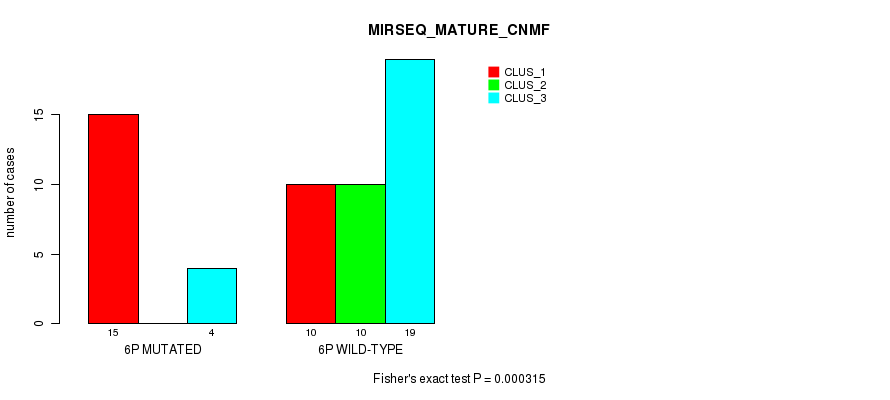
6p cnv correlated to 'CN_CNMF', 'METHLYATION_CNMF', 'MRNASEQ_CNMF', 'MIRSEQ_CHIERARCHICAL', and 'MIRSEQ_MATURE_CNMF'.
-
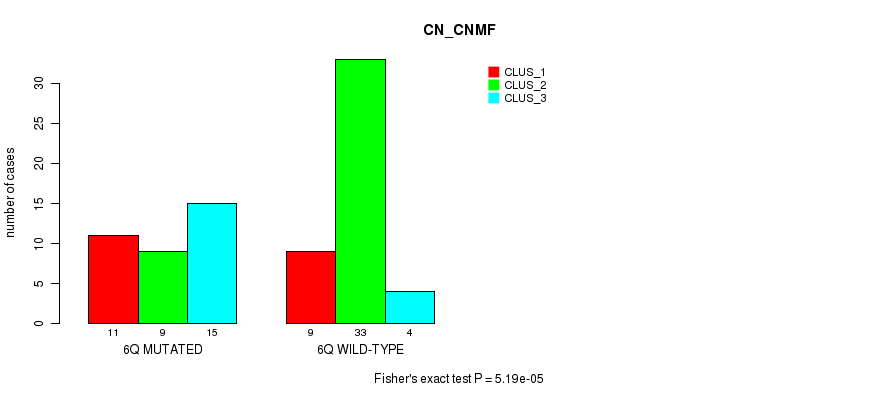
6q cnv correlated to 'CN_CNMF', 'METHLYATION_CNMF', 'MRNASEQ_CNMF', 'MRNASEQ_CHIERARCHICAL', 'MIRSEQ_CNMF', 'MIRSEQ_CHIERARCHICAL', 'MIRSEQ_MATURE_CNMF', and 'MIRSEQ_MATURE_CHIERARCHICAL'.
-
8p cnv correlated to 'MRNASEQ_CNMF', 'MRNASEQ_CHIERARCHICAL', 'MIRSEQ_CNMF', 'MIRSEQ_MATURE_CNMF', and 'MIRSEQ_MATURE_CHIERARCHICAL'.
-
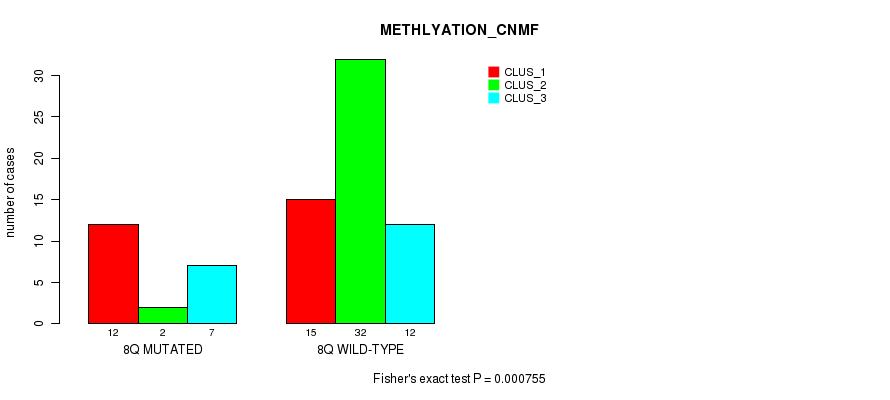
8q cnv correlated to 'METHLYATION_CNMF', 'MRNASEQ_CNMF', 'MRNASEQ_CHIERARCHICAL', 'MIRSEQ_CNMF', 'MIRSEQ_MATURE_CNMF', and 'MIRSEQ_MATURE_CHIERARCHICAL'.
-
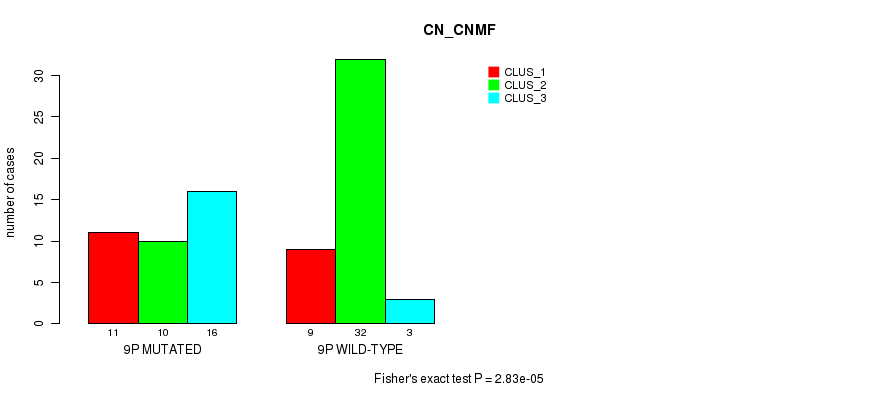
9p cnv correlated to 'CN_CNMF'.
-
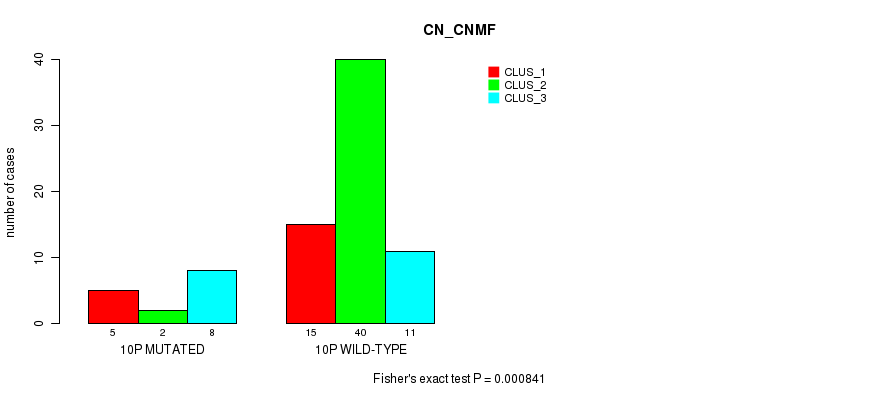
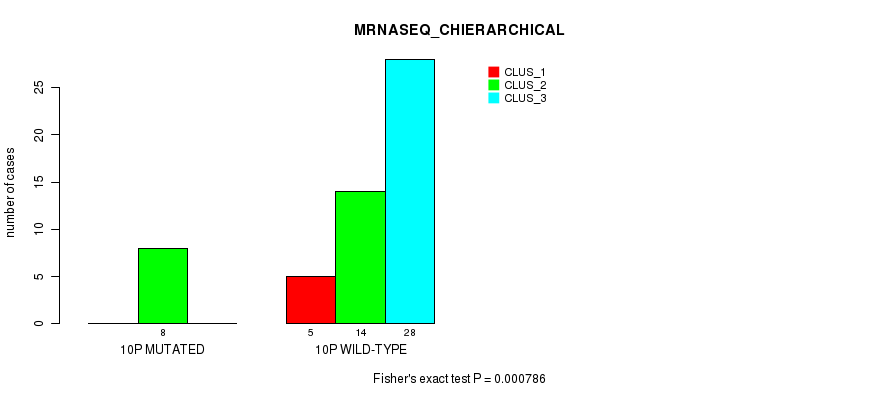
10p cnv correlated to 'CN_CNMF', 'MRNASEQ_CHIERARCHICAL', 'MIRSEQ_CHIERARCHICAL', 'MIRSEQ_MATURE_CNMF', and 'MIRSEQ_MATURE_CHIERARCHICAL'.
-
10q cnv correlated to 'CN_CNMF', 'MIRSEQ_MATURE_CNMF', and 'MIRSEQ_MATURE_CHIERARCHICAL'.
-
12p cnv correlated to 'CN_CNMF', 'MRNASEQ_CNMF', 'MRNASEQ_CHIERARCHICAL', 'MIRSEQ_CNMF', 'MIRSEQ_MATURE_CNMF', and 'MIRSEQ_MATURE_CHIERARCHICAL'.
-
12q cnv correlated to 'CN_CNMF', 'MRNASEQ_CNMF', and 'MIRSEQ_MATURE_CNMF'.
-
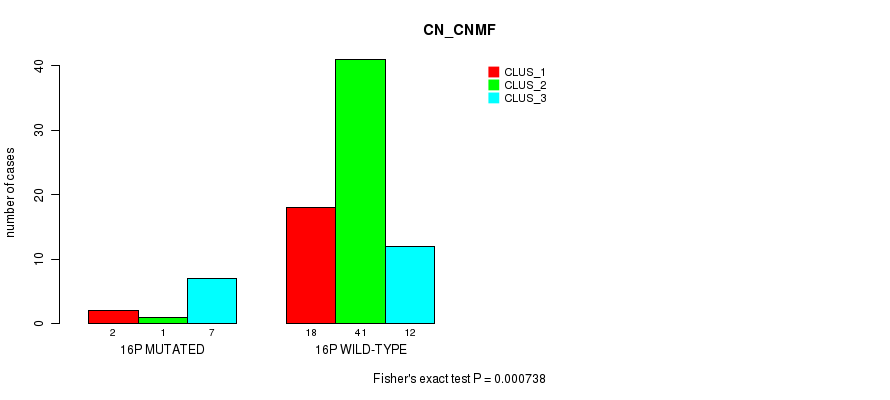
16p cnv correlated to 'CN_CNMF'.
-
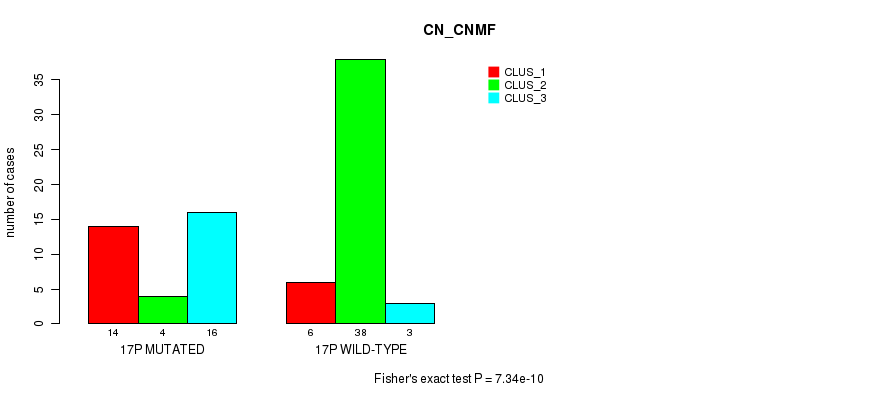
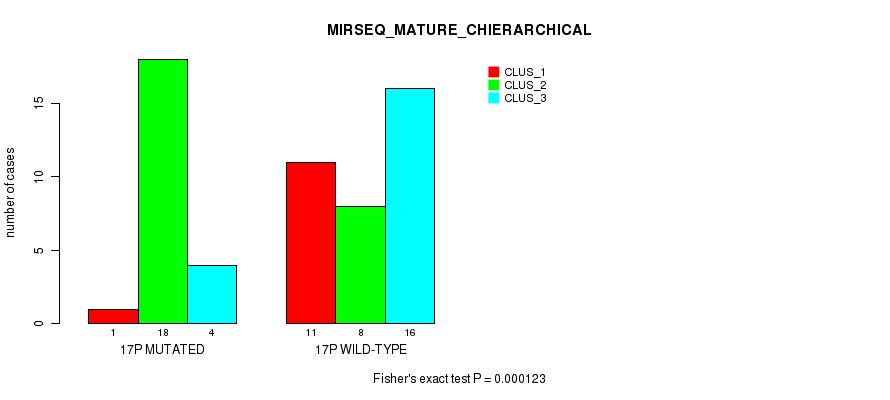
17p cnv correlated to 'CN_CNMF', 'METHLYATION_CNMF', 'MRNASEQ_CNMF', 'MRNASEQ_CHIERARCHICAL', 'MIRSEQ_CNMF', 'MIRSEQ_CHIERARCHICAL', 'MIRSEQ_MATURE_CNMF', and 'MIRSEQ_MATURE_CHIERARCHICAL'.
-
17q cnv correlated to 'CN_CNMF'.
-
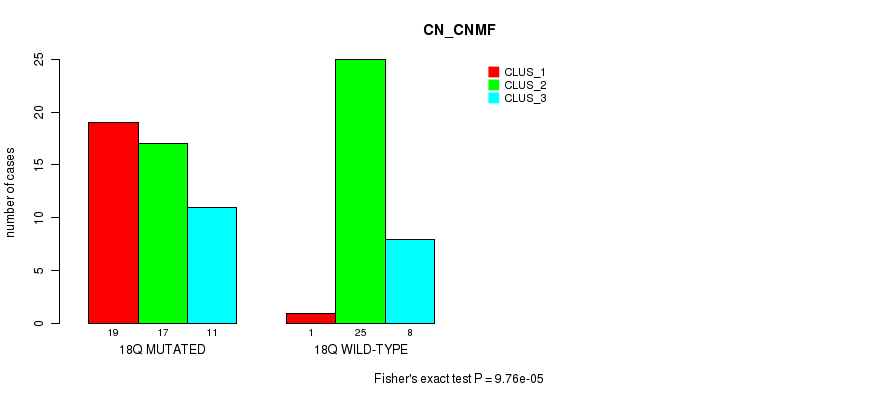
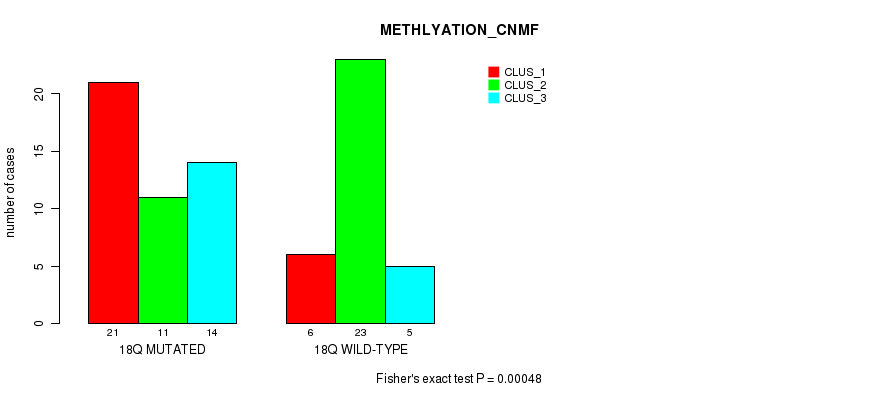
18q cnv correlated to 'CN_CNMF' and 'METHLYATION_CNMF'.
-
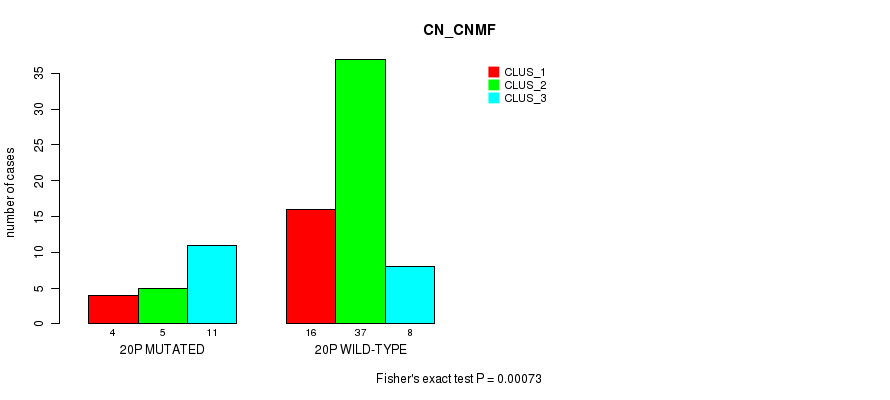
20p cnv correlated to 'CN_CNMF'.
-
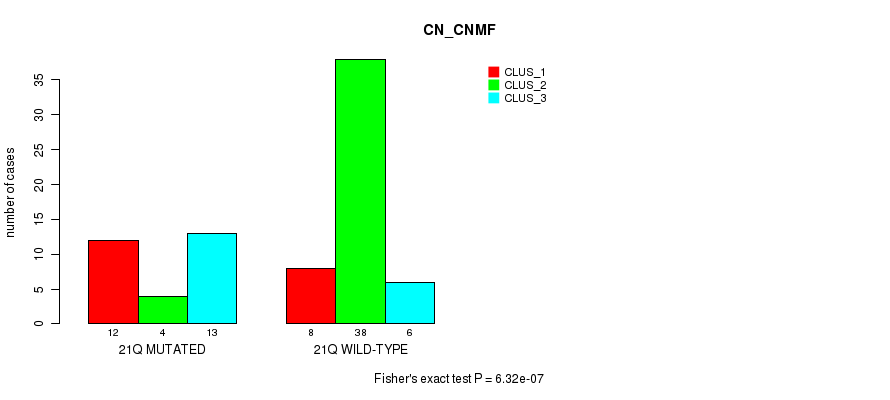
21q cnv correlated to 'CN_CNMF'.
-
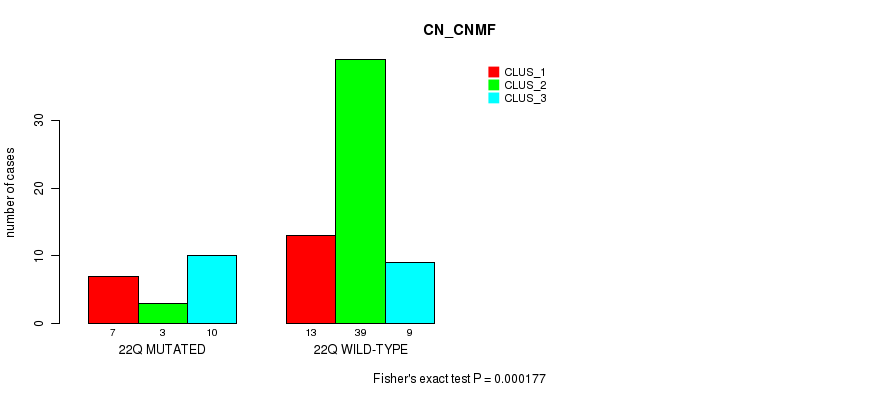
22q cnv correlated to 'CN_CNMF'.
Table 1. Get Full Table Overview of the association between significant copy number variation of 40 focal events and 8 molecular subtypes. Shown in the table are P values (Q values). Thresholded by P value < 0.05 and Q value < 0.25, 59 significant findings detected.
|
Clinical Features |
CN CNMF |
METHLYATION CNMF |
MRNASEQ CNMF |
MRNASEQ CHIERARCHICAL |
MIRSEQ CNMF |
MIRSEQ CHIERARCHICAL |
MIRSEQ MATURE CNMF |
MIRSEQ MATURE CHIERARCHICAL |
||
| nCNV (%) | nWild-Type | Fisher's exact test | Fisher's exact test | Fisher's exact test | Fisher's exact test | Fisher's exact test | Fisher's exact test | Fisher's exact test | Fisher's exact test | |
| 6q | 35 (43%) | 46 |
5.19e-05 (0.0157) |
1.49e-07 (4.75e-05) |
0.000314 (0.0898) |
4.62e-07 (0.000146) |
7.27e-05 (0.0219) |
8.59e-06 (0.00267) |
1.11e-05 (0.00344) |
4.28e-05 (0.0131) |
| 17p | 34 (42%) | 47 |
7.34e-10 (2.34e-07) |
1.52e-11 (4.87e-09) |
0.000711 (0.194) |
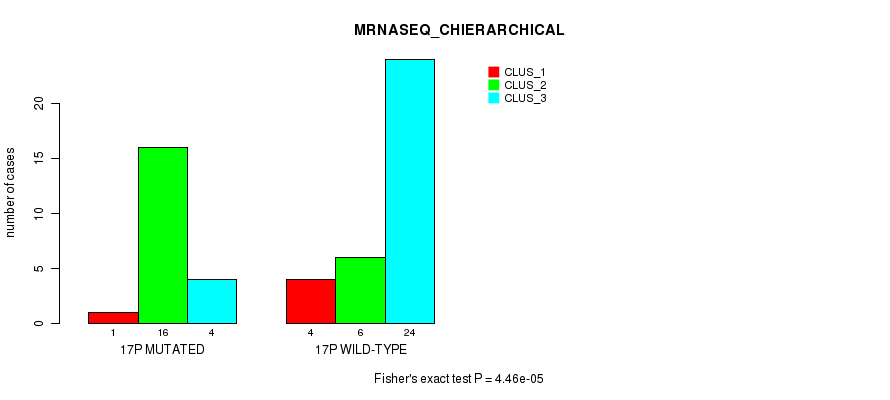
4.46e-05 (0.0135) |
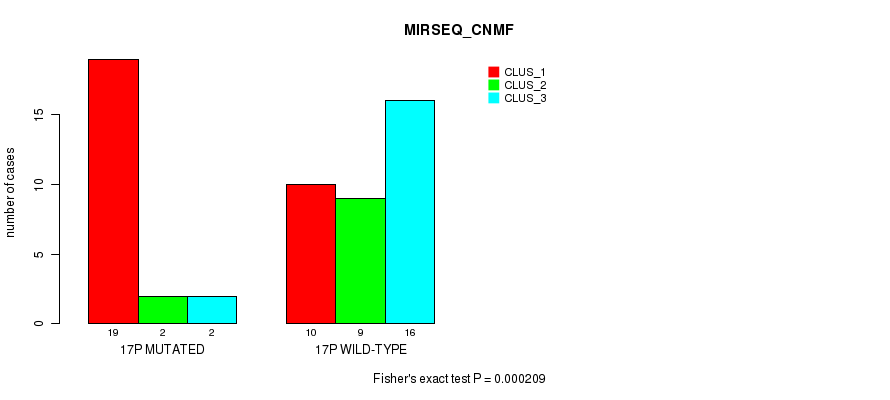
0.000209 (0.0614) |
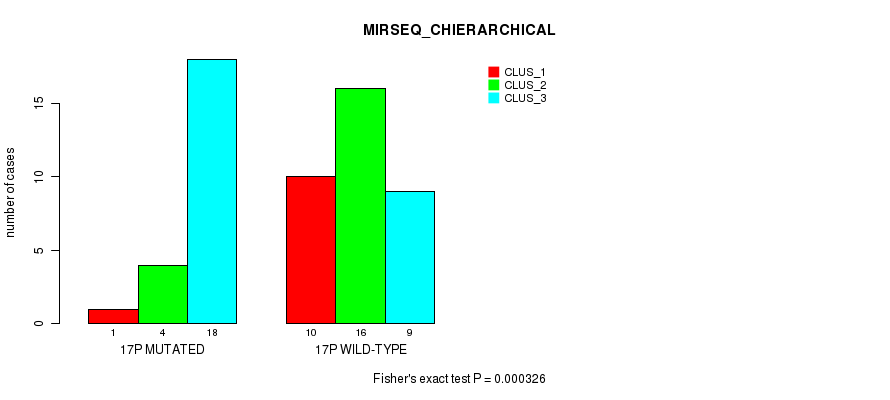
0.000326 (0.0922) |
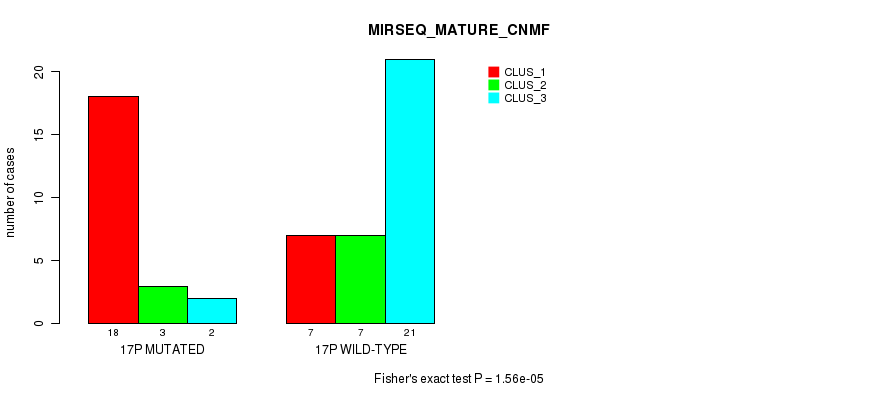
1.56e-05 (0.00481) |
0.000123 (0.0365) |
| 8q | 22 (27%) | 59 |
0.00243 (0.578) |
0.000755 (0.204) |
4.42e-05 (0.0135) |
8.83e-05 (0.0265) |
0.000555 (0.154) |
0.000982 (0.255) |
0.000507 (0.142) |
0.000654 (0.18) |
| 12p | 16 (20%) | 65 |
8.07e-06 (0.00253) |
0.00229 (0.551) |
0.000143 (0.0423) |
0.000315 (0.0898) |
0.000263 (0.0761) |
0.0019 (0.47) |
0.000232 (0.0676) |
0.000843 (0.225) |
| 6p | 29 (36%) | 52 |
2.07e-05 (0.00637) |
4.1e-06 (0.00129) |
0.000763 (0.205) |
0.00708 (1.00) |
0.00832 (1.00) |
0.000268 (0.0772) |
0.000315 (0.0898) |
0.00107 (0.275) |
| 8p | 21 (26%) | 60 |
0.00678 (1.00) |
0.000993 (0.256) |
4.42e-05 (0.0135) |
8.83e-05 (0.0265) |
0.000555 (0.154) |
0.000982 (0.255) |
0.000507 (0.142) |
0.000654 (0.18) |
| 10p | 15 (19%) | 66 |
0.000841 (0.225) |
0.0344 (1.00) |
0.019 (1.00) |
0.000786 (0.211) |
0.00192 (0.471) |
0.000862 (0.228) |
0.000212 (0.0619) |
0.000554 (0.154) |
| 10q | 16 (20%) | 65 |
8.07e-06 (0.00253) |
0.0282 (1.00) |
0.0296 (1.00) |
0.00272 (0.634) |
0.00294 (0.677) |
0.0019 (0.47) |
0.000232 (0.0676) |
0.000843 (0.225) |
| 12q | 16 (20%) | 65 |
2.99e-06 (0.000942) |
0.00229 (0.551) |
0.000899 (0.236) |
0.00384 (0.867) |
0.00107 (0.275) |
0.00564 (1.00) |
0.000448 (0.126) |
0.00397 (0.889) |
| 18q | 47 (58%) | 34 |
9.76e-05 (0.0291) |
0.00048 (0.135) |
0.0577 (1.00) |
0.0298 (1.00) |
0.08 (1.00) |
0.0181 (1.00) |
0.00999 (1.00) |
0.0405 (1.00) |
| 3p | 16 (20%) | 65 |
0.000191 (0.0561) |
0.0114 (1.00) |
0.0248 (1.00) |
0.0619 (1.00) |
0.0624 (1.00) |
0.215 (1.00) |
0.0656 (1.00) |
0.141 (1.00) |
| 3q | 15 (19%) | 66 |
0.00428 (0.946) |
0.000936 (0.245) |
0.0121 (1.00) |
0.00942 (1.00) |
0.0421 (1.00) |
0.118 (1.00) |
0.0462 (1.00) |
0.0926 (1.00) |
| 9p | 37 (46%) | 44 |
2.83e-05 (0.00868) |
0.00662 (1.00) |
0.0403 (1.00) |
0.00328 (0.749) |
0.0484 (1.00) |
0.116 (1.00) |
0.04 (1.00) |
0.0766 (1.00) |
| 16p | 10 (12%) | 71 |
0.000738 (0.2) |
0.00247 (0.585) |
0.0244 (1.00) |
0.049 (1.00) |
0.0436 (1.00) |
0.0286 (1.00) |
0.00327 (0.749) |
0.0172 (1.00) |
| 17q | 15 (19%) | 66 |
0.000309 (0.0887) |
0.00177 (0.441) |
0.0121 (1.00) |
0.0214 (1.00) |
0.0421 (1.00) |
0.118 (1.00) |
0.0179 (1.00) |
0.0926 (1.00) |
| 20p | 20 (25%) | 61 |
0.00073 (0.199) |
0.00252 (0.595) |
0.0424 (1.00) |
0.0151 (1.00) |
0.00998 (1.00) |
0.0253 (1.00) |
0.0099 (1.00) |
0.0161 (1.00) |
| 21q | 29 (36%) | 52 |
6.32e-07 (2e-04) |
0.00241 (0.576) |
0.0606 (1.00) |
0.00815 (1.00) |
0.0149 (1.00) |
0.135 (1.00) |
0.043 (1.00) |
0.0816 (1.00) |
| 22q | 20 (25%) | 61 |
0.000177 (0.0523) |
0.0178 (1.00) |
0.0248 (1.00) |
0.0619 (1.00) |
0.124 (1.00) |
0.331 (1.00) |
0.231 (1.00) |
0.256 (1.00) |
| 1p | 17 (21%) | 64 |
0.00797 (1.00) |
0.00209 (0.51) |
0.234 (1.00) |
0.245 (1.00) |
0.306 (1.00) |
0.731 (1.00) |
0.584 (1.00) |
0.668 (1.00) |
| 1q | 22 (27%) | 59 |
0.0685 (1.00) |
0.0121 (1.00) |
0.0602 (1.00) |
0.117 (1.00) |
0.159 (1.00) |
0.614 (1.00) |
0.496 (1.00) |
0.53 (1.00) |
| 2p | 12 (15%) | 69 |
0.00401 (0.894) |
0.0221 (1.00) |
0.26 (1.00) |
0.0209 (1.00) |
0.0772 (1.00) |
0.205 (1.00) |
0.0435 (1.00) |
0.185 (1.00) |
| 2q | 8 (10%) | 73 |
0.0084 (1.00) |
0.00941 (1.00) |
0.00617 (1.00) |
0.00169 (0.422) |
0.0225 (1.00) |
0.138 (1.00) |
0.0383 (1.00) |
0.092 (1.00) |
| 4p | 12 (15%) | 69 |
0.013 (1.00) |
0.112 (1.00) |
0.421 (1.00) |
0.0513 (1.00) |
0.215 (1.00) |
0.561 (1.00) |
0.136 (1.00) |
0.453 (1.00) |
| 4q | 11 (14%) | 70 |
0.0266 (1.00) |
0.0353 (1.00) |
0.349 (1.00) |
0.134 (1.00) |
0.321 (1.00) |
0.38 (1.00) |
0.606 (1.00) |
0.425 (1.00) |
| 5p | 12 (15%) | 69 |
0.00154 (0.389) |
0.0221 (1.00) |
0.0587 (1.00) |
0.0562 (1.00) |
0.108 (1.00) |
0.255 (1.00) |
0.151 (1.00) |
0.195 (1.00) |
| 5q | 12 (15%) | 69 |
0.00154 (0.389) |
0.0221 (1.00) |
0.0587 (1.00) |
0.0562 (1.00) |
0.0436 (1.00) |
0.149 (1.00) |
0.0607 (1.00) |
0.122 (1.00) |
| 7p | 21 (26%) | 60 |
0.0207 (1.00) |
0.00155 (0.39) |
0.0331 (1.00) |
0.0363 (1.00) |
0.0158 (1.00) |
0.174 (1.00) |
0.0383 (1.00) |
0.139 (1.00) |
| 7q | 19 (23%) | 62 |
0.0639 (1.00) |
0.0053 (1.00) |
0.0331 (1.00) |
0.0363 (1.00) |
0.0158 (1.00) |
0.174 (1.00) |
0.0383 (1.00) |
0.139 (1.00) |
| 9q | 24 (30%) | 57 |
0.0848 (1.00) |
0.243 (1.00) |
0.479 (1.00) |
1 (1.00) |
0.482 (1.00) |
1 (1.00) |
1 (1.00) |
1 (1.00) |
| 11p | 13 (16%) | 68 |
0.00271 (0.634) |
0.0885 (1.00) |
0.263 (1.00) |
0.777 (1.00) |
0.295 (1.00) |
1 (1.00) |
1 (1.00) |
1 (1.00) |
| 11q | 13 (16%) | 68 |
0.0283 (1.00) |
0.175 (1.00) |
0.487 (1.00) |
0.559 (1.00) |
0.816 (1.00) |
0.597 (1.00) |
0.584 (1.00) |
0.608 (1.00) |
| 13q | 16 (20%) | 65 |
0.0293 (1.00) |
1 (1.00) |
0.613 (1.00) |
0.545 (1.00) |
0.434 (1.00) |
0.762 (1.00) |
0.475 (1.00) |
0.641 (1.00) |
| 14q | 13 (16%) | 68 |
0.131 (1.00) |
0.0452 (1.00) |
0.125 (1.00) |
0.196 (1.00) |
0.477 (1.00) |
0.331 (1.00) |
0.49 (1.00) |
0.336 (1.00) |
| 15q | 17 (21%) | 64 |
0.00367 (0.832) |
0.00138 (0.349) |
0.00293 (0.677) |
0.0018 (0.447) |
0.00105 (0.271) |
0.00621 (1.00) |
0.00417 (0.926) |
0.00387 (0.871) |
| 16q | 11 (14%) | 70 |
0.000967 (0.252) |
0.00258 (0.606) |
0.00999 (1.00) |
0.133 (1.00) |
0.0256 (1.00) |
0.00895 (1.00) |
0.00227 (0.549) |
0.0089 (1.00) |
| 18p | 39 (48%) | 42 |
0.131 (1.00) |
0.00509 (1.00) |
0.536 (1.00) |
0.373 (1.00) |
0.438 (1.00) |
0.203 (1.00) |
0.0966 (1.00) |
0.308 (1.00) |
| 19p | 11 (14%) | 70 |
0.0124 (1.00) |
0.197 (1.00) |
0.0296 (1.00) |
0.00272 (0.634) |
0.00844 (1.00) |
0.0291 (1.00) |
0.0118 (1.00) |
0.0253 (1.00) |
| 19q | 14 (17%) | 67 |
0.0976 (1.00) |
0.175 (1.00) |
0.0939 (1.00) |
0.00914 (1.00) |
0.034 (1.00) |
0.0135 (1.00) |
0.037 (1.00) |
0.0921 (1.00) |
| 20q | 18 (22%) | 63 |
0.00223 (0.541) |
0.0349 (1.00) |
0.12 (1.00) |
0.00942 (1.00) |
0.0194 (1.00) |
0.0529 (1.00) |
0.00922 (1.00) |
0.04 (1.00) |
| xq | 8 (10%) | 73 |
0.134 (1.00) |
0.509 (1.00) |
0.391 (1.00) |
0.615 (1.00) |
0.204 (1.00) |
1 (1.00) |
0.248 (1.00) |
0.342 (1.00) |
P value = 0.000191 (Fisher's exact test), Q value = 0.056
Table S1. Gene #5: '3p' versus Molecular Subtype #1: 'CN_CNMF'
| nPatients | CLUS_1 | CLUS_2 | CLUS_3 |
|---|---|---|---|
| ALL | 20 | 42 | 19 |
| 3P MUTATED | 3 | 3 | 10 |
| 3P WILD-TYPE | 17 | 39 | 9 |
Figure S1. Get High-res Image Gene #5: '3p' versus Molecular Subtype #1: 'CN_CNMF'
P value = 0.000936 (Fisher's exact test), Q value = 0.25
Table S2. Gene #6: '3q' versus Molecular Subtype #2: 'METHLYATION_CNMF'
| nPatients | CLUS_1 | CLUS_2 | CLUS_3 |
|---|---|---|---|
| ALL | 27 | 34 | 19 |
| 3Q MUTATED | 6 | 1 | 8 |
| 3Q WILD-TYPE | 21 | 33 | 11 |
Figure S2. Get High-res Image Gene #6: '3q' versus Molecular Subtype #2: 'METHLYATION_CNMF'
P value = 2.07e-05 (Fisher's exact test), Q value = 0.0064
Table S3. Gene #11: '6p' versus Molecular Subtype #1: 'CN_CNMF'
| nPatients | CLUS_1 | CLUS_2 | CLUS_3 |
|---|---|---|---|
| ALL | 20 | 42 | 19 |
| 6P MUTATED | 9 | 6 | 14 |
| 6P WILD-TYPE | 11 | 36 | 5 |
Figure S3. Get High-res Image Gene #11: '6p' versus Molecular Subtype #1: 'CN_CNMF'
P value = 4.1e-06 (Fisher's exact test), Q value = 0.0013
Table S4. Gene #11: '6p' versus Molecular Subtype #2: 'METHLYATION_CNMF'
| nPatients | CLUS_1 | CLUS_2 | CLUS_3 |
|---|---|---|---|
| ALL | 27 | 34 | 19 |
| 6P MUTATED | 15 | 2 | 11 |
| 6P WILD-TYPE | 12 | 32 | 8 |
Figure S4. Get High-res Image Gene #11: '6p' versus Molecular Subtype #2: 'METHLYATION_CNMF'
P value = 0.000763 (Fisher's exact test), Q value = 0.21
Table S5. Gene #11: '6p' versus Molecular Subtype #3: 'MRNASEQ_CNMF'
| nPatients | CLUS_1 | CLUS_2 | CLUS_3 | CLUS_4 |
|---|---|---|---|---|
| ALL | 21 | 12 | 12 | 10 |
| 6P MUTATED | 13 | 2 | 2 | 0 |
| 6P WILD-TYPE | 8 | 10 | 10 | 10 |
Figure S5. Get High-res Image Gene #11: '6p' versus Molecular Subtype #3: 'MRNASEQ_CNMF'
P value = 0.000268 (Fisher's exact test), Q value = 0.077
Table S6. Gene #11: '6p' versus Molecular Subtype #6: 'MIRSEQ_CHIERARCHICAL'
| nPatients | CLUS_1 | CLUS_2 | CLUS_3 |
|---|---|---|---|
| ALL | 11 | 20 | 27 |
| 6P MUTATED | 1 | 2 | 16 |
| 6P WILD-TYPE | 10 | 18 | 11 |
Figure S6. Get High-res Image Gene #11: '6p' versus Molecular Subtype #6: 'MIRSEQ_CHIERARCHICAL'
P value = 0.000315 (Fisher's exact test), Q value = 0.09
Table S7. Gene #11: '6p' versus Molecular Subtype #7: 'MIRSEQ_MATURE_CNMF'
| nPatients | CLUS_1 | CLUS_2 | CLUS_3 |
|---|---|---|---|
| ALL | 25 | 10 | 23 |
| 6P MUTATED | 15 | 0 | 4 |
| 6P WILD-TYPE | 10 | 10 | 19 |
Figure S7. Get High-res Image Gene #11: '6p' versus Molecular Subtype #7: 'MIRSEQ_MATURE_CNMF'
P value = 5.19e-05 (Fisher's exact test), Q value = 0.016
Table S8. Gene #12: '6q' versus Molecular Subtype #1: 'CN_CNMF'
| nPatients | CLUS_1 | CLUS_2 | CLUS_3 |
|---|---|---|---|
| ALL | 20 | 42 | 19 |
| 6Q MUTATED | 11 | 9 | 15 |
| 6Q WILD-TYPE | 9 | 33 | 4 |
Figure S8. Get High-res Image Gene #12: '6q' versus Molecular Subtype #1: 'CN_CNMF'
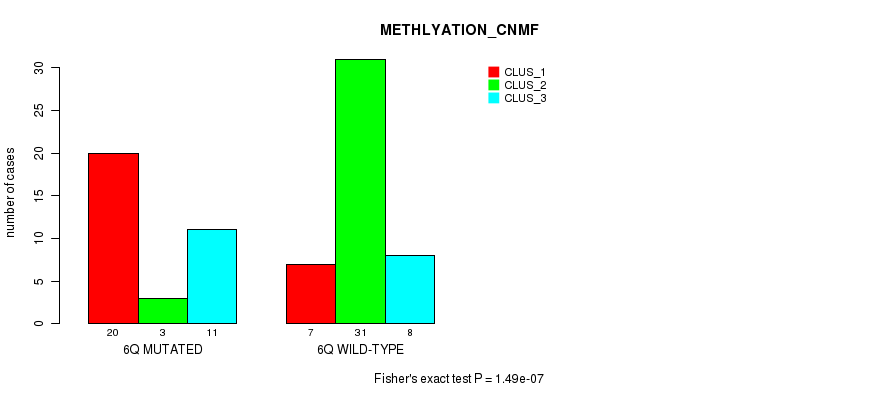
P value = 1.49e-07 (Fisher's exact test), Q value = 4.8e-05
Table S9. Gene #12: '6q' versus Molecular Subtype #2: 'METHLYATION_CNMF'
| nPatients | CLUS_1 | CLUS_2 | CLUS_3 |
|---|---|---|---|
| ALL | 27 | 34 | 19 |
| 6Q MUTATED | 20 | 3 | 11 |
| 6Q WILD-TYPE | 7 | 31 | 8 |
Figure S9. Get High-res Image Gene #12: '6q' versus Molecular Subtype #2: 'METHLYATION_CNMF'
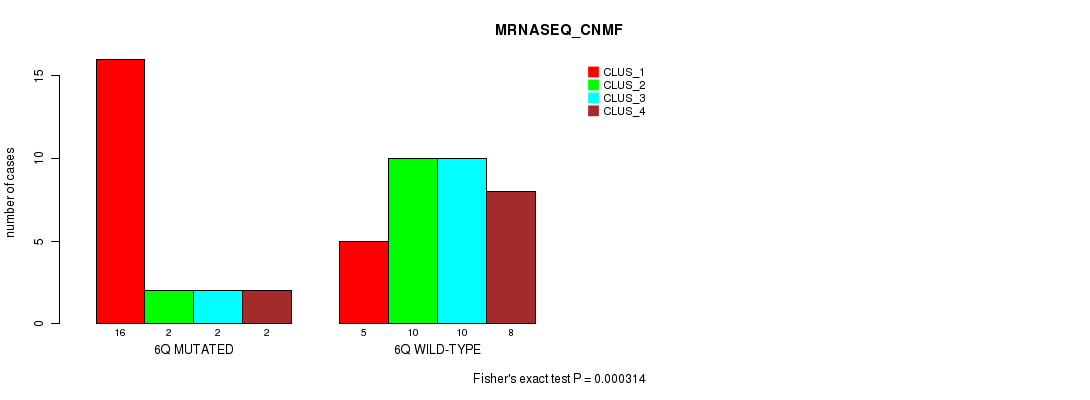
P value = 0.000314 (Fisher's exact test), Q value = 0.09
Table S10. Gene #12: '6q' versus Molecular Subtype #3: 'MRNASEQ_CNMF'
| nPatients | CLUS_1 | CLUS_2 | CLUS_3 | CLUS_4 |
|---|---|---|---|---|
| ALL | 21 | 12 | 12 | 10 |
| 6Q MUTATED | 16 | 2 | 2 | 2 |
| 6Q WILD-TYPE | 5 | 10 | 10 | 8 |
Figure S10. Get High-res Image Gene #12: '6q' versus Molecular Subtype #3: 'MRNASEQ_CNMF'
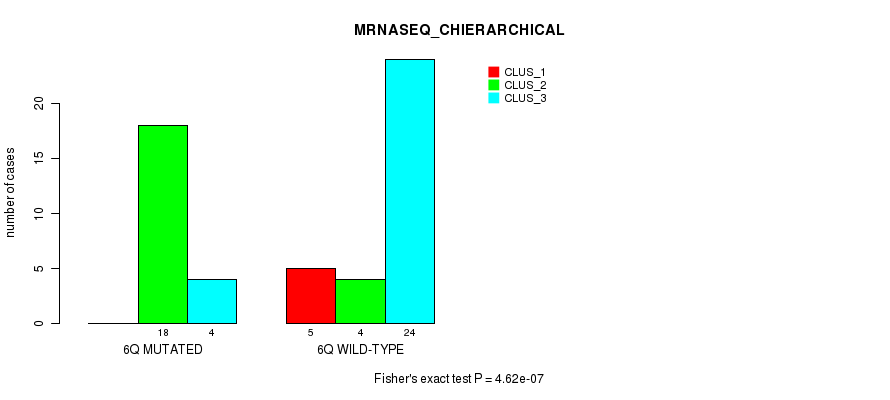
P value = 4.62e-07 (Fisher's exact test), Q value = 0.00015
Table S11. Gene #12: '6q' versus Molecular Subtype #4: 'MRNASEQ_CHIERARCHICAL'
| nPatients | CLUS_1 | CLUS_2 | CLUS_3 |
|---|---|---|---|
| ALL | 5 | 22 | 28 |
| 6Q MUTATED | 0 | 18 | 4 |
| 6Q WILD-TYPE | 5 | 4 | 24 |
Figure S11. Get High-res Image Gene #12: '6q' versus Molecular Subtype #4: 'MRNASEQ_CHIERARCHICAL'
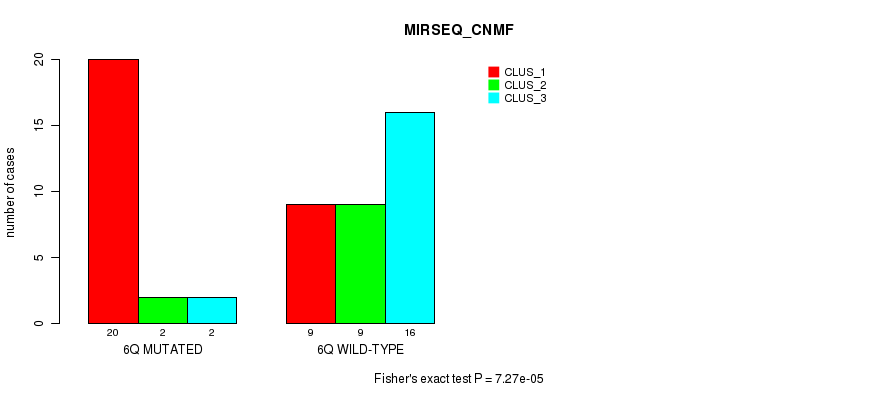
P value = 7.27e-05 (Fisher's exact test), Q value = 0.022
Table S12. Gene #12: '6q' versus Molecular Subtype #5: 'MIRSEQ_CNMF'
| nPatients | CLUS_1 | CLUS_2 | CLUS_3 |
|---|---|---|---|
| ALL | 29 | 11 | 18 |
| 6Q MUTATED | 20 | 2 | 2 |
| 6Q WILD-TYPE | 9 | 9 | 16 |
Figure S12. Get High-res Image Gene #12: '6q' versus Molecular Subtype #5: 'MIRSEQ_CNMF'
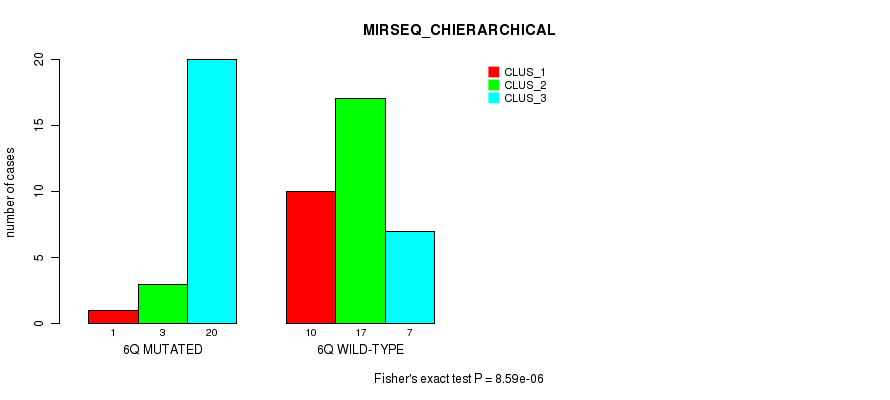
P value = 8.59e-06 (Fisher's exact test), Q value = 0.0027
Table S13. Gene #12: '6q' versus Molecular Subtype #6: 'MIRSEQ_CHIERARCHICAL'
| nPatients | CLUS_1 | CLUS_2 | CLUS_3 |
|---|---|---|---|
| ALL | 11 | 20 | 27 |
| 6Q MUTATED | 1 | 3 | 20 |
| 6Q WILD-TYPE | 10 | 17 | 7 |
Figure S13. Get High-res Image Gene #12: '6q' versus Molecular Subtype #6: 'MIRSEQ_CHIERARCHICAL'
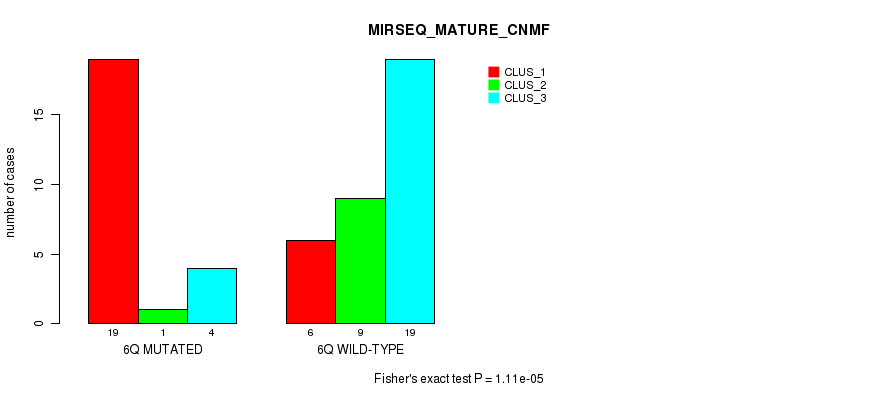
P value = 1.11e-05 (Fisher's exact test), Q value = 0.0034
Table S14. Gene #12: '6q' versus Molecular Subtype #7: 'MIRSEQ_MATURE_CNMF'
| nPatients | CLUS_1 | CLUS_2 | CLUS_3 |
|---|---|---|---|
| ALL | 25 | 10 | 23 |
| 6Q MUTATED | 19 | 1 | 4 |
| 6Q WILD-TYPE | 6 | 9 | 19 |
Figure S14. Get High-res Image Gene #12: '6q' versus Molecular Subtype #7: 'MIRSEQ_MATURE_CNMF'
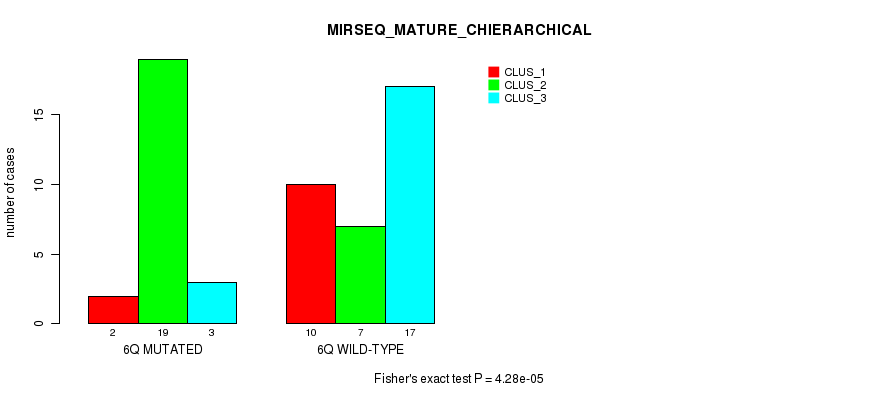
P value = 4.28e-05 (Fisher's exact test), Q value = 0.013
Table S15. Gene #12: '6q' versus Molecular Subtype #8: 'MIRSEQ_MATURE_CHIERARCHICAL'
| nPatients | CLUS_1 | CLUS_2 | CLUS_3 |
|---|---|---|---|
| ALL | 12 | 26 | 20 |
| 6Q MUTATED | 2 | 19 | 3 |
| 6Q WILD-TYPE | 10 | 7 | 17 |
Figure S15. Get High-res Image Gene #12: '6q' versus Molecular Subtype #8: 'MIRSEQ_MATURE_CHIERARCHICAL'
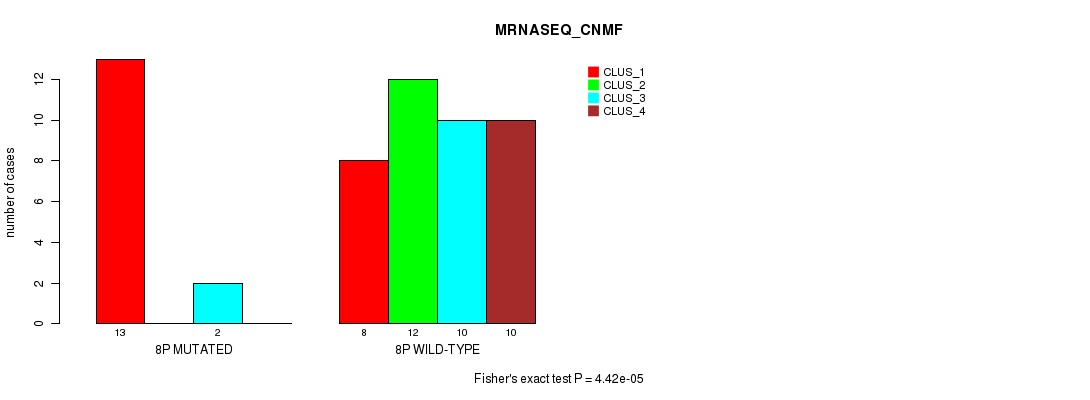
P value = 4.42e-05 (Fisher's exact test), Q value = 0.013
Table S16. Gene #15: '8p' versus Molecular Subtype #3: 'MRNASEQ_CNMF'
| nPatients | CLUS_1 | CLUS_2 | CLUS_3 | CLUS_4 |
|---|---|---|---|---|
| ALL | 21 | 12 | 12 | 10 |
| 8P MUTATED | 13 | 0 | 2 | 0 |
| 8P WILD-TYPE | 8 | 12 | 10 | 10 |
Figure S16. Get High-res Image Gene #15: '8p' versus Molecular Subtype #3: 'MRNASEQ_CNMF'
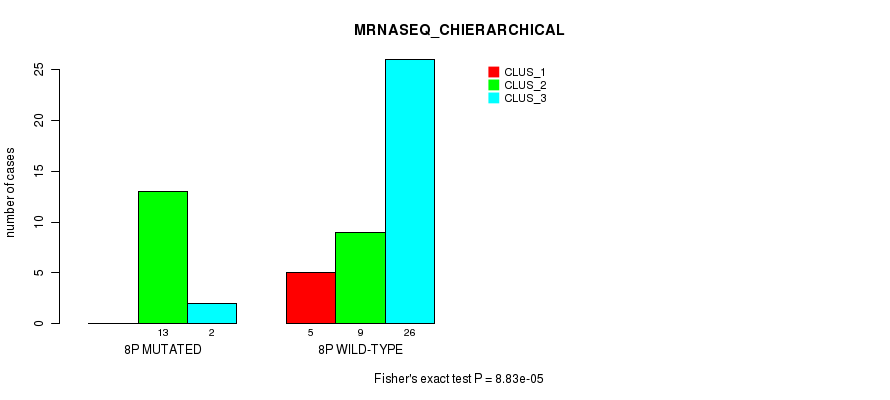
P value = 8.83e-05 (Fisher's exact test), Q value = 0.026
Table S17. Gene #15: '8p' versus Molecular Subtype #4: 'MRNASEQ_CHIERARCHICAL'
| nPatients | CLUS_1 | CLUS_2 | CLUS_3 |
|---|---|---|---|
| ALL | 5 | 22 | 28 |
| 8P MUTATED | 0 | 13 | 2 |
| 8P WILD-TYPE | 5 | 9 | 26 |
Figure S17. Get High-res Image Gene #15: '8p' versus Molecular Subtype #4: 'MRNASEQ_CHIERARCHICAL'
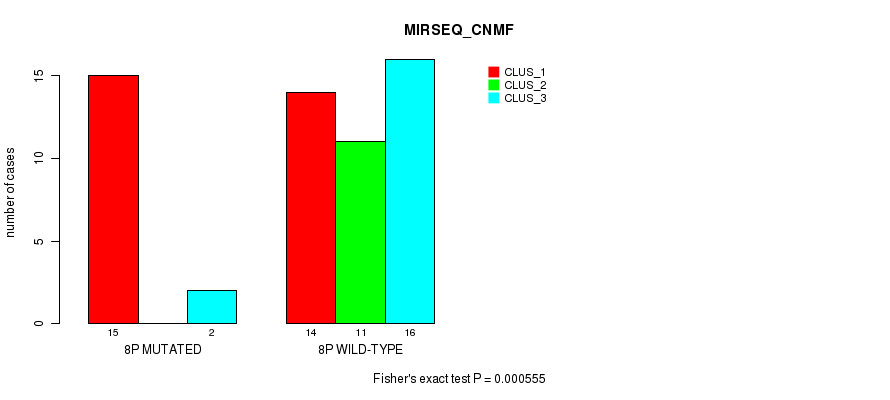
P value = 0.000555 (Fisher's exact test), Q value = 0.15
Table S18. Gene #15: '8p' versus Molecular Subtype #5: 'MIRSEQ_CNMF'
| nPatients | CLUS_1 | CLUS_2 | CLUS_3 |
|---|---|---|---|
| ALL | 29 | 11 | 18 |
| 8P MUTATED | 15 | 0 | 2 |
| 8P WILD-TYPE | 14 | 11 | 16 |
Figure S18. Get High-res Image Gene #15: '8p' versus Molecular Subtype #5: 'MIRSEQ_CNMF'
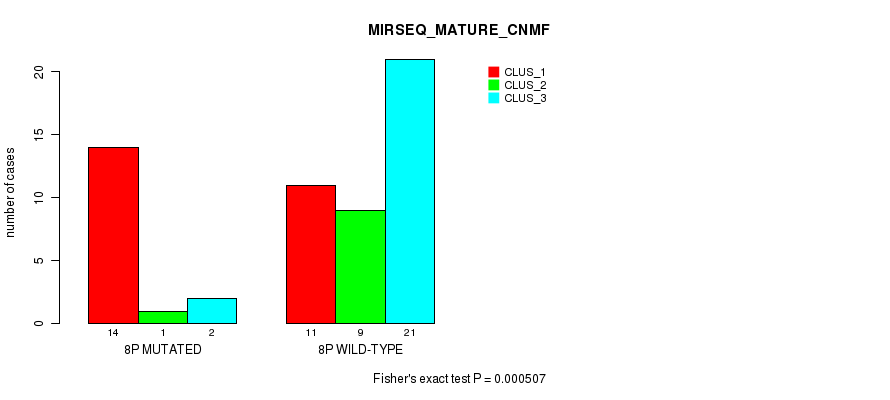
P value = 0.000507 (Fisher's exact test), Q value = 0.14
Table S19. Gene #15: '8p' versus Molecular Subtype #7: 'MIRSEQ_MATURE_CNMF'
| nPatients | CLUS_1 | CLUS_2 | CLUS_3 |
|---|---|---|---|
| ALL | 25 | 10 | 23 |
| 8P MUTATED | 14 | 1 | 2 |
| 8P WILD-TYPE | 11 | 9 | 21 |
Figure S19. Get High-res Image Gene #15: '8p' versus Molecular Subtype #7: 'MIRSEQ_MATURE_CNMF'
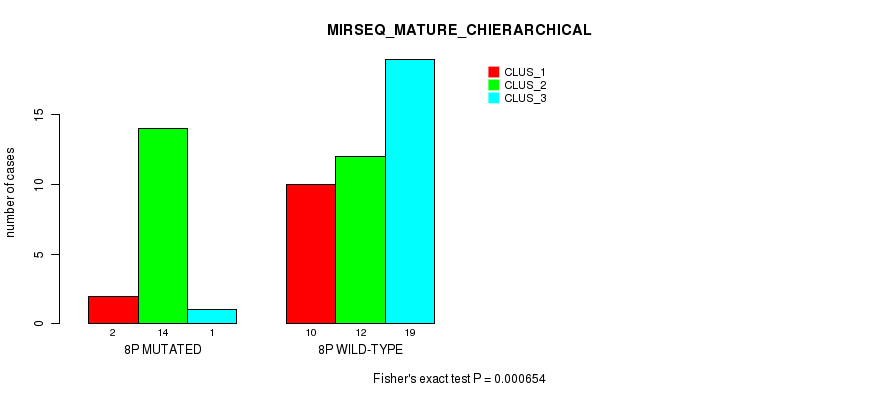
P value = 0.000654 (Fisher's exact test), Q value = 0.18
Table S20. Gene #15: '8p' versus Molecular Subtype #8: 'MIRSEQ_MATURE_CHIERARCHICAL'
| nPatients | CLUS_1 | CLUS_2 | CLUS_3 |
|---|---|---|---|
| ALL | 12 | 26 | 20 |
| 8P MUTATED | 2 | 14 | 1 |
| 8P WILD-TYPE | 10 | 12 | 19 |
Figure S20. Get High-res Image Gene #15: '8p' versus Molecular Subtype #8: 'MIRSEQ_MATURE_CHIERARCHICAL'
P value = 0.000755 (Fisher's exact test), Q value = 0.2
Table S21. Gene #16: '8q' versus Molecular Subtype #2: 'METHLYATION_CNMF'
| nPatients | CLUS_1 | CLUS_2 | CLUS_3 |
|---|---|---|---|
| ALL | 27 | 34 | 19 |
| 8Q MUTATED | 12 | 2 | 7 |
| 8Q WILD-TYPE | 15 | 32 | 12 |
Figure S21. Get High-res Image Gene #16: '8q' versus Molecular Subtype #2: 'METHLYATION_CNMF'
P value = 4.42e-05 (Fisher's exact test), Q value = 0.013
Table S22. Gene #16: '8q' versus Molecular Subtype #3: 'MRNASEQ_CNMF'
| nPatients | CLUS_1 | CLUS_2 | CLUS_3 | CLUS_4 |
|---|---|---|---|---|
| ALL | 21 | 12 | 12 | 10 |
| 8Q MUTATED | 13 | 0 | 2 | 0 |
| 8Q WILD-TYPE | 8 | 12 | 10 | 10 |
Figure S22. Get High-res Image Gene #16: '8q' versus Molecular Subtype #3: 'MRNASEQ_CNMF'

P value = 8.83e-05 (Fisher's exact test), Q value = 0.026
Table S23. Gene #16: '8q' versus Molecular Subtype #4: 'MRNASEQ_CHIERARCHICAL'
| nPatients | CLUS_1 | CLUS_2 | CLUS_3 |
|---|---|---|---|
| ALL | 5 | 22 | 28 |
| 8Q MUTATED | 0 | 13 | 2 |
| 8Q WILD-TYPE | 5 | 9 | 26 |
Figure S23. Get High-res Image Gene #16: '8q' versus Molecular Subtype #4: 'MRNASEQ_CHIERARCHICAL'

P value = 0.000555 (Fisher's exact test), Q value = 0.15
Table S24. Gene #16: '8q' versus Molecular Subtype #5: 'MIRSEQ_CNMF'
| nPatients | CLUS_1 | CLUS_2 | CLUS_3 |
|---|---|---|---|
| ALL | 29 | 11 | 18 |
| 8Q MUTATED | 15 | 0 | 2 |
| 8Q WILD-TYPE | 14 | 11 | 16 |
Figure S24. Get High-res Image Gene #16: '8q' versus Molecular Subtype #5: 'MIRSEQ_CNMF'

P value = 0.000507 (Fisher's exact test), Q value = 0.14
Table S25. Gene #16: '8q' versus Molecular Subtype #7: 'MIRSEQ_MATURE_CNMF'
| nPatients | CLUS_1 | CLUS_2 | CLUS_3 |
|---|---|---|---|
| ALL | 25 | 10 | 23 |
| 8Q MUTATED | 14 | 1 | 2 |
| 8Q WILD-TYPE | 11 | 9 | 21 |
Figure S25. Get High-res Image Gene #16: '8q' versus Molecular Subtype #7: 'MIRSEQ_MATURE_CNMF'

P value = 0.000654 (Fisher's exact test), Q value = 0.18
Table S26. Gene #16: '8q' versus Molecular Subtype #8: 'MIRSEQ_MATURE_CHIERARCHICAL'
| nPatients | CLUS_1 | CLUS_2 | CLUS_3 |
|---|---|---|---|
| ALL | 12 | 26 | 20 |
| 8Q MUTATED | 2 | 14 | 1 |
| 8Q WILD-TYPE | 10 | 12 | 19 |
Figure S26. Get High-res Image Gene #16: '8q' versus Molecular Subtype #8: 'MIRSEQ_MATURE_CHIERARCHICAL'

P value = 2.83e-05 (Fisher's exact test), Q value = 0.0087
Table S27. Gene #17: '9p' versus Molecular Subtype #1: 'CN_CNMF'
| nPatients | CLUS_1 | CLUS_2 | CLUS_3 |
|---|---|---|---|
| ALL | 20 | 42 | 19 |
| 9P MUTATED | 11 | 10 | 16 |
| 9P WILD-TYPE | 9 | 32 | 3 |
Figure S27. Get High-res Image Gene #17: '9p' versus Molecular Subtype #1: 'CN_CNMF'
P value = 0.000841 (Fisher's exact test), Q value = 0.22
Table S28. Gene #19: '10p' versus Molecular Subtype #1: 'CN_CNMF'
| nPatients | CLUS_1 | CLUS_2 | CLUS_3 |
|---|---|---|---|
| ALL | 20 | 42 | 19 |
| 10P MUTATED | 5 | 2 | 8 |
| 10P WILD-TYPE | 15 | 40 | 11 |
Figure S28. Get High-res Image Gene #19: '10p' versus Molecular Subtype #1: 'CN_CNMF'
P value = 0.000786 (Fisher's exact test), Q value = 0.21
Table S29. Gene #19: '10p' versus Molecular Subtype #4: 'MRNASEQ_CHIERARCHICAL'
| nPatients | CLUS_1 | CLUS_2 | CLUS_3 |
|---|---|---|---|
| ALL | 5 | 22 | 28 |
| 10P MUTATED | 0 | 8 | 0 |
| 10P WILD-TYPE | 5 | 14 | 28 |
Figure S29. Get High-res Image Gene #19: '10p' versus Molecular Subtype #4: 'MRNASEQ_CHIERARCHICAL'
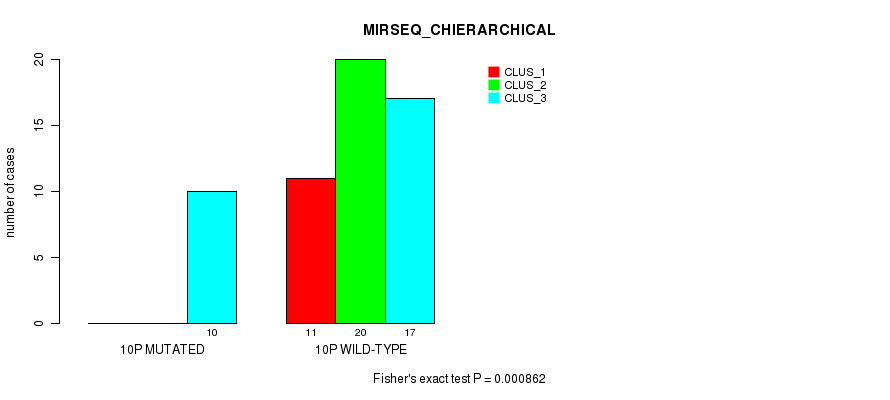
P value = 0.000862 (Fisher's exact test), Q value = 0.23
Table S30. Gene #19: '10p' versus Molecular Subtype #6: 'MIRSEQ_CHIERARCHICAL'
| nPatients | CLUS_1 | CLUS_2 | CLUS_3 |
|---|---|---|---|
| ALL | 11 | 20 | 27 |
| 10P MUTATED | 0 | 0 | 10 |
| 10P WILD-TYPE | 11 | 20 | 17 |
Figure S30. Get High-res Image Gene #19: '10p' versus Molecular Subtype #6: 'MIRSEQ_CHIERARCHICAL'
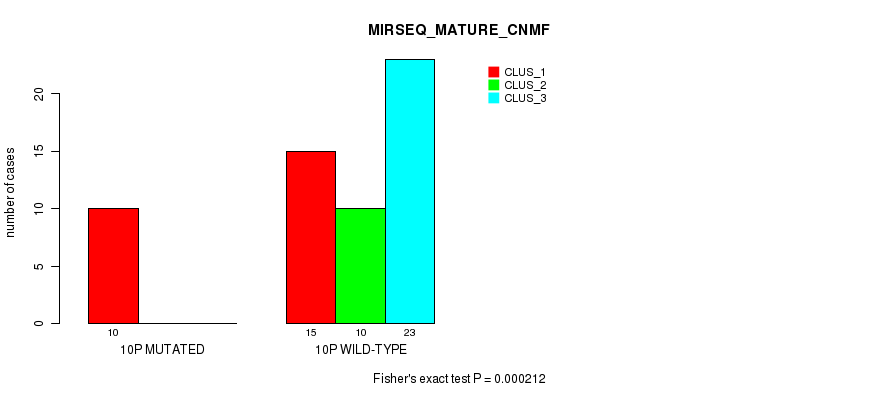
P value = 0.000212 (Fisher's exact test), Q value = 0.062
Table S31. Gene #19: '10p' versus Molecular Subtype #7: 'MIRSEQ_MATURE_CNMF'
| nPatients | CLUS_1 | CLUS_2 | CLUS_3 |
|---|---|---|---|
| ALL | 25 | 10 | 23 |
| 10P MUTATED | 10 | 0 | 0 |
| 10P WILD-TYPE | 15 | 10 | 23 |
Figure S31. Get High-res Image Gene #19: '10p' versus Molecular Subtype #7: 'MIRSEQ_MATURE_CNMF'
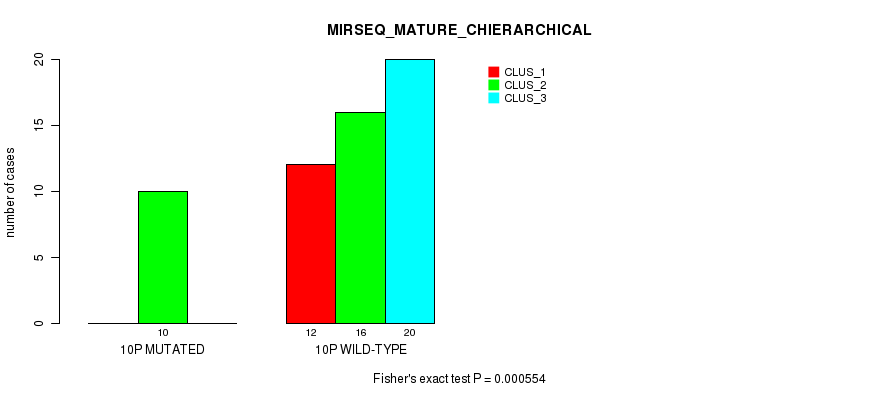
P value = 0.000554 (Fisher's exact test), Q value = 0.15
Table S32. Gene #19: '10p' versus Molecular Subtype #8: 'MIRSEQ_MATURE_CHIERARCHICAL'
| nPatients | CLUS_1 | CLUS_2 | CLUS_3 |
|---|---|---|---|
| ALL | 12 | 26 | 20 |
| 10P MUTATED | 0 | 10 | 0 |
| 10P WILD-TYPE | 12 | 16 | 20 |
Figure S32. Get High-res Image Gene #19: '10p' versus Molecular Subtype #8: 'MIRSEQ_MATURE_CHIERARCHICAL'
P value = 8.07e-06 (Fisher's exact test), Q value = 0.0025
Table S33. Gene #20: '10q' versus Molecular Subtype #1: 'CN_CNMF'
| nPatients | CLUS_1 | CLUS_2 | CLUS_3 |
|---|---|---|---|
| ALL | 20 | 42 | 19 |
| 10Q MUTATED | 5 | 1 | 10 |
| 10Q WILD-TYPE | 15 | 41 | 9 |
Figure S33. Get High-res Image Gene #20: '10q' versus Molecular Subtype #1: 'CN_CNMF'

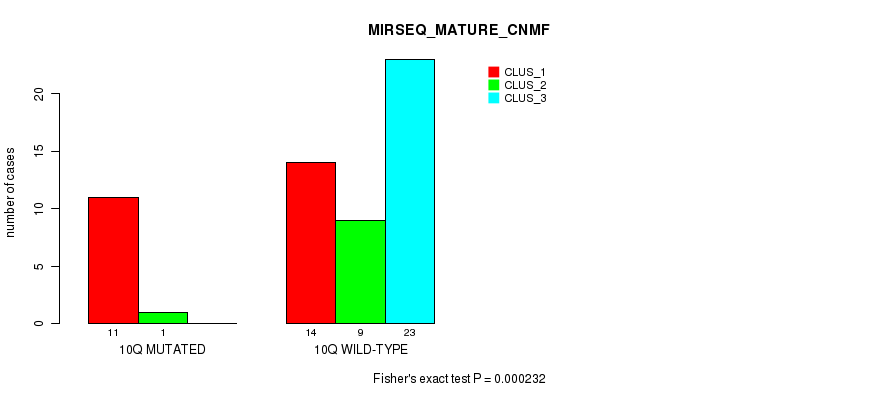
P value = 0.000232 (Fisher's exact test), Q value = 0.068
Table S34. Gene #20: '10q' versus Molecular Subtype #7: 'MIRSEQ_MATURE_CNMF'
| nPatients | CLUS_1 | CLUS_2 | CLUS_3 |
|---|---|---|---|
| ALL | 25 | 10 | 23 |
| 10Q MUTATED | 11 | 1 | 0 |
| 10Q WILD-TYPE | 14 | 9 | 23 |
Figure S34. Get High-res Image Gene #20: '10q' versus Molecular Subtype #7: 'MIRSEQ_MATURE_CNMF'
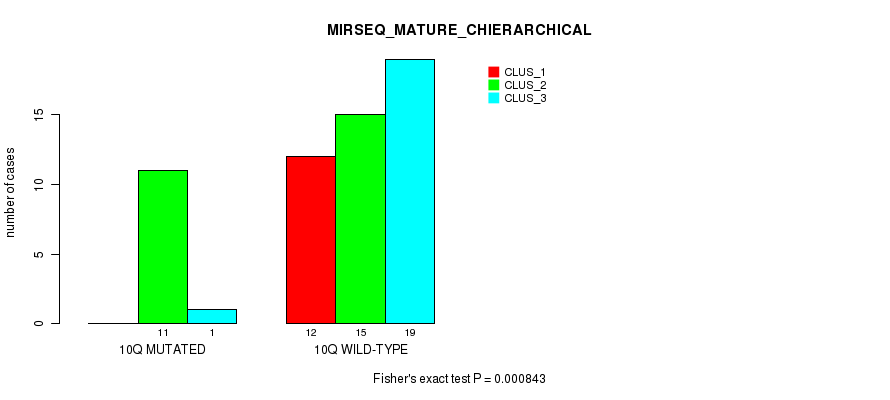
P value = 0.000843 (Fisher's exact test), Q value = 0.22
Table S35. Gene #20: '10q' versus Molecular Subtype #8: 'MIRSEQ_MATURE_CHIERARCHICAL'
| nPatients | CLUS_1 | CLUS_2 | CLUS_3 |
|---|---|---|---|
| ALL | 12 | 26 | 20 |
| 10Q MUTATED | 0 | 11 | 1 |
| 10Q WILD-TYPE | 12 | 15 | 19 |
Figure S35. Get High-res Image Gene #20: '10q' versus Molecular Subtype #8: 'MIRSEQ_MATURE_CHIERARCHICAL'
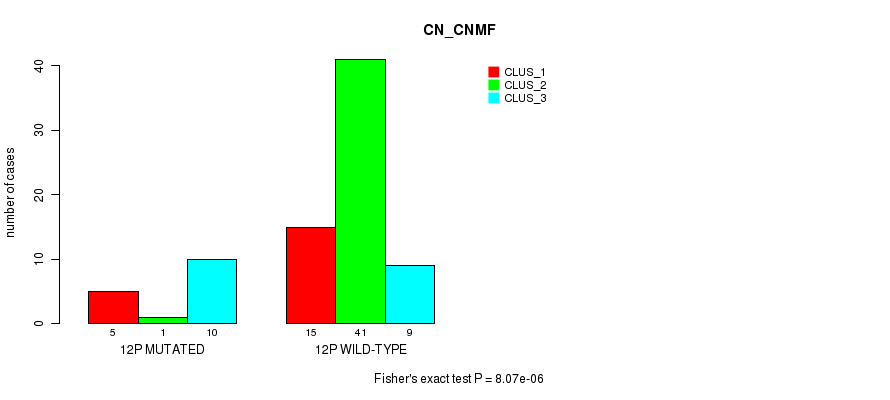
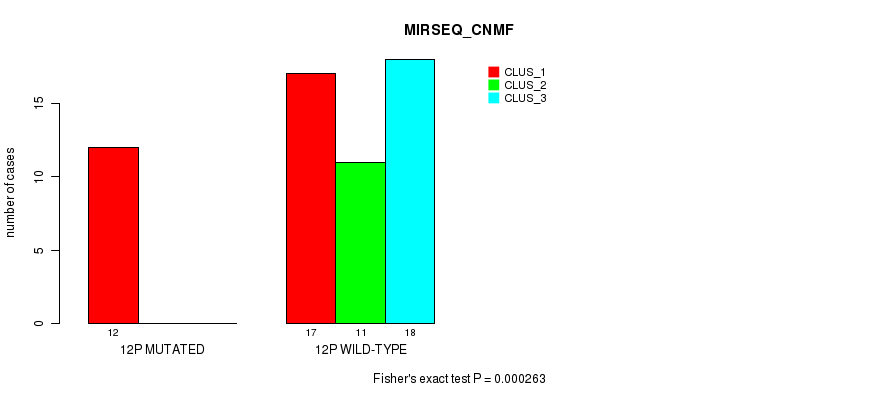
P value = 8.07e-06 (Fisher's exact test), Q value = 0.0025
Table S36. Gene #23: '12p' versus Molecular Subtype #1: 'CN_CNMF'
| nPatients | CLUS_1 | CLUS_2 | CLUS_3 |
|---|---|---|---|
| ALL | 20 | 42 | 19 |
| 12P MUTATED | 5 | 1 | 10 |
| 12P WILD-TYPE | 15 | 41 | 9 |
Figure S36. Get High-res Image Gene #23: '12p' versus Molecular Subtype #1: 'CN_CNMF'
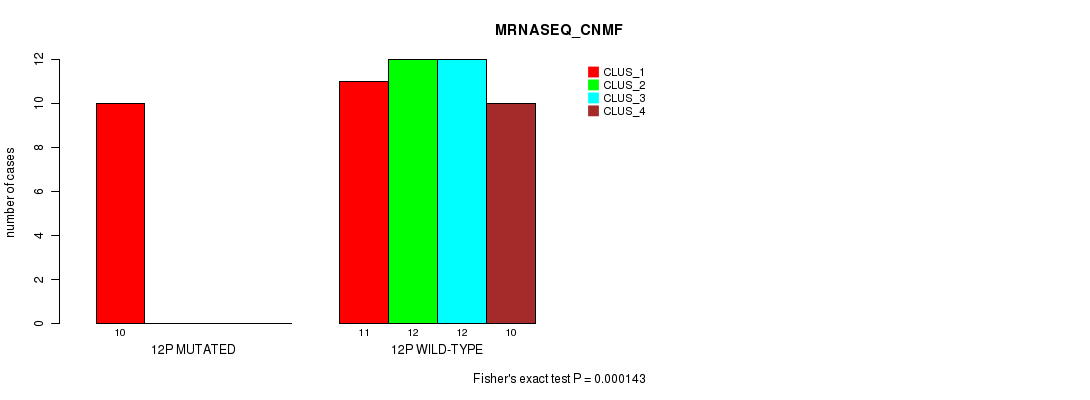
P value = 0.000143 (Fisher's exact test), Q value = 0.042
Table S37. Gene #23: '12p' versus Molecular Subtype #3: 'MRNASEQ_CNMF'
| nPatients | CLUS_1 | CLUS_2 | CLUS_3 | CLUS_4 |
|---|---|---|---|---|
| ALL | 21 | 12 | 12 | 10 |
| 12P MUTATED | 10 | 0 | 0 | 0 |
| 12P WILD-TYPE | 11 | 12 | 12 | 10 |
Figure S37. Get High-res Image Gene #23: '12p' versus Molecular Subtype #3: 'MRNASEQ_CNMF'
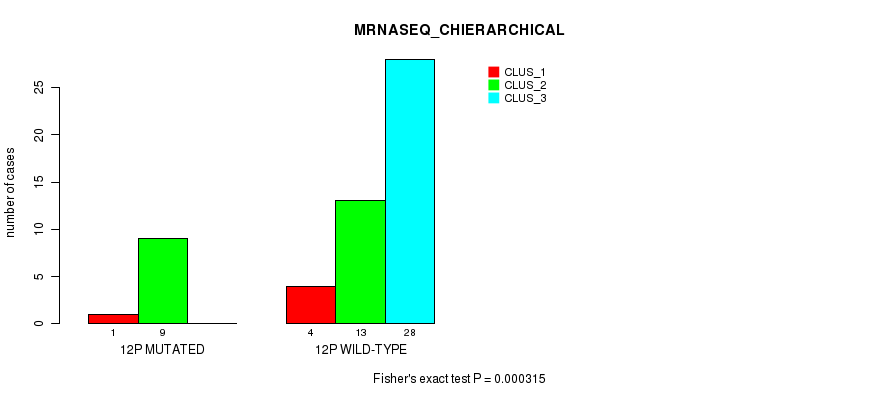
P value = 0.000315 (Fisher's exact test), Q value = 0.09
Table S38. Gene #23: '12p' versus Molecular Subtype #4: 'MRNASEQ_CHIERARCHICAL'
| nPatients | CLUS_1 | CLUS_2 | CLUS_3 |
|---|---|---|---|
| ALL | 5 | 22 | 28 |
| 12P MUTATED | 1 | 9 | 0 |
| 12P WILD-TYPE | 4 | 13 | 28 |
Figure S38. Get High-res Image Gene #23: '12p' versus Molecular Subtype #4: 'MRNASEQ_CHIERARCHICAL'
P value = 0.000263 (Fisher's exact test), Q value = 0.076
Table S39. Gene #23: '12p' versus Molecular Subtype #5: 'MIRSEQ_CNMF'
| nPatients | CLUS_1 | CLUS_2 | CLUS_3 |
|---|---|---|---|
| ALL | 29 | 11 | 18 |
| 12P MUTATED | 12 | 0 | 0 |
| 12P WILD-TYPE | 17 | 11 | 18 |
Figure S39. Get High-res Image Gene #23: '12p' versus Molecular Subtype #5: 'MIRSEQ_CNMF'
P value = 0.000232 (Fisher's exact test), Q value = 0.068
Table S40. Gene #23: '12p' versus Molecular Subtype #7: 'MIRSEQ_MATURE_CNMF'
| nPatients | CLUS_1 | CLUS_2 | CLUS_3 |
|---|---|---|---|
| ALL | 25 | 10 | 23 |
| 12P MUTATED | 11 | 1 | 0 |
| 12P WILD-TYPE | 14 | 9 | 23 |
Figure S40. Get High-res Image Gene #23: '12p' versus Molecular Subtype #7: 'MIRSEQ_MATURE_CNMF'

P value = 0.000843 (Fisher's exact test), Q value = 0.22
Table S41. Gene #23: '12p' versus Molecular Subtype #8: 'MIRSEQ_MATURE_CHIERARCHICAL'
| nPatients | CLUS_1 | CLUS_2 | CLUS_3 |
|---|---|---|---|
| ALL | 12 | 26 | 20 |
| 12P MUTATED | 0 | 11 | 1 |
| 12P WILD-TYPE | 12 | 15 | 19 |
Figure S41. Get High-res Image Gene #23: '12p' versus Molecular Subtype #8: 'MIRSEQ_MATURE_CHIERARCHICAL'

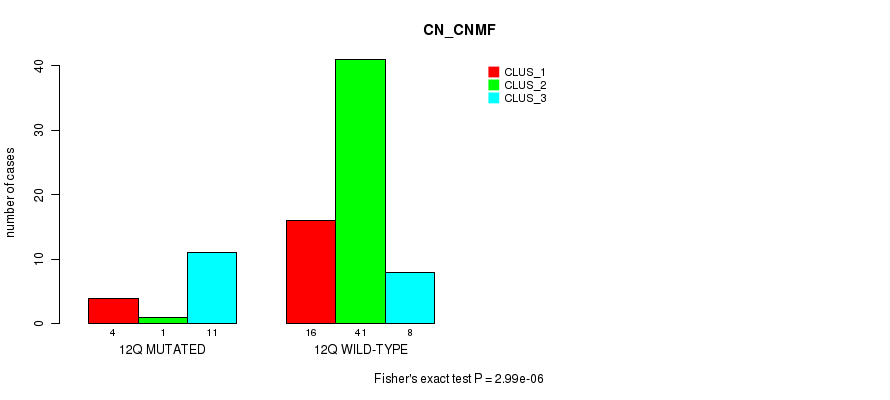
P value = 2.99e-06 (Fisher's exact test), Q value = 0.00094
Table S42. Gene #24: '12q' versus Molecular Subtype #1: 'CN_CNMF'
| nPatients | CLUS_1 | CLUS_2 | CLUS_3 |
|---|---|---|---|
| ALL | 20 | 42 | 19 |
| 12Q MUTATED | 4 | 1 | 11 |
| 12Q WILD-TYPE | 16 | 41 | 8 |
Figure S42. Get High-res Image Gene #24: '12q' versus Molecular Subtype #1: 'CN_CNMF'
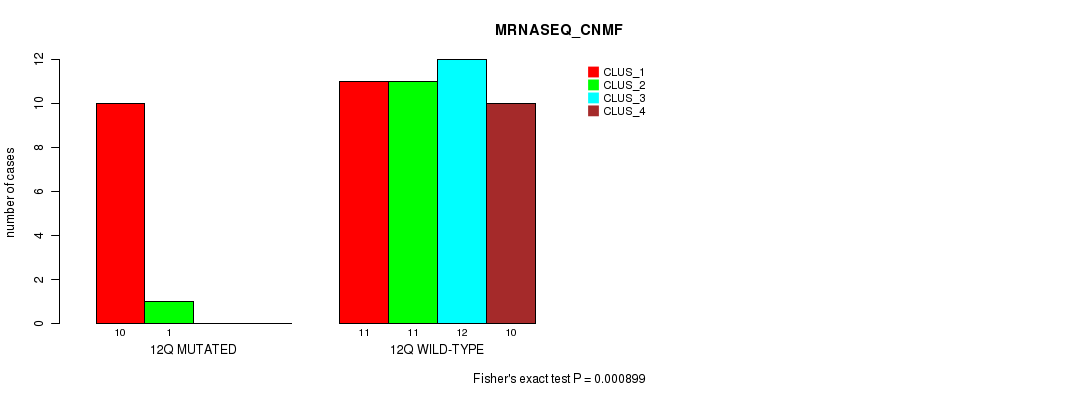
P value = 0.000899 (Fisher's exact test), Q value = 0.24
Table S43. Gene #24: '12q' versus Molecular Subtype #3: 'MRNASEQ_CNMF'
| nPatients | CLUS_1 | CLUS_2 | CLUS_3 | CLUS_4 |
|---|---|---|---|---|
| ALL | 21 | 12 | 12 | 10 |
| 12Q MUTATED | 10 | 1 | 0 | 0 |
| 12Q WILD-TYPE | 11 | 11 | 12 | 10 |
Figure S43. Get High-res Image Gene #24: '12q' versus Molecular Subtype #3: 'MRNASEQ_CNMF'
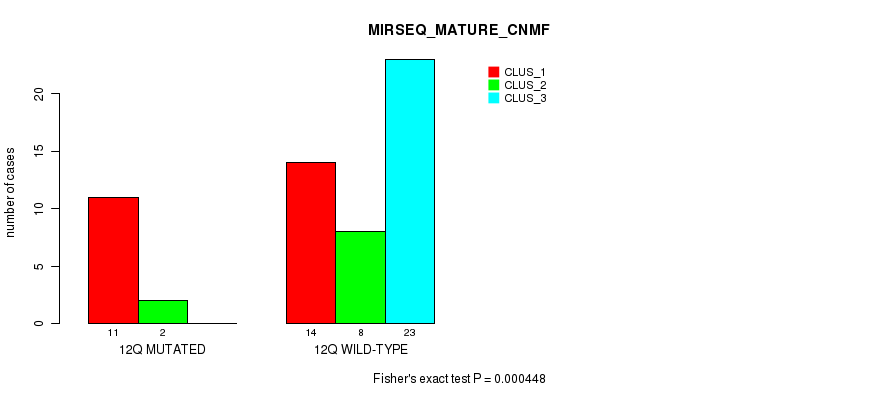
P value = 0.000448 (Fisher's exact test), Q value = 0.13
Table S44. Gene #24: '12q' versus Molecular Subtype #7: 'MIRSEQ_MATURE_CNMF'
| nPatients | CLUS_1 | CLUS_2 | CLUS_3 |
|---|---|---|---|
| ALL | 25 | 10 | 23 |
| 12Q MUTATED | 11 | 2 | 0 |
| 12Q WILD-TYPE | 14 | 8 | 23 |
Figure S44. Get High-res Image Gene #24: '12q' versus Molecular Subtype #7: 'MIRSEQ_MATURE_CNMF'
P value = 0.000738 (Fisher's exact test), Q value = 0.2
Table S45. Gene #28: '16p' versus Molecular Subtype #1: 'CN_CNMF'
| nPatients | CLUS_1 | CLUS_2 | CLUS_3 |
|---|---|---|---|
| ALL | 20 | 42 | 19 |
| 16P MUTATED | 2 | 1 | 7 |
| 16P WILD-TYPE | 18 | 41 | 12 |
Figure S45. Get High-res Image Gene #28: '16p' versus Molecular Subtype #1: 'CN_CNMF'
P value = 7.34e-10 (Fisher's exact test), Q value = 2.3e-07
Table S46. Gene #30: '17p' versus Molecular Subtype #1: 'CN_CNMF'
| nPatients | CLUS_1 | CLUS_2 | CLUS_3 |
|---|---|---|---|
| ALL | 20 | 42 | 19 |
| 17P MUTATED | 14 | 4 | 16 |
| 17P WILD-TYPE | 6 | 38 | 3 |
Figure S46. Get High-res Image Gene #30: '17p' versus Molecular Subtype #1: 'CN_CNMF'
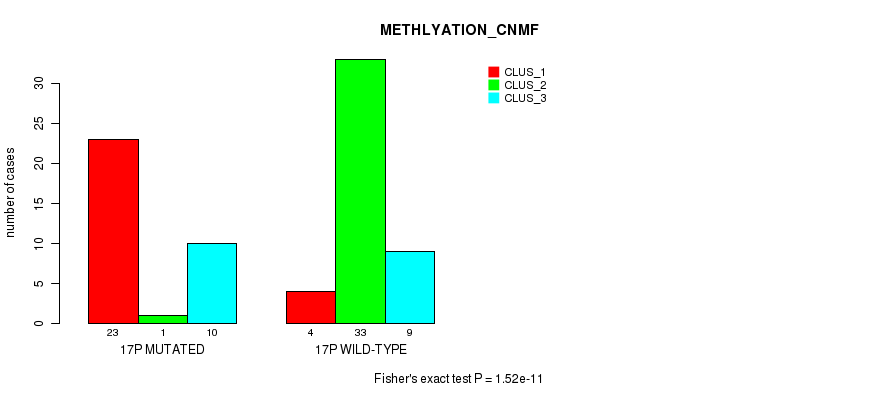
P value = 1.52e-11 (Fisher's exact test), Q value = 4.9e-09
Table S47. Gene #30: '17p' versus Molecular Subtype #2: 'METHLYATION_CNMF'
| nPatients | CLUS_1 | CLUS_2 | CLUS_3 |
|---|---|---|---|
| ALL | 27 | 34 | 19 |
| 17P MUTATED | 23 | 1 | 10 |
| 17P WILD-TYPE | 4 | 33 | 9 |
Figure S47. Get High-res Image Gene #30: '17p' versus Molecular Subtype #2: 'METHLYATION_CNMF'
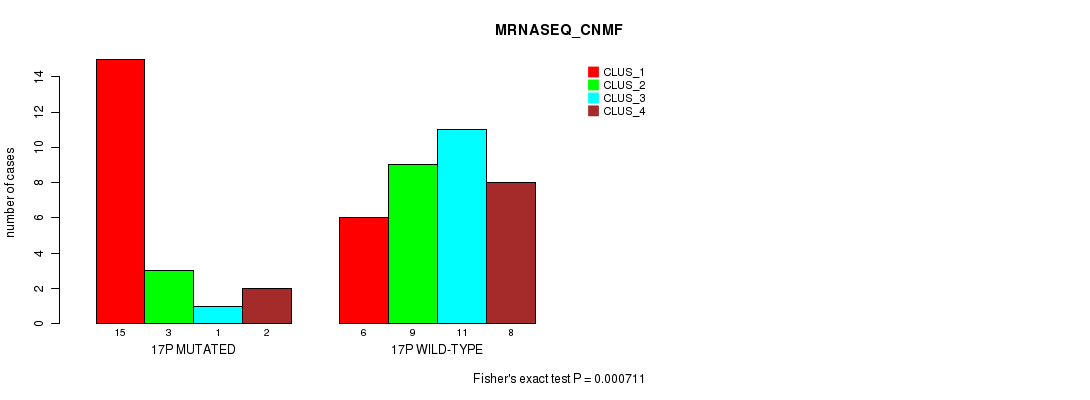
P value = 0.000711 (Fisher's exact test), Q value = 0.19
Table S48. Gene #30: '17p' versus Molecular Subtype #3: 'MRNASEQ_CNMF'
| nPatients | CLUS_1 | CLUS_2 | CLUS_3 | CLUS_4 |
|---|---|---|---|---|
| ALL | 21 | 12 | 12 | 10 |
| 17P MUTATED | 15 | 3 | 1 | 2 |
| 17P WILD-TYPE | 6 | 9 | 11 | 8 |
Figure S48. Get High-res Image Gene #30: '17p' versus Molecular Subtype #3: 'MRNASEQ_CNMF'
P value = 4.46e-05 (Fisher's exact test), Q value = 0.014
Table S49. Gene #30: '17p' versus Molecular Subtype #4: 'MRNASEQ_CHIERARCHICAL'
| nPatients | CLUS_1 | CLUS_2 | CLUS_3 |
|---|---|---|---|
| ALL | 5 | 22 | 28 |
| 17P MUTATED | 1 | 16 | 4 |
| 17P WILD-TYPE | 4 | 6 | 24 |
Figure S49. Get High-res Image Gene #30: '17p' versus Molecular Subtype #4: 'MRNASEQ_CHIERARCHICAL'
P value = 0.000209 (Fisher's exact test), Q value = 0.061
Table S50. Gene #30: '17p' versus Molecular Subtype #5: 'MIRSEQ_CNMF'
| nPatients | CLUS_1 | CLUS_2 | CLUS_3 |
|---|---|---|---|
| ALL | 29 | 11 | 18 |
| 17P MUTATED | 19 | 2 | 2 |
| 17P WILD-TYPE | 10 | 9 | 16 |
Figure S50. Get High-res Image Gene #30: '17p' versus Molecular Subtype #5: 'MIRSEQ_CNMF'
P value = 0.000326 (Fisher's exact test), Q value = 0.092
Table S51. Gene #30: '17p' versus Molecular Subtype #6: 'MIRSEQ_CHIERARCHICAL'
| nPatients | CLUS_1 | CLUS_2 | CLUS_3 |
|---|---|---|---|
| ALL | 11 | 20 | 27 |
| 17P MUTATED | 1 | 4 | 18 |
| 17P WILD-TYPE | 10 | 16 | 9 |
Figure S51. Get High-res Image Gene #30: '17p' versus Molecular Subtype #6: 'MIRSEQ_CHIERARCHICAL'
P value = 1.56e-05 (Fisher's exact test), Q value = 0.0048
Table S52. Gene #30: '17p' versus Molecular Subtype #7: 'MIRSEQ_MATURE_CNMF'
| nPatients | CLUS_1 | CLUS_2 | CLUS_3 |
|---|---|---|---|
| ALL | 25 | 10 | 23 |
| 17P MUTATED | 18 | 3 | 2 |
| 17P WILD-TYPE | 7 | 7 | 21 |
Figure S52. Get High-res Image Gene #30: '17p' versus Molecular Subtype #7: 'MIRSEQ_MATURE_CNMF'
P value = 0.000123 (Fisher's exact test), Q value = 0.036
Table S53. Gene #30: '17p' versus Molecular Subtype #8: 'MIRSEQ_MATURE_CHIERARCHICAL'
| nPatients | CLUS_1 | CLUS_2 | CLUS_3 |
|---|---|---|---|
| ALL | 12 | 26 | 20 |
| 17P MUTATED | 1 | 18 | 4 |
| 17P WILD-TYPE | 11 | 8 | 16 |
Figure S53. Get High-res Image Gene #30: '17p' versus Molecular Subtype #8: 'MIRSEQ_MATURE_CHIERARCHICAL'
P value = 0.000309 (Fisher's exact test), Q value = 0.089
Table S54. Gene #31: '17q' versus Molecular Subtype #1: 'CN_CNMF'
| nPatients | CLUS_1 | CLUS_2 | CLUS_3 |
|---|---|---|---|
| ALL | 20 | 42 | 19 |
| 17Q MUTATED | 4 | 2 | 9 |
| 17Q WILD-TYPE | 16 | 40 | 10 |
Figure S54. Get High-res Image Gene #31: '17q' versus Molecular Subtype #1: 'CN_CNMF'
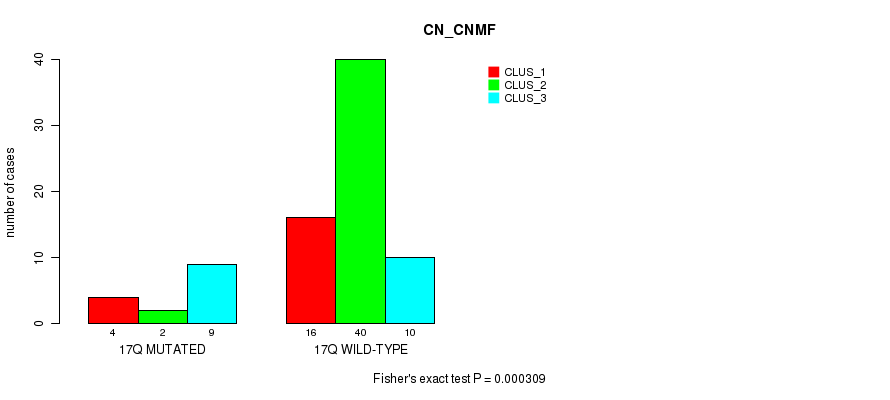
P value = 9.76e-05 (Fisher's exact test), Q value = 0.029
Table S55. Gene #33: '18q' versus Molecular Subtype #1: 'CN_CNMF'
| nPatients | CLUS_1 | CLUS_2 | CLUS_3 |
|---|---|---|---|
| ALL | 20 | 42 | 19 |
| 18Q MUTATED | 19 | 17 | 11 |
| 18Q WILD-TYPE | 1 | 25 | 8 |
Figure S55. Get High-res Image Gene #33: '18q' versus Molecular Subtype #1: 'CN_CNMF'
P value = 0.00048 (Fisher's exact test), Q value = 0.13
Table S56. Gene #33: '18q' versus Molecular Subtype #2: 'METHLYATION_CNMF'
| nPatients | CLUS_1 | CLUS_2 | CLUS_3 |
|---|---|---|---|
| ALL | 27 | 34 | 19 |
| 18Q MUTATED | 21 | 11 | 14 |
| 18Q WILD-TYPE | 6 | 23 | 5 |
Figure S56. Get High-res Image Gene #33: '18q' versus Molecular Subtype #2: 'METHLYATION_CNMF'
P value = 0.00073 (Fisher's exact test), Q value = 0.2
Table S57. Gene #36: '20p' versus Molecular Subtype #1: 'CN_CNMF'
| nPatients | CLUS_1 | CLUS_2 | CLUS_3 |
|---|---|---|---|
| ALL | 20 | 42 | 19 |
| 20P MUTATED | 4 | 5 | 11 |
| 20P WILD-TYPE | 16 | 37 | 8 |
Figure S57. Get High-res Image Gene #36: '20p' versus Molecular Subtype #1: 'CN_CNMF'
P value = 6.32e-07 (Fisher's exact test), Q value = 2e-04
Table S58. Gene #38: '21q' versus Molecular Subtype #1: 'CN_CNMF'
| nPatients | CLUS_1 | CLUS_2 | CLUS_3 |
|---|---|---|---|
| ALL | 20 | 42 | 19 |
| 21Q MUTATED | 12 | 4 | 13 |
| 21Q WILD-TYPE | 8 | 38 | 6 |
Figure S58. Get High-res Image Gene #38: '21q' versus Molecular Subtype #1: 'CN_CNMF'
P value = 0.000177 (Fisher's exact test), Q value = 0.052
Table S59. Gene #39: '22q' versus Molecular Subtype #1: 'CN_CNMF'
| nPatients | CLUS_1 | CLUS_2 | CLUS_3 |
|---|---|---|---|
| ALL | 20 | 42 | 19 |
| 22Q MUTATED | 7 | 3 | 10 |
| 22Q WILD-TYPE | 13 | 39 | 9 |
Figure S59. Get High-res Image Gene #39: '22q' versus Molecular Subtype #1: 'CN_CNMF'
-
Copy number data file = transformed.cor.cli.txt
-
Molecular subtype file = PAAD-TP.transferedmergedcluster.txt
-
Number of patients = 81
-
Number of significantly focal cnvs = 40
-
Number of molecular subtypes = 8
-
Exclude genes that fewer than K tumors have alterations, K = 3
For binary or multi-class clinical features (nominal or ordinal), two-tailed Fisher's exact tests (Fisher 1922) were used to estimate the P values using the 'fisher.test' function in R
For multiple hypothesis correction, Q value is the False Discovery Rate (FDR) analogue of the P value (Benjamini and Hochberg 1995), defined as the minimum FDR at which the test may be called significant. We used the 'Benjamini and Hochberg' method of 'p.adjust' function in R to convert P values into Q values.
In addition to the links below, the full results of the analysis summarized in this report can also be downloaded programmatically using firehose_get, or interactively from either the Broad GDAC website or TCGA Data Coordination Center Portal.