This pipeline computes the correlation between significant copy number variation (cnv focal) genes and molecular subtypes.
Testing the association between copy number variation 40 focal events and 8 molecular subtypes across 127 patients, 25 significant findings detected with P value < 0.05 and Q value < 0.25.
-
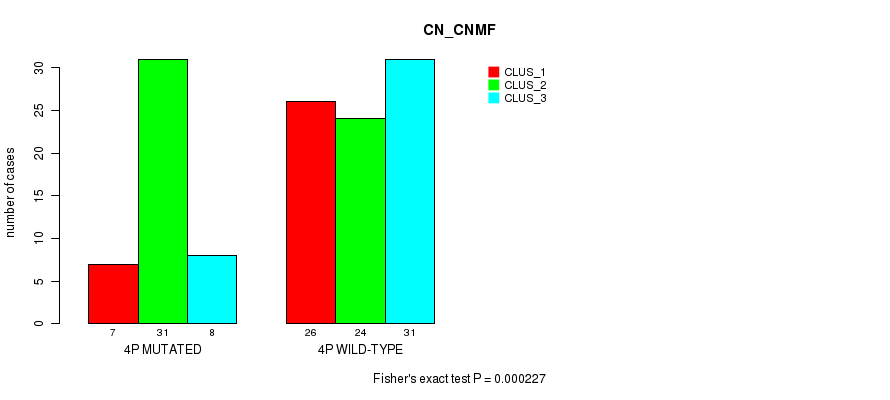
4p cnv correlated to 'CN_CNMF'.
-
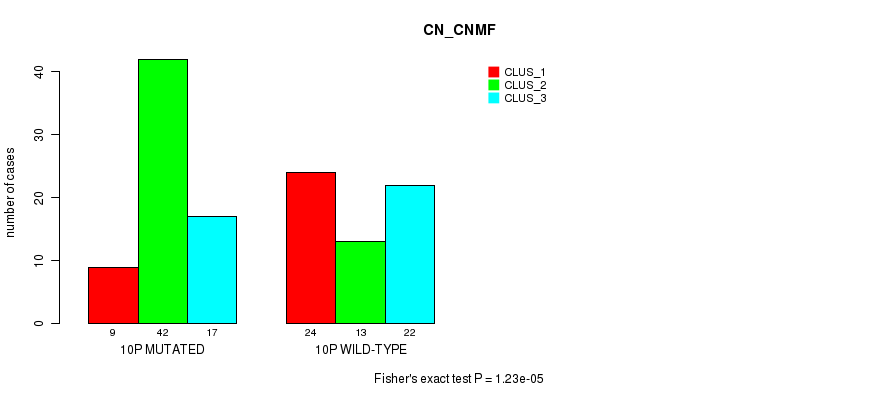
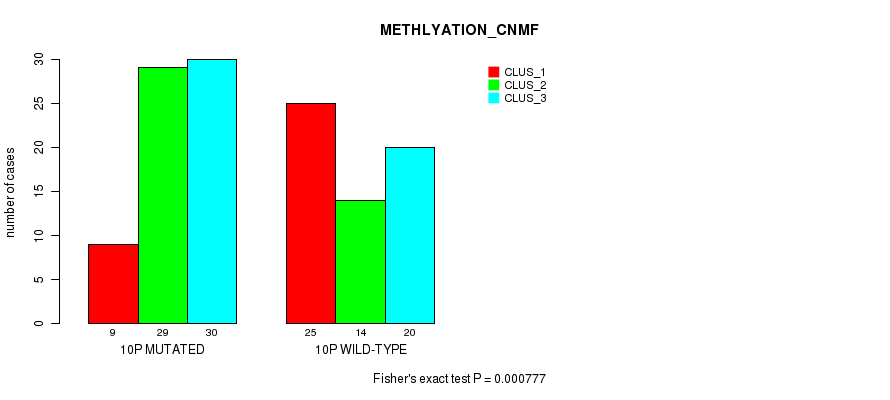
10p cnv correlated to 'CN_CNMF' and 'METHLYATION_CNMF'.
-
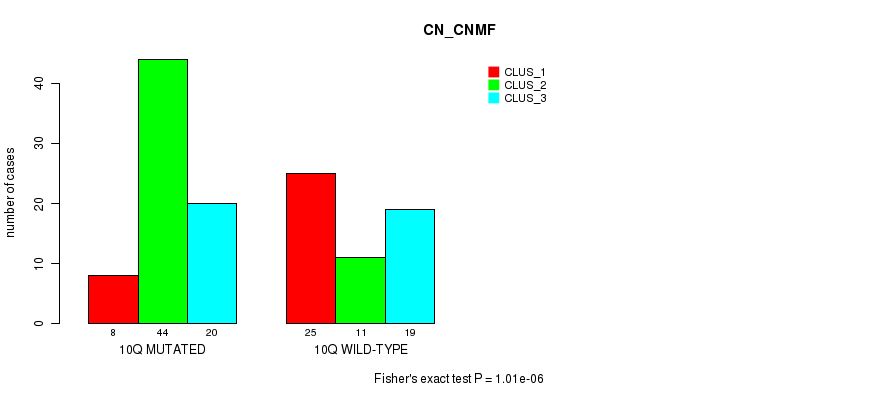
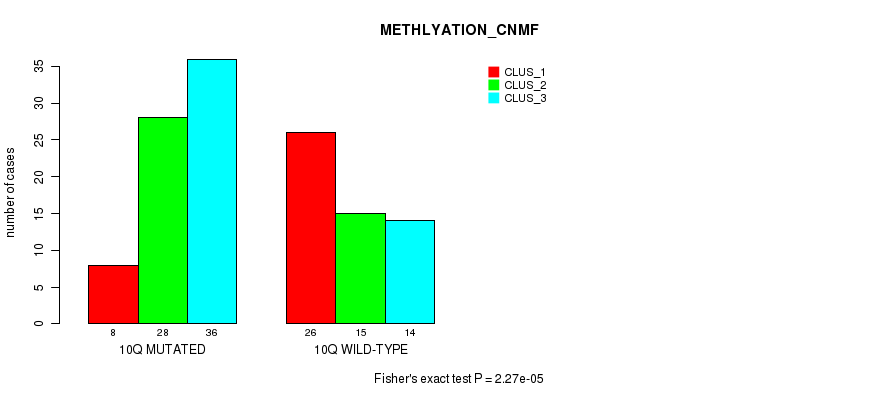
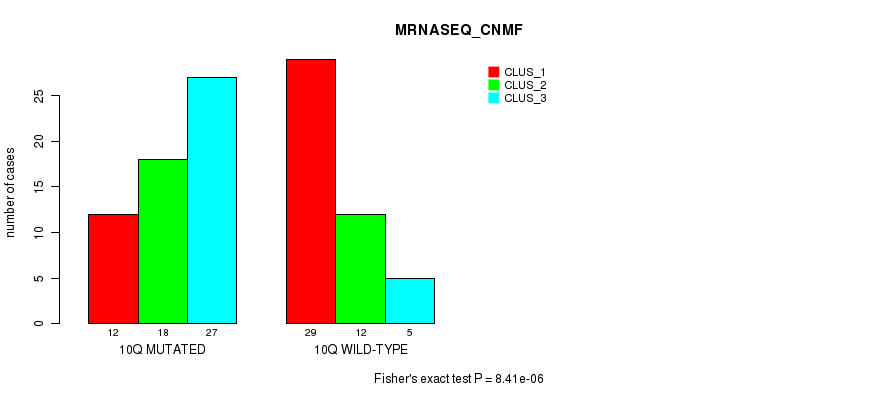
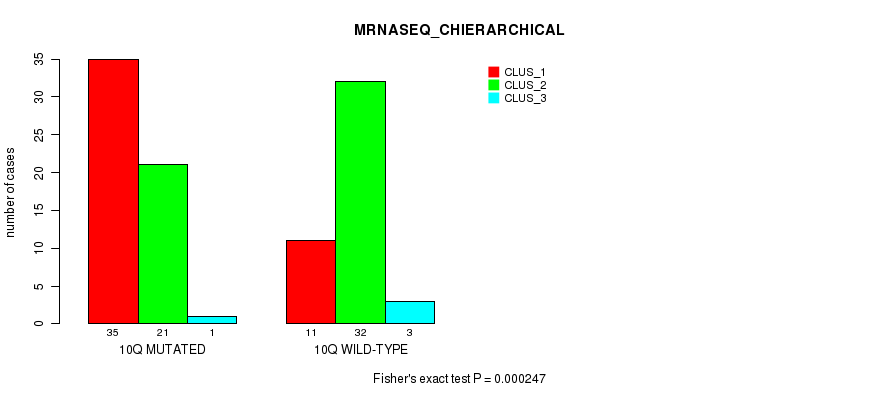
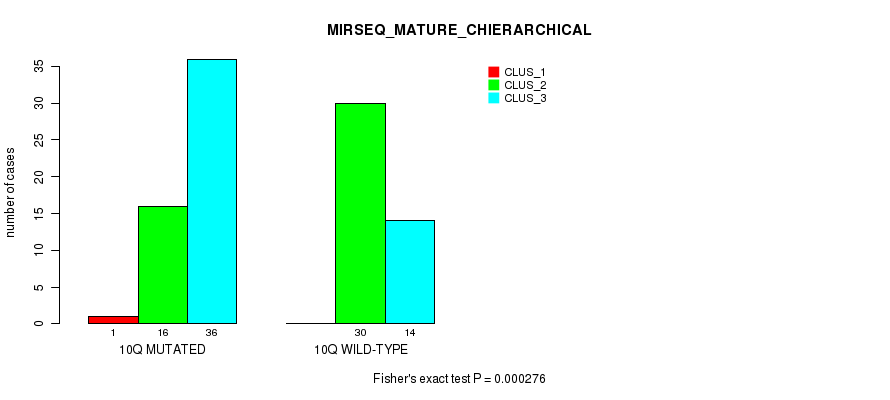
10q cnv correlated to 'CN_CNMF', 'METHLYATION_CNMF', 'MRNASEQ_CNMF', 'MRNASEQ_CHIERARCHICAL', and 'MIRSEQ_MATURE_CHIERARCHICAL'.
-
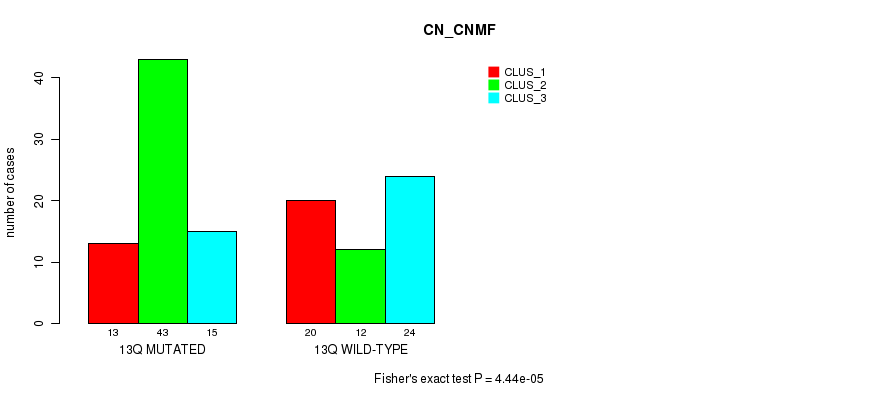
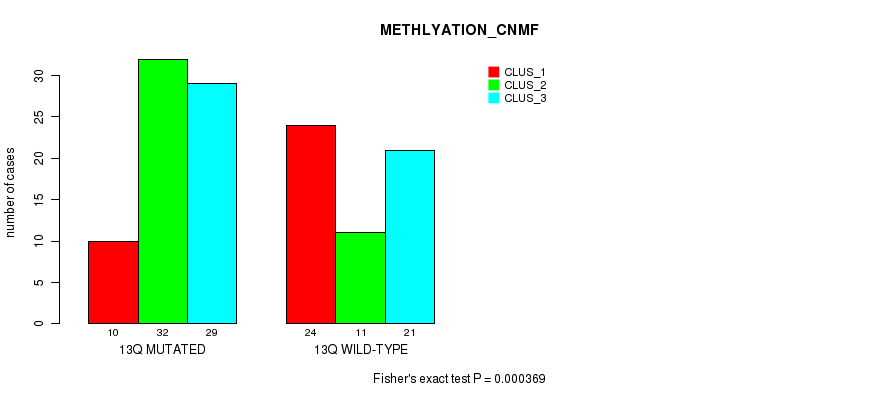
13q cnv correlated to 'CN_CNMF' and 'METHLYATION_CNMF'.
-
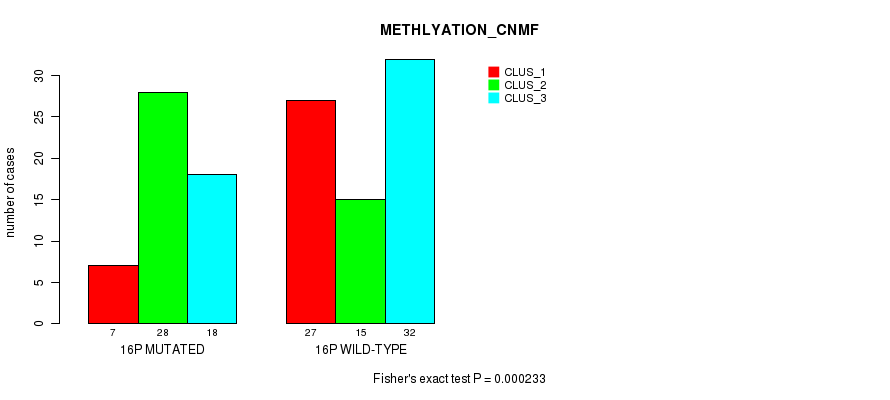
16p cnv correlated to 'CN_CNMF' and 'METHLYATION_CNMF'.
-
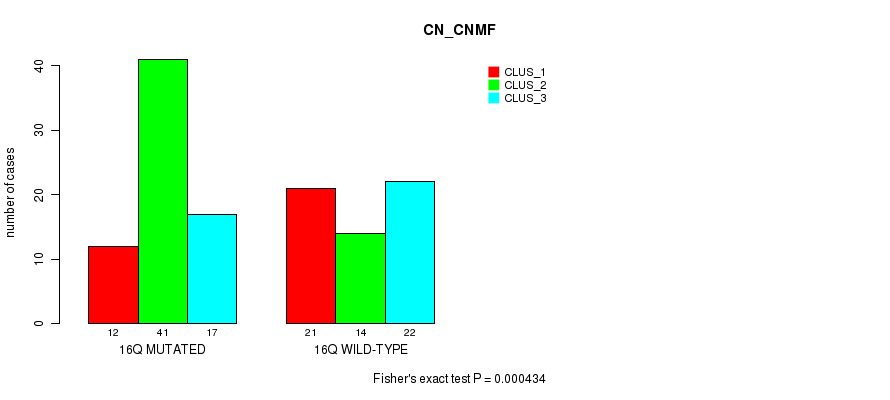
16q cnv correlated to 'CN_CNMF' and 'METHLYATION_CNMF'.
-
17p cnv correlated to 'CN_CNMF'.
-
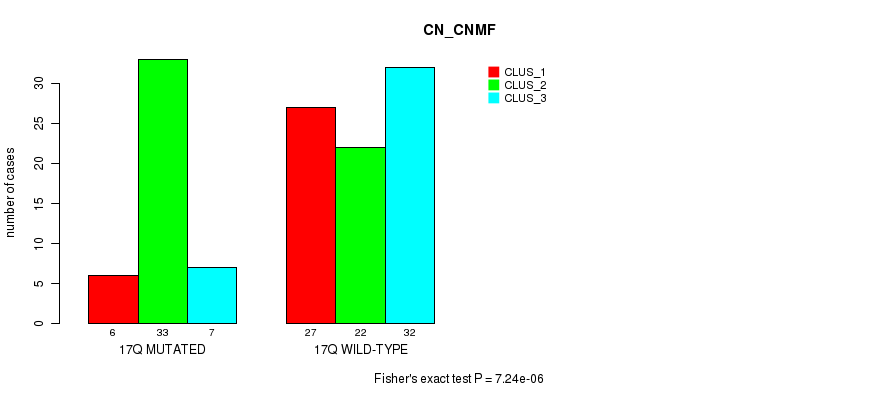
17q cnv correlated to 'CN_CNMF'.
-
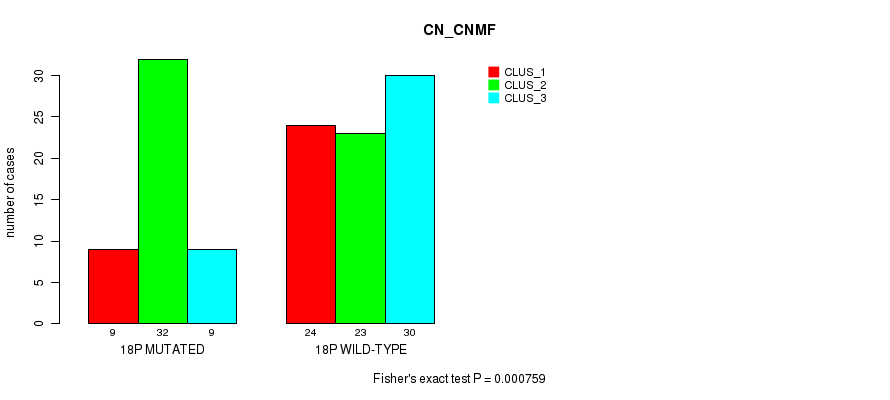
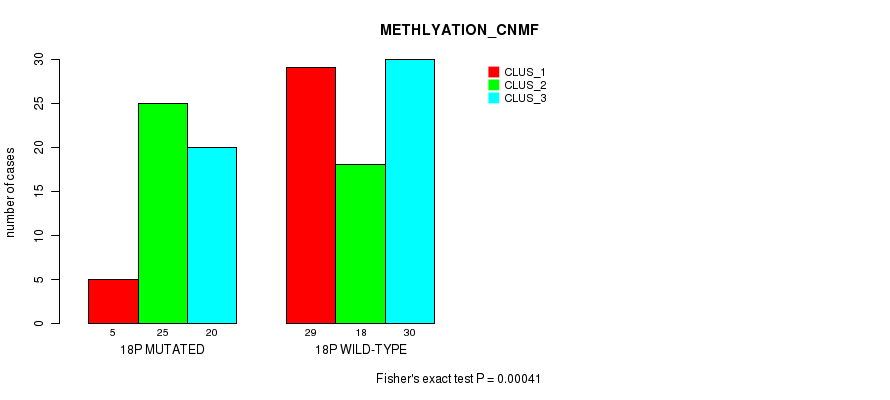
18p cnv correlated to 'CN_CNMF' and 'METHLYATION_CNMF'.
-
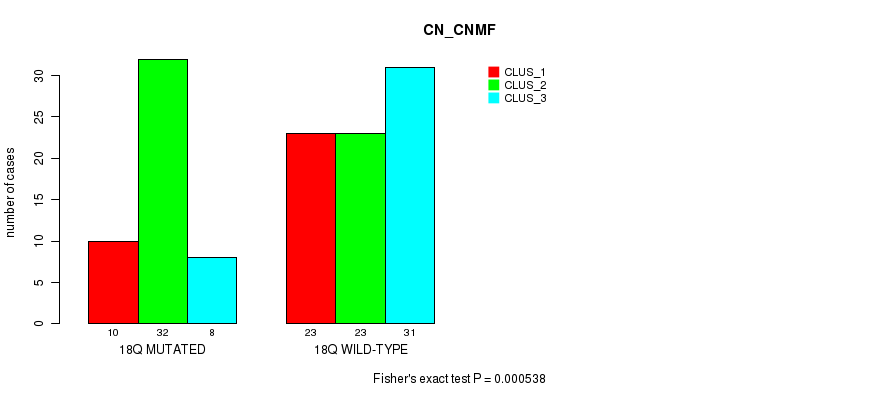
18q cnv correlated to 'CN_CNMF'.
-
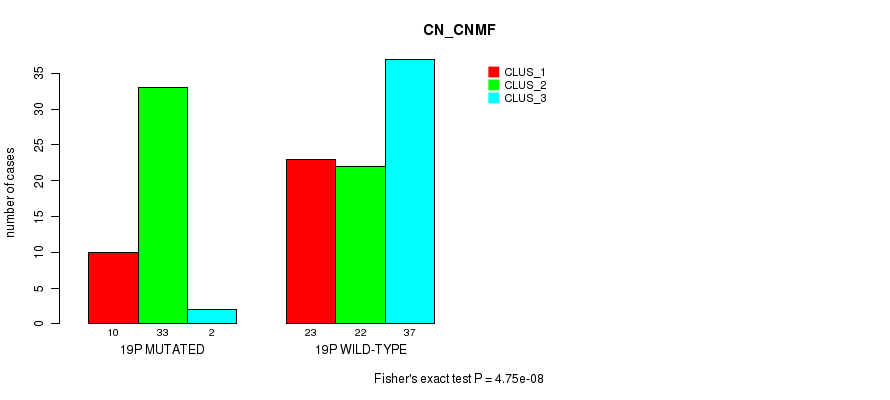
19p cnv correlated to 'CN_CNMF'.
-
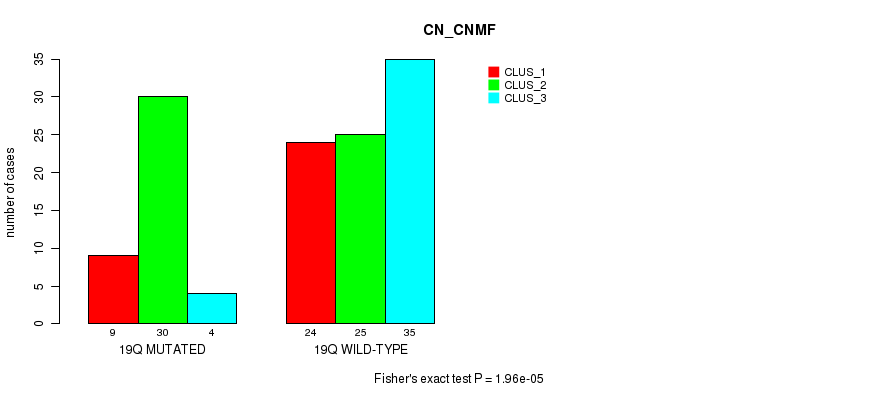
19q cnv correlated to 'CN_CNMF'.
-
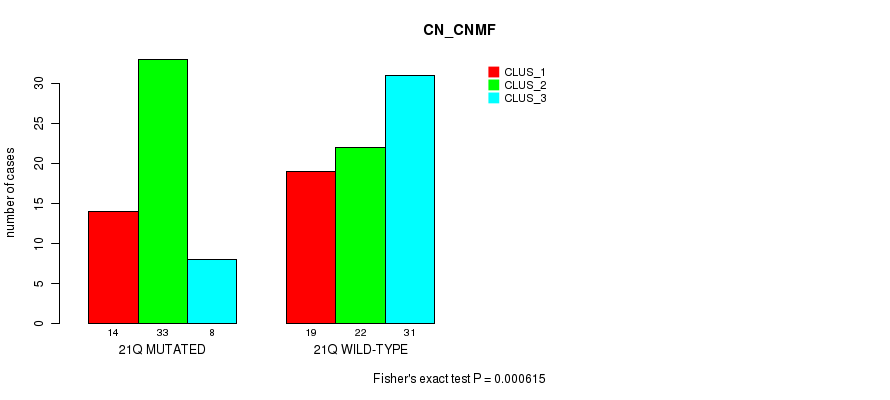
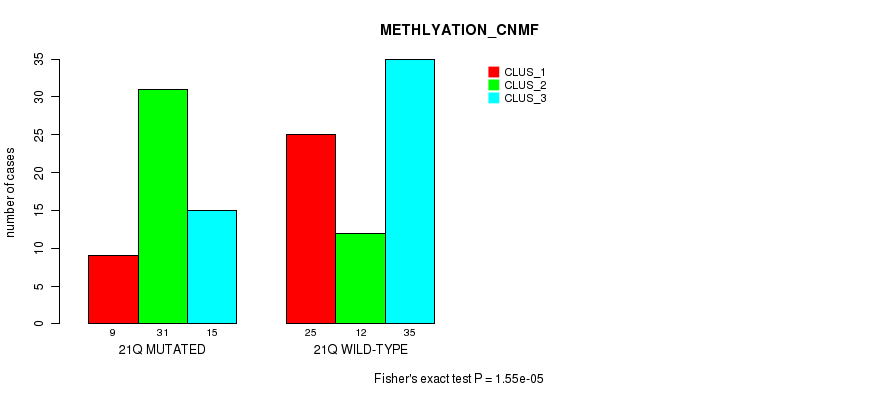
21q cnv correlated to 'CN_CNMF' and 'METHLYATION_CNMF'.
-
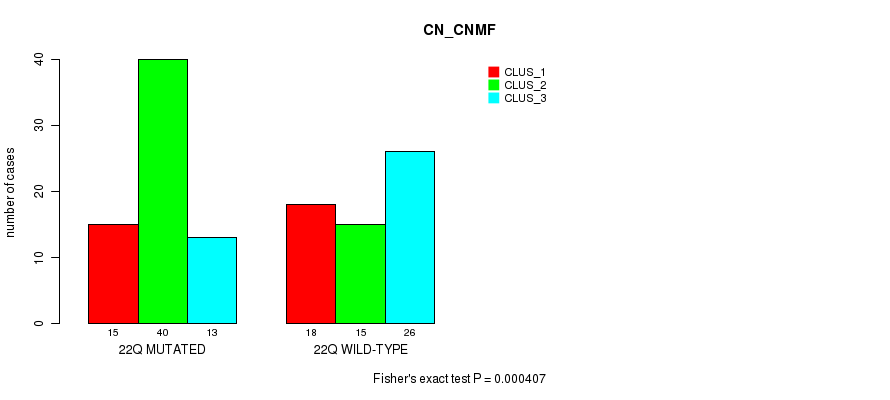
22q cnv correlated to 'CN_CNMF'.
-
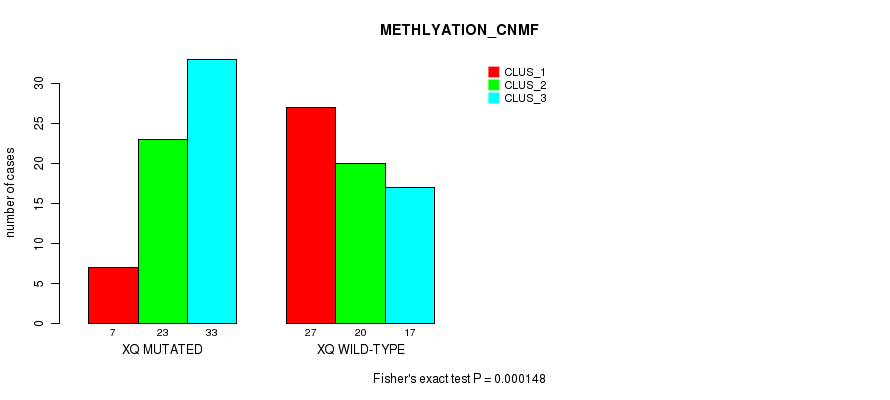
xq cnv correlated to 'METHLYATION_CNMF'.
Table 1. Get Full Table Overview of the association between significant copy number variation of 40 focal events and 8 molecular subtypes. Shown in the table are P values (Q values). Thresholded by P value < 0.05 and Q value < 0.25, 25 significant findings detected.
|
Clinical Features |
CN CNMF |
METHLYATION CNMF |
MRNASEQ CNMF |
MRNASEQ CHIERARCHICAL |
MIRSEQ CNMF |
MIRSEQ CHIERARCHICAL |
MIRSEQ MATURE CNMF |
MIRSEQ MATURE CHIERARCHICAL |
||
| nCNV (%) | nWild-Type | Fisher's exact test | Fisher's exact test | Fisher's exact test | Fisher's exact test | Fisher's exact test | Fisher's exact test | Fisher's exact test | Fisher's exact test | |
| 10q | 72 (57%) | 55 |
1.01e-06 (0.000323) |
2.27e-05 (0.00709) |
8.41e-06 (0.00266) |
0.000247 (0.0755) |
0.00557 (1.00) |
0.00124 (0.357) |
0.00565 (1.00) |
0.000276 (0.0842) |
| 10p | 68 (54%) | 59 |
1.23e-05 (0.00387) |
0.000777 (0.23) |
0.00223 (0.624) |
0.0729 (1.00) |
0.0349 (1.00) |
0.0246 (1.00) |
0.199 (1.00) |
0.0147 (1.00) |
| 13q | 71 (56%) | 56 |
4.44e-05 (0.0138) |
0.000369 (0.112) |
0.22 (1.00) |
0.0576 (1.00) |
0.508 (1.00) |
0.561 (1.00) |
0.622 (1.00) |
0.514 (1.00) |
| 16p | 53 (42%) | 74 |
0.000201 (0.0621) |
0.000233 (0.0715) |
0.515 (1.00) |
0.171 (1.00) |
0.139 (1.00) |
0.806 (1.00) |
0.838 (1.00) |
0.467 (1.00) |
| 16q | 70 (55%) | 57 |
0.000434 (0.13) |
1.5e-06 (0.000477) |
0.00136 (0.391) |
0.00395 (1.00) |
0.00105 (0.305) |
0.00917 (1.00) |
0.0254 (1.00) |
0.00273 (0.753) |
| 18p | 50 (39%) | 77 |
0.000759 (0.226) |
0.00041 (0.124) |
0.274 (1.00) |
0.264 (1.00) |
0.504 (1.00) |
1 (1.00) |
0.937 (1.00) |
0.578 (1.00) |
| 21q | 55 (43%) | 72 |
0.000615 (0.183) |
1.55e-05 (0.00488) |
0.0765 (1.00) |
0.0243 (1.00) |
0.245 (1.00) |
0.493 (1.00) |
0.0863 (1.00) |
0.364 (1.00) |
| 4p | 46 (36%) | 81 |
0.000227 (0.0699) |
0.00179 (0.512) |
0.073 (1.00) |
0.269 (1.00) |
0.385 (1.00) |
1 (1.00) |
0.642 (1.00) |
1 (1.00) |
| 17p | 51 (40%) | 76 |
0.00042 (0.126) |
0.0025 (0.692) |
0.223 (1.00) |
0.357 (1.00) |
0.15 (1.00) |
1 (1.00) |
0.181 (1.00) |
0.39 (1.00) |
| 17q | 46 (36%) | 81 |
7.24e-06 (0.0023) |
0.0197 (1.00) |
0.14 (1.00) |
0.278 (1.00) |
0.0216 (1.00) |
0.327 (1.00) |
0.436 (1.00) |
0.0582 (1.00) |
| 18q | 50 (39%) | 77 |
0.000538 (0.161) |
0.00122 (0.354) |
0.522 (1.00) |
0.194 (1.00) |
0.426 (1.00) |
0.796 (1.00) |
0.793 (1.00) |
0.832 (1.00) |
| 19p | 45 (35%) | 82 |
4.75e-08 (1.52e-05) |
0.00726 (1.00) |
0.312 (1.00) |
0.272 (1.00) |
0.479 (1.00) |
0.573 (1.00) |
0.84 (1.00) |
0.725 (1.00) |
| 19q | 43 (34%) | 84 |
1.96e-05 (0.00613) |
0.015 (1.00) |
0.7 (1.00) |
0.367 (1.00) |
0.525 (1.00) |
0.509 (1.00) |
0.79 (1.00) |
0.811 (1.00) |
| 22q | 68 (54%) | 59 |
0.000407 (0.123) |
0.00221 (0.621) |
0.24 (1.00) |
0.101 (1.00) |
0.081 (1.00) |
0.507 (1.00) |
0.637 (1.00) |
0.364 (1.00) |
| xq | 63 (50%) | 64 |
0.00238 (0.661) |
0.000148 (0.046) |
0.103 (1.00) |
0.000933 (0.274) |
0.489 (1.00) |
0.397 (1.00) |
0.187 (1.00) |
0.0875 (1.00) |
| 1p | 42 (33%) | 85 |
0.00416 (1.00) |
0.00326 (0.887) |
0.0104 (1.00) |
0.356 (1.00) |
0.295 (1.00) |
1 (1.00) |
0.434 (1.00) |
0.355 (1.00) |
| 1q | 43 (34%) | 84 |
0.00504 (1.00) |
0.0182 (1.00) |
0.0395 (1.00) |
0.085 (1.00) |
0.332 (1.00) |
0.401 (1.00) |
0.357 (1.00) |
0.166 (1.00) |
| 2p | 49 (39%) | 78 |
0.00281 (0.772) |
0.000964 (0.282) |
0.00151 (0.433) |
0.0186 (1.00) |
0.0142 (1.00) |
0.0847 (1.00) |
0.231 (1.00) |
0.0149 (1.00) |
| 2q | 38 (30%) | 89 |
0.0087 (1.00) |
0.114 (1.00) |
0.772 (1.00) |
0.321 (1.00) |
0.309 (1.00) |
1 (1.00) |
0.796 (1.00) |
0.372 (1.00) |
| 3p | 37 (29%) | 90 |
0.0205 (1.00) |
0.168 (1.00) |
0.338 (1.00) |
0.142 (1.00) |
0.691 (1.00) |
0.194 (1.00) |
0.135 (1.00) |
0.104 (1.00) |
| 3q | 41 (32%) | 86 |
0.018 (1.00) |
0.0177 (1.00) |
0.258 (1.00) |
0.0246 (1.00) |
0.446 (1.00) |
0.0546 (1.00) |
0.0234 (1.00) |
0.0526 (1.00) |
| 4q | 42 (33%) | 85 |
0.00416 (1.00) |
0.00664 (1.00) |
0.223 (1.00) |
0.441 (1.00) |
0.302 (1.00) |
1 (1.00) |
0.91 (1.00) |
1 (1.00) |
| 5p | 54 (43%) | 73 |
0.0019 (0.54) |
0.0415 (1.00) |
0.549 (1.00) |
0.572 (1.00) |
0.44 (1.00) |
0.614 (1.00) |
0.0604 (1.00) |
0.6 (1.00) |
| 5q | 49 (39%) | 78 |
0.017 (1.00) |
0.0499 (1.00) |
1 (1.00) |
0.574 (1.00) |
0.392 (1.00) |
0.642 (1.00) |
0.106 (1.00) |
0.832 (1.00) |
| 6p | 51 (40%) | 76 |
0.354 (1.00) |
0.145 (1.00) |
1 (1.00) |
1 (1.00) |
0.668 (1.00) |
0.644 (1.00) |
0.716 (1.00) |
0.841 (1.00) |
| 6q | 41 (32%) | 86 |
0.0487 (1.00) |
0.0443 (1.00) |
0.951 (1.00) |
0.27 (1.00) |
0.791 (1.00) |
0.671 (1.00) |
0.414 (1.00) |
0.728 (1.00) |
| 7p | 54 (43%) | 73 |
0.0019 (0.54) |
0.0543 (1.00) |
0.131 (1.00) |
0.25 (1.00) |
0.917 (1.00) |
1 (1.00) |
0.806 (1.00) |
0.531 (1.00) |
| 7q | 48 (38%) | 79 |
0.00525 (1.00) |
0.701 (1.00) |
0.534 (1.00) |
0.268 (1.00) |
0.826 (1.00) |
0.865 (1.00) |
0.716 (1.00) |
0.58 (1.00) |
| 8p | 53 (42%) | 74 |
0.346 (1.00) |
0.251 (1.00) |
0.353 (1.00) |
0.544 (1.00) |
0.243 (1.00) |
0.259 (1.00) |
0.502 (1.00) |
0.832 (1.00) |
| 8q | 49 (39%) | 78 |
0.017 (1.00) |
0.64 (1.00) |
0.366 (1.00) |
0.848 (1.00) |
0.411 (1.00) |
0.88 (1.00) |
0.465 (1.00) |
0.488 (1.00) |
| 9p | 63 (50%) | 64 |
0.00315 (0.859) |
0.00121 (0.352) |
0.602 (1.00) |
0.00218 (0.614) |
0.000849 (0.25) |
0.142 (1.00) |
0.00687 (1.00) |
0.151 (1.00) |
| 9q | 56 (44%) | 71 |
0.00689 (1.00) |
0.00287 (0.786) |
0.758 (1.00) |
0.00457 (1.00) |
0.00556 (1.00) |
0.119 (1.00) |
0.00224 (0.626) |
0.14 (1.00) |
| 11p | 53 (42%) | 74 |
0.00466 (1.00) |
0.00663 (1.00) |
0.852 (1.00) |
0.125 (1.00) |
1 (1.00) |
0.731 (1.00) |
0.678 (1.00) |
0.594 (1.00) |
| 11q | 47 (37%) | 80 |
0.00203 (0.576) |
0.018 (1.00) |
0.747 (1.00) |
0.111 (1.00) |
0.479 (1.00) |
0.327 (1.00) |
0.198 (1.00) |
0.257 (1.00) |
| 12p | 43 (34%) | 84 |
0.0201 (1.00) |
0.0882 (1.00) |
0.935 (1.00) |
0.137 (1.00) |
0.0201 (1.00) |
0.509 (1.00) |
0.179 (1.00) |
0.569 (1.00) |
| 12q | 36 (28%) | 91 |
0.00482 (1.00) |
0.0131 (1.00) |
0.682 (1.00) |
0.402 (1.00) |
0.738 (1.00) |
0.418 (1.00) |
0.595 (1.00) |
0.543 (1.00) |
| 14q | 61 (48%) | 66 |
0.0859 (1.00) |
0.0498 (1.00) |
0.0996 (1.00) |
0.159 (1.00) |
0.648 (1.00) |
1 (1.00) |
0.558 (1.00) |
1 (1.00) |
| 15q | 52 (41%) | 75 |
0.00356 (0.964) |
0.0596 (1.00) |
0.668 (1.00) |
0.754 (1.00) |
0.389 (1.00) |
0.806 (1.00) |
0.837 (1.00) |
0.467 (1.00) |
| 20p | 54 (43%) | 73 |
0.0186 (1.00) |
0.0157 (1.00) |
0.187 (1.00) |
0.168 (1.00) |
0.663 (1.00) |
0.878 (1.00) |
0.663 (1.00) |
1 (1.00) |
| 20q | 50 (39%) | 77 |
0.0234 (1.00) |
0.00857 (1.00) |
0.609 (1.00) |
0.0665 (1.00) |
0.305 (1.00) |
0.628 (1.00) |
0.108 (1.00) |
0.31 (1.00) |
P value = 0.000227 (Fisher's exact test), Q value = 0.07
Table S1. Gene #7: '4p' versus Molecular Subtype #1: 'CN_CNMF'
| nPatients | CLUS_1 | CLUS_2 | CLUS_3 |
|---|---|---|---|
| ALL | 33 | 55 | 39 |
| 4P MUTATED | 7 | 31 | 8 |
| 4P WILD-TYPE | 26 | 24 | 31 |
Figure S1. Get High-res Image Gene #7: '4p' versus Molecular Subtype #1: 'CN_CNMF'
P value = 1.23e-05 (Fisher's exact test), Q value = 0.0039
Table S2. Gene #19: '10p' versus Molecular Subtype #1: 'CN_CNMF'
| nPatients | CLUS_1 | CLUS_2 | CLUS_3 |
|---|---|---|---|
| ALL | 33 | 55 | 39 |
| 10P MUTATED | 9 | 42 | 17 |
| 10P WILD-TYPE | 24 | 13 | 22 |
Figure S2. Get High-res Image Gene #19: '10p' versus Molecular Subtype #1: 'CN_CNMF'
P value = 0.000777 (Fisher's exact test), Q value = 0.23
Table S3. Gene #19: '10p' versus Molecular Subtype #2: 'METHLYATION_CNMF'
| nPatients | CLUS_1 | CLUS_2 | CLUS_3 |
|---|---|---|---|
| ALL | 34 | 43 | 50 |
| 10P MUTATED | 9 | 29 | 30 |
| 10P WILD-TYPE | 25 | 14 | 20 |
Figure S3. Get High-res Image Gene #19: '10p' versus Molecular Subtype #2: 'METHLYATION_CNMF'
P value = 1.01e-06 (Fisher's exact test), Q value = 0.00032
Table S4. Gene #20: '10q' versus Molecular Subtype #1: 'CN_CNMF'
| nPatients | CLUS_1 | CLUS_2 | CLUS_3 |
|---|---|---|---|
| ALL | 33 | 55 | 39 |
| 10Q MUTATED | 8 | 44 | 20 |
| 10Q WILD-TYPE | 25 | 11 | 19 |
Figure S4. Get High-res Image Gene #20: '10q' versus Molecular Subtype #1: 'CN_CNMF'
P value = 2.27e-05 (Fisher's exact test), Q value = 0.0071
Table S5. Gene #20: '10q' versus Molecular Subtype #2: 'METHLYATION_CNMF'
| nPatients | CLUS_1 | CLUS_2 | CLUS_3 |
|---|---|---|---|
| ALL | 34 | 43 | 50 |
| 10Q MUTATED | 8 | 28 | 36 |
| 10Q WILD-TYPE | 26 | 15 | 14 |
Figure S5. Get High-res Image Gene #20: '10q' versus Molecular Subtype #2: 'METHLYATION_CNMF'
P value = 8.41e-06 (Fisher's exact test), Q value = 0.0027
Table S6. Gene #20: '10q' versus Molecular Subtype #3: 'MRNASEQ_CNMF'
| nPatients | CLUS_1 | CLUS_2 | CLUS_3 |
|---|---|---|---|
| ALL | 41 | 30 | 32 |
| 10Q MUTATED | 12 | 18 | 27 |
| 10Q WILD-TYPE | 29 | 12 | 5 |
Figure S6. Get High-res Image Gene #20: '10q' versus Molecular Subtype #3: 'MRNASEQ_CNMF'
P value = 0.000247 (Fisher's exact test), Q value = 0.076
Table S7. Gene #20: '10q' versus Molecular Subtype #4: 'MRNASEQ_CHIERARCHICAL'
| nPatients | CLUS_1 | CLUS_2 | CLUS_3 |
|---|---|---|---|
| ALL | 46 | 53 | 4 |
| 10Q MUTATED | 35 | 21 | 1 |
| 10Q WILD-TYPE | 11 | 32 | 3 |
Figure S7. Get High-res Image Gene #20: '10q' versus Molecular Subtype #4: 'MRNASEQ_CHIERARCHICAL'
P value = 0.000276 (Fisher's exact test), Q value = 0.084
Table S8. Gene #20: '10q' versus Molecular Subtype #8: 'MIRSEQ_MATURE_CHIERARCHICAL'
| nPatients | CLUS_1 | CLUS_2 | CLUS_3 |
|---|---|---|---|
| ALL | 1 | 46 | 50 |
| 10Q MUTATED | 1 | 16 | 36 |
| 10Q WILD-TYPE | 0 | 30 | 14 |
Figure S8. Get High-res Image Gene #20: '10q' versus Molecular Subtype #8: 'MIRSEQ_MATURE_CHIERARCHICAL'
P value = 4.44e-05 (Fisher's exact test), Q value = 0.014
Table S9. Gene #25: '13q' versus Molecular Subtype #1: 'CN_CNMF'
| nPatients | CLUS_1 | CLUS_2 | CLUS_3 |
|---|---|---|---|
| ALL | 33 | 55 | 39 |
| 13Q MUTATED | 13 | 43 | 15 |
| 13Q WILD-TYPE | 20 | 12 | 24 |
Figure S9. Get High-res Image Gene #25: '13q' versus Molecular Subtype #1: 'CN_CNMF'
P value = 0.000369 (Fisher's exact test), Q value = 0.11
Table S10. Gene #25: '13q' versus Molecular Subtype #2: 'METHLYATION_CNMF'
| nPatients | CLUS_1 | CLUS_2 | CLUS_3 |
|---|---|---|---|
| ALL | 34 | 43 | 50 |
| 13Q MUTATED | 10 | 32 | 29 |
| 13Q WILD-TYPE | 24 | 11 | 21 |
Figure S10. Get High-res Image Gene #25: '13q' versus Molecular Subtype #2: 'METHLYATION_CNMF'
P value = 0.000201 (Fisher's exact test), Q value = 0.062
Table S11. Gene #28: '16p' versus Molecular Subtype #1: 'CN_CNMF'
| nPatients | CLUS_1 | CLUS_2 | CLUS_3 |
|---|---|---|---|
| ALL | 33 | 55 | 39 |
| 16P MUTATED | 13 | 33 | 7 |
| 16P WILD-TYPE | 20 | 22 | 32 |
Figure S11. Get High-res Image Gene #28: '16p' versus Molecular Subtype #1: 'CN_CNMF'

P value = 0.000233 (Fisher's exact test), Q value = 0.071
Table S12. Gene #28: '16p' versus Molecular Subtype #2: 'METHLYATION_CNMF'
| nPatients | CLUS_1 | CLUS_2 | CLUS_3 |
|---|---|---|---|
| ALL | 34 | 43 | 50 |
| 16P MUTATED | 7 | 28 | 18 |
| 16P WILD-TYPE | 27 | 15 | 32 |
Figure S12. Get High-res Image Gene #28: '16p' versus Molecular Subtype #2: 'METHLYATION_CNMF'
P value = 0.000434 (Fisher's exact test), Q value = 0.13
Table S13. Gene #29: '16q' versus Molecular Subtype #1: 'CN_CNMF'
| nPatients | CLUS_1 | CLUS_2 | CLUS_3 |
|---|---|---|---|
| ALL | 33 | 55 | 39 |
| 16Q MUTATED | 12 | 41 | 17 |
| 16Q WILD-TYPE | 21 | 14 | 22 |
Figure S13. Get High-res Image Gene #29: '16q' versus Molecular Subtype #1: 'CN_CNMF'
P value = 1.5e-06 (Fisher's exact test), Q value = 0.00048
Table S14. Gene #29: '16q' versus Molecular Subtype #2: 'METHLYATION_CNMF'
| nPatients | CLUS_1 | CLUS_2 | CLUS_3 |
|---|---|---|---|
| ALL | 34 | 43 | 50 |
| 16Q MUTATED | 6 | 30 | 34 |
| 16Q WILD-TYPE | 28 | 13 | 16 |
Figure S14. Get High-res Image Gene #29: '16q' versus Molecular Subtype #2: 'METHLYATION_CNMF'

P value = 0.00042 (Fisher's exact test), Q value = 0.13
Table S15. Gene #30: '17p' versus Molecular Subtype #1: 'CN_CNMF'
| nPatients | CLUS_1 | CLUS_2 | CLUS_3 |
|---|---|---|---|
| ALL | 33 | 55 | 39 |
| 17P MUTATED | 8 | 33 | 10 |
| 17P WILD-TYPE | 25 | 22 | 29 |
Figure S15. Get High-res Image Gene #30: '17p' versus Molecular Subtype #1: 'CN_CNMF'

P value = 7.24e-06 (Fisher's exact test), Q value = 0.0023
Table S16. Gene #31: '17q' versus Molecular Subtype #1: 'CN_CNMF'
| nPatients | CLUS_1 | CLUS_2 | CLUS_3 |
|---|---|---|---|
| ALL | 33 | 55 | 39 |
| 17Q MUTATED | 6 | 33 | 7 |
| 17Q WILD-TYPE | 27 | 22 | 32 |
Figure S16. Get High-res Image Gene #31: '17q' versus Molecular Subtype #1: 'CN_CNMF'
P value = 0.000759 (Fisher's exact test), Q value = 0.23
Table S17. Gene #32: '18p' versus Molecular Subtype #1: 'CN_CNMF'
| nPatients | CLUS_1 | CLUS_2 | CLUS_3 |
|---|---|---|---|
| ALL | 33 | 55 | 39 |
| 18P MUTATED | 9 | 32 | 9 |
| 18P WILD-TYPE | 24 | 23 | 30 |
Figure S17. Get High-res Image Gene #32: '18p' versus Molecular Subtype #1: 'CN_CNMF'
P value = 0.00041 (Fisher's exact test), Q value = 0.12
Table S18. Gene #32: '18p' versus Molecular Subtype #2: 'METHLYATION_CNMF'
| nPatients | CLUS_1 | CLUS_2 | CLUS_3 |
|---|---|---|---|
| ALL | 34 | 43 | 50 |
| 18P MUTATED | 5 | 25 | 20 |
| 18P WILD-TYPE | 29 | 18 | 30 |
Figure S18. Get High-res Image Gene #32: '18p' versus Molecular Subtype #2: 'METHLYATION_CNMF'
P value = 0.000538 (Fisher's exact test), Q value = 0.16
Table S19. Gene #33: '18q' versus Molecular Subtype #1: 'CN_CNMF'
| nPatients | CLUS_1 | CLUS_2 | CLUS_3 |
|---|---|---|---|
| ALL | 33 | 55 | 39 |
| 18Q MUTATED | 10 | 32 | 8 |
| 18Q WILD-TYPE | 23 | 23 | 31 |
Figure S19. Get High-res Image Gene #33: '18q' versus Molecular Subtype #1: 'CN_CNMF'
P value = 4.75e-08 (Fisher's exact test), Q value = 1.5e-05
Table S20. Gene #34: '19p' versus Molecular Subtype #1: 'CN_CNMF'
| nPatients | CLUS_1 | CLUS_2 | CLUS_3 |
|---|---|---|---|
| ALL | 33 | 55 | 39 |
| 19P MUTATED | 10 | 33 | 2 |
| 19P WILD-TYPE | 23 | 22 | 37 |
Figure S20. Get High-res Image Gene #34: '19p' versus Molecular Subtype #1: 'CN_CNMF'
P value = 1.96e-05 (Fisher's exact test), Q value = 0.0061
Table S21. Gene #35: '19q' versus Molecular Subtype #1: 'CN_CNMF'
| nPatients | CLUS_1 | CLUS_2 | CLUS_3 |
|---|---|---|---|
| ALL | 33 | 55 | 39 |
| 19Q MUTATED | 9 | 30 | 4 |
| 19Q WILD-TYPE | 24 | 25 | 35 |
Figure S21. Get High-res Image Gene #35: '19q' versus Molecular Subtype #1: 'CN_CNMF'
P value = 0.000615 (Fisher's exact test), Q value = 0.18
Table S22. Gene #38: '21q' versus Molecular Subtype #1: 'CN_CNMF'
| nPatients | CLUS_1 | CLUS_2 | CLUS_3 |
|---|---|---|---|
| ALL | 33 | 55 | 39 |
| 21Q MUTATED | 14 | 33 | 8 |
| 21Q WILD-TYPE | 19 | 22 | 31 |
Figure S22. Get High-res Image Gene #38: '21q' versus Molecular Subtype #1: 'CN_CNMF'
P value = 1.55e-05 (Fisher's exact test), Q value = 0.0049
Table S23. Gene #38: '21q' versus Molecular Subtype #2: 'METHLYATION_CNMF'
| nPatients | CLUS_1 | CLUS_2 | CLUS_3 |
|---|---|---|---|
| ALL | 34 | 43 | 50 |
| 21Q MUTATED | 9 | 31 | 15 |
| 21Q WILD-TYPE | 25 | 12 | 35 |
Figure S23. Get High-res Image Gene #38: '21q' versus Molecular Subtype #2: 'METHLYATION_CNMF'
P value = 0.000407 (Fisher's exact test), Q value = 0.12
Table S24. Gene #39: '22q' versus Molecular Subtype #1: 'CN_CNMF'
| nPatients | CLUS_1 | CLUS_2 | CLUS_3 |
|---|---|---|---|
| ALL | 33 | 55 | 39 |
| 22Q MUTATED | 15 | 40 | 13 |
| 22Q WILD-TYPE | 18 | 15 | 26 |
Figure S24. Get High-res Image Gene #39: '22q' versus Molecular Subtype #1: 'CN_CNMF'
P value = 0.000148 (Fisher's exact test), Q value = 0.046
Table S25. Gene #40: 'xq' versus Molecular Subtype #2: 'METHLYATION_CNMF'
| nPatients | CLUS_1 | CLUS_2 | CLUS_3 |
|---|---|---|---|
| ALL | 34 | 43 | 50 |
| XQ MUTATED | 7 | 23 | 33 |
| XQ WILD-TYPE | 27 | 20 | 17 |
Figure S25. Get High-res Image Gene #40: 'xq' versus Molecular Subtype #2: 'METHLYATION_CNMF'
-
Copy number data file = transformed.cor.cli.txt
-
Molecular subtype file = SARC-TP.transferedmergedcluster.txt
-
Number of patients = 127
-
Number of significantly focal cnvs = 40
-
Number of molecular subtypes = 8
-
Exclude genes that fewer than K tumors have alterations, K = 3
For binary or multi-class clinical features (nominal or ordinal), two-tailed Fisher's exact tests (Fisher 1922) were used to estimate the P values using the 'fisher.test' function in R
For multiple hypothesis correction, Q value is the False Discovery Rate (FDR) analogue of the P value (Benjamini and Hochberg 1995), defined as the minimum FDR at which the test may be called significant. We used the 'Benjamini and Hochberg' method of 'p.adjust' function in R to convert P values into Q values.
In addition to the links below, the full results of the analysis summarized in this report can also be downloaded programmatically using firehose_get, or interactively from either the Broad GDAC website or TCGA Data Coordination Center Portal.