This pipeline computes the correlation between significantly recurrent gene mutations and selected clinical features.
Testing the association between mutation status of 97 genes and 6 clinical features across 34 patients, 3 significant findings detected with Q value < 0.25.
-
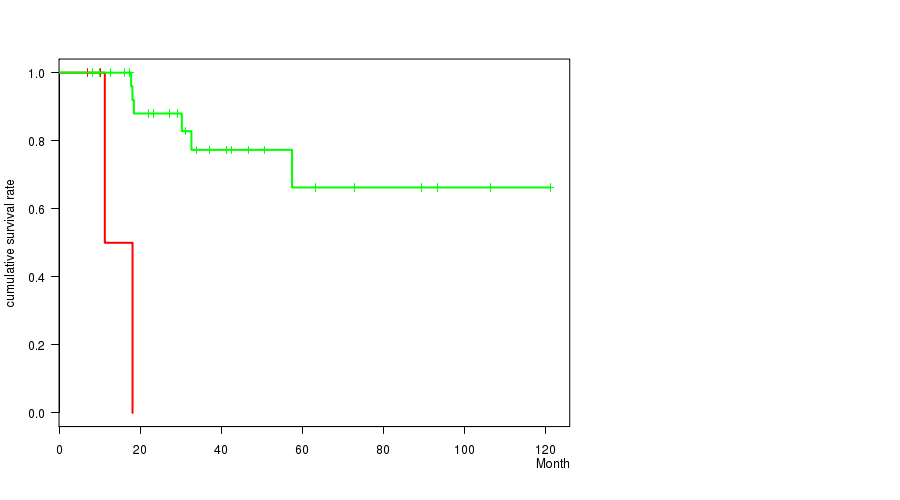
SCRT1 mutation correlated to 'Time to Death' and 'AGE'.
-
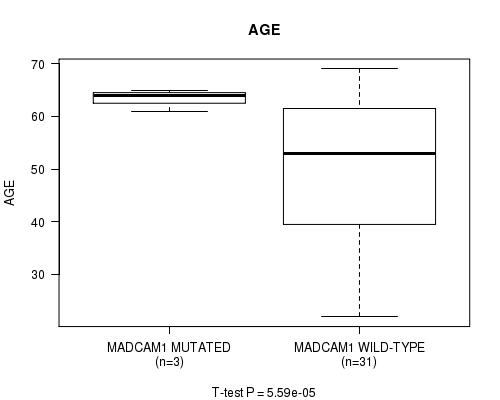
MADCAM1 mutation correlated to 'AGE'.
Table 1. Get Full Table Overview of the association between mutation status of 97 genes and 6 clinical features. Shown in the table are P values (Q values). Thresholded by Q value < 0.25, 3 significant findings detected.
|
Clinical Features |
Time to Death |
AGE |
NEOPLASM DISEASESTAGE |
PATHOLOGY T STAGE |
PATHOLOGY N STAGE |
GENDER | ||
| nMutated (%) | nWild-Type | logrank test | t-test | Fisher's exact test | Fisher's exact test | Fisher's exact test | Fisher's exact test | |
| SCRT1 | 4 (12%) | 30 |
1.68e-05 (0.00935) |
0.000254 (0.141) |
0.693 (1.00) |
0.788 (1.00) |
0.075 (1.00) |
1 (1.00) |
| MADCAM1 | 3 (9%) | 31 |
0.0045 (1.00) |
5.59e-05 (0.031) |
0.161 (1.00) |
0.0389 (1.00) |
0.0394 (1.00) |
1 (1.00) |
| NMU | 7 (21%) | 27 |
0.953 (1.00) |
0.258 (1.00) |
0.502 (1.00) |
0.83 (1.00) |
0.0181 (1.00) |
0.398 (1.00) |
| LPPR2 | 3 (9%) | 31 |
0.0026 (1.00) |
0.726 (1.00) |
0.253 (1.00) |
1 (1.00) |
||
| SYT8 | 6 (18%) | 28 |
0.648 (1.00) |
0.27 (1.00) |
0.916 (1.00) |
1 (1.00) |
1 (1.00) |
0.175 (1.00) |
| RINL | 8 (24%) | 26 |
0.661 (1.00) |
0.516 (1.00) |
0.859 (1.00) |
0.51 (1.00) |
1 (1.00) |
0.688 (1.00) |
| OBSCN | 15 (44%) | 19 |
0.382 (1.00) |
0.0591 (1.00) |
0.748 (1.00) |
0.592 (1.00) |
1 (1.00) |
1 (1.00) |
| MAP1S | 4 (12%) | 30 |
0.28 (1.00) |
0.161 (1.00) |
0.693 (1.00) |
1 (1.00) |
0.454 (1.00) |
1 (1.00) |
| GPRIN2 | 4 (12%) | 30 |
0.884 (1.00) |
0.907 (1.00) |
0.356 (1.00) |
1 (1.00) |
1 (1.00) |
0.601 (1.00) |
| ATP9B | 3 (9%) | 31 |
0.328 (1.00) |
0.121 (1.00) |
0.253 (1.00) |
1 (1.00) |
||
| RREB1 | 4 (12%) | 30 |
0.954 (1.00) |
0.166 (1.00) |
1 (1.00) |
1 (1.00) |
0.454 (1.00) |
1 (1.00) |
| IDUA | 6 (18%) | 28 |
0.636 (1.00) |
0.727 (1.00) |
0.79 (1.00) |
1 (1.00) |
1 (1.00) |
1 (1.00) |
| RGS9BP | 6 (18%) | 28 |
0.791 (1.00) |
0.103 (1.00) |
0.0884 (1.00) |
0.327 (1.00) |
1 (1.00) |
0.656 (1.00) |
| WDR34 | 4 (12%) | 30 |
0.759 (1.00) |
0.0642 (1.00) |
0.602 (1.00) |
0.704 (1.00) |
0.36 (1.00) |
0.601 (1.00) |
| NOTCH2 | 3 (9%) | 31 |
0.32 (1.00) |
0.968 (1.00) |
0.133 (1.00) |
1 (1.00) |
||
| TMEM189 | 3 (9%) | 31 |
0.337 (1.00) |
0.244 (1.00) |
1 (1.00) |
1 (1.00) |
||
| TAF5 | 5 (15%) | 29 |
0.383 (1.00) |
0.455 (1.00) |
0.693 (1.00) |
0.788 (1.00) |
0.454 (1.00) |
0.335 (1.00) |
| LRP11 | 4 (12%) | 30 |
0.312 (1.00) |
0.724 (1.00) |
1 (1.00) |
0.601 (1.00) |
||
| FPGS | 7 (21%) | 27 |
0.314 (1.00) |
0.024 (1.00) |
0.923 (1.00) |
0.83 (1.00) |
0.225 (1.00) |
1 (1.00) |
| TOR3A | 13 (38%) | 21 |
0.304 (1.00) |
0.947 (1.00) |
0.108 (1.00) |
0.0979 (1.00) |
0.611 (1.00) |
0.481 (1.00) |
| ZNF517 | 17 (50%) | 17 |
0.493 (1.00) |
0.267 (1.00) |
0.792 (1.00) |
0.679 (1.00) |
0.598 (1.00) |
0.494 (1.00) |
| GLTPD2 | 10 (29%) | 24 |
0.608 (1.00) |
0.235 (1.00) |
0.674 (1.00) |
1 (1.00) |
1 (1.00) |
0.708 (1.00) |
| SEMA5B | 7 (21%) | 27 |
0.597 (1.00) |
0.446 (1.00) |
0.492 (1.00) |
0.412 (1.00) |
1 (1.00) |
1 (1.00) |
| TNIP2 | 3 (9%) | 31 |
0.287 (1.00) |
0.774 (1.00) |
1 (1.00) |
1 (1.00) |
||
| HHIPL1 | 5 (15%) | 29 |
0.909 (1.00) |
0.968 (1.00) |
0.312 (1.00) |
0.66 (1.00) |
0.119 (1.00) |
1 (1.00) |
| HECTD2 | 3 (9%) | 31 |
0.0118 (1.00) |
0.337 (1.00) |
0.829 (1.00) |
0.704 (1.00) |
1 (1.00) |
0.227 (1.00) |
| ADAD2 | 10 (29%) | 24 |
0.164 (1.00) |
0.742 (1.00) |
0.343 (1.00) |
0.853 (1.00) |
0.563 (1.00) |
1 (1.00) |
| CTNNB1 | 7 (21%) | 27 |
0.00515 (1.00) |
0.239 (1.00) |
0.712 (1.00) |
0.51 (1.00) |
0.225 (1.00) |
0.0854 (1.00) |
| ZFPM1 | 19 (56%) | 15 |
0.0784 (1.00) |
0.828 (1.00) |
0.0224 (1.00) |
0.448 (1.00) |
0.613 (1.00) |
1 (1.00) |
| CLDN23 | 4 (12%) | 30 |
0.996 (1.00) |
0.39 (1.00) |
0.531 (1.00) |
0.424 (1.00) |
0.454 (1.00) |
1 (1.00) |
| CCDC105 | 4 (12%) | 30 |
0.571 (1.00) |
0.581 (1.00) |
0.356 (1.00) |
0.327 (1.00) |
1 (1.00) |
0.103 (1.00) |
| NOL9 | 7 (21%) | 27 |
0.998 (1.00) |
0.00558 (1.00) |
0.244 (1.00) |
0.37 (1.00) |
1 (1.00) |
1 (1.00) |
| ZNF598 | 7 (21%) | 27 |
0.554 (1.00) |
0.0053 (1.00) |
0.0475 (1.00) |
0.0439 (1.00) |
0.557 (1.00) |
1 (1.00) |
| THEM4 | 6 (18%) | 28 |
0.08 (1.00) |
0.827 (1.00) |
1 (1.00) |
0.788 (1.00) |
0.454 (1.00) |
0.656 (1.00) |
| LRIG1 | 16 (47%) | 18 |
0.0659 (1.00) |
0.997 (1.00) |
0.593 (1.00) |
0.194 (1.00) |
1 (1.00) |
0.303 (1.00) |
| MUC5B | 8 (24%) | 26 |
0.549 (1.00) |
0.412 (1.00) |
0.715 (1.00) |
0.83 (1.00) |
0.557 (1.00) |
0.688 (1.00) |
| AMDHD1 | 10 (29%) | 24 |
0.937 (1.00) |
0.345 (1.00) |
0.663 (1.00) |
1 (1.00) |
1 (1.00) |
0.708 (1.00) |
| RNF149 | 3 (9%) | 31 |
0.37 (1.00) |
0.609 (1.00) |
0.0996 (1.00) |
0.0651 (1.00) |
1 (1.00) |
0.227 (1.00) |
| MSH3 | 3 (9%) | 31 |
0.0326 (1.00) |
0.917 (1.00) |
0.161 (1.00) |
0.105 (1.00) |
0.36 (1.00) |
1 (1.00) |
| ALPPL2 | 3 (9%) | 31 |
0.328 (1.00) |
0.828 (1.00) |
0.829 (1.00) |
0.704 (1.00) |
1 (1.00) |
1 (1.00) |
| SNED1 | 4 (12%) | 30 |
0.195 (1.00) |
0.704 (1.00) |
0.531 (1.00) |
0.424 (1.00) |
0.075 (1.00) |
1 (1.00) |
| OPRD1 | 11 (32%) | 23 |
0.971 (1.00) |
0.652 (1.00) |
0.878 (1.00) |
0.738 (1.00) |
1 (1.00) |
0.0255 (1.00) |
| CCDC102A | 11 (32%) | 23 |
0.217 (1.00) |
0.121 (1.00) |
0.0298 (1.00) |
0.0751 (1.00) |
0.272 (1.00) |
1 (1.00) |
| KCTD3 | 4 (12%) | 30 |
0.438 (1.00) |
0.681 (1.00) |
0.829 (1.00) |
0.704 (1.00) |
0.36 (1.00) |
1 (1.00) |
| C1ORF106 | 6 (18%) | 28 |
0.728 (1.00) |
0.98 (1.00) |
0.406 (1.00) |
0.288 (1.00) |
1 (1.00) |
0.175 (1.00) |
| KCNK17 | 9 (26%) | 25 |
0.176 (1.00) |
0.672 (1.00) |
0.738 (1.00) |
1 (1.00) |
0.284 (1.00) |
0.438 (1.00) |
| LACTB | 11 (32%) | 23 |
0.79 (1.00) |
0.284 (1.00) |
0.0852 (1.00) |
0.233 (1.00) |
0.272 (1.00) |
1 (1.00) |
| TRIOBP | 9 (26%) | 25 |
0.929 (1.00) |
0.594 (1.00) |
0.532 (1.00) |
0.213 (1.00) |
1 (1.00) |
1 (1.00) |
| SARM1 | 5 (15%) | 29 |
0.438 (1.00) |
0.439 (1.00) |
1 (1.00) |
1 (1.00) |
1 (1.00) |
1 (1.00) |
| ERCC2 | 11 (32%) | 23 |
0.185 (1.00) |
0.835 (1.00) |
0.942 (1.00) |
1 (1.00) |
0.611 (1.00) |
0.465 (1.00) |
| NEFH | 4 (12%) | 30 |
0.987 (1.00) |
0.848 (1.00) |
0.531 (1.00) |
0.788 (1.00) |
0.075 (1.00) |
1 (1.00) |
| KBTBD13 | 8 (24%) | 26 |
0.482 (1.00) |
0.271 (1.00) |
0.663 (1.00) |
0.534 (1.00) |
0.284 (1.00) |
0.688 (1.00) |
| IRX3 | 9 (26%) | 25 |
0.361 (1.00) |
0.809 (1.00) |
0.216 (1.00) |
0.619 (1.00) |
1 (1.00) |
0.118 (1.00) |
| MUC2 | 7 (21%) | 27 |
0.243 (1.00) |
0.133 (1.00) |
0.058 (1.00) |
0.0271 (1.00) |
0.557 (1.00) |
0.0854 (1.00) |
| GARS | 14 (41%) | 20 |
0.459 (1.00) |
0.443 (1.00) |
0.116 (1.00) |
0.436 (1.00) |
0.613 (1.00) |
0.728 (1.00) |
| UQCRFS1 | 7 (21%) | 27 |
0.702 (1.00) |
0.907 (1.00) |
0.492 (1.00) |
0.412 (1.00) |
0.225 (1.00) |
1 (1.00) |
| ZNF628 | 5 (15%) | 29 |
0.00972 (1.00) |
0.747 (1.00) |
0.762 (1.00) |
1 (1.00) |
1 (1.00) |
1 (1.00) |
| ASPDH | 11 (32%) | 23 |
0.653 (1.00) |
0.724 (1.00) |
0.284 (1.00) |
0.644 (1.00) |
1 (1.00) |
0.465 (1.00) |
| TPO | 10 (29%) | 24 |
0.916 (1.00) |
0.772 (1.00) |
0.198 (1.00) |
0.339 (1.00) |
0.287 (1.00) |
0.259 (1.00) |
| GLTSCR2 | 4 (12%) | 30 |
0.453 (1.00) |
0.35 (1.00) |
0.693 (1.00) |
0.788 (1.00) |
1 (1.00) |
0.601 (1.00) |
| PANK2 | 7 (21%) | 27 |
0.833 (1.00) |
0.9 (1.00) |
0.849 (1.00) |
0.83 (1.00) |
0.169 (1.00) |
0.398 (1.00) |
| RNF39 | 3 (9%) | 31 |
0.0782 (1.00) |
0.069 (1.00) |
0.253 (1.00) |
1 (1.00) |
||
| MAL2 | 7 (21%) | 27 |
0.957 (1.00) |
0.0128 (1.00) |
0.431 (1.00) |
0.024 (1.00) |
1 (1.00) |
0.398 (1.00) |
| ZAR1 | 11 (32%) | 23 |
0.168 (1.00) |
0.924 (1.00) |
0.25 (1.00) |
0.358 (1.00) |
1 (1.00) |
0.141 (1.00) |
| KRTAP5-5 | 3 (9%) | 31 |
0.0118 (1.00) |
0.337 (1.00) |
0.829 (1.00) |
0.704 (1.00) |
1 (1.00) |
0.227 (1.00) |
| CRIPAK | 6 (18%) | 28 |
0.371 (1.00) |
0.179 (1.00) |
0.715 (1.00) |
0.83 (1.00) |
1 (1.00) |
0.656 (1.00) |
| TP53 | 7 (21%) | 27 |
0.0283 (1.00) |
0.18 (1.00) |
0.015 (1.00) |
0.00258 (1.00) |
0.169 (1.00) |
1 (1.00) |
| BHLHE22 | 4 (12%) | 30 |
0.381 (1.00) |
0.985 (1.00) |
1 (1.00) |
0.788 (1.00) |
0.454 (1.00) |
1 (1.00) |
| RGMB | 3 (9%) | 31 |
0.578 (1.00) |
0.932 (1.00) |
0.829 (1.00) |
0.704 (1.00) |
0.36 (1.00) |
1 (1.00) |
| APOE | 6 (18%) | 28 |
0.597 (1.00) |
0.175 (1.00) |
0.916 (1.00) |
1 (1.00) |
1 (1.00) |
0.656 (1.00) |
| MEN1 | 3 (9%) | 31 |
0.91 (1.00) |
0.121 (1.00) |
1 (1.00) |
1 (1.00) |
||
| RASIP1 | 4 (12%) | 30 |
0.306 (1.00) |
0.445 (1.00) |
1 (1.00) |
0.788 (1.00) |
0.454 (1.00) |
0.601 (1.00) |
| ZC3H12D | 3 (9%) | 31 |
0.113 (1.00) |
0.222 (1.00) |
1 (1.00) |
1 (1.00) |
||
| TSC22D2 | 7 (21%) | 27 |
0.118 (1.00) |
0.85 (1.00) |
0.312 (1.00) |
0.0368 (1.00) |
0.169 (1.00) |
1 (1.00) |
| COQ2 | 5 (15%) | 29 |
0.791 (1.00) |
0.306 (1.00) |
0.916 (1.00) |
1 (1.00) |
1 (1.00) |
0.335 (1.00) |
| DOK7 | 5 (15%) | 29 |
0.204 (1.00) |
0.564 (1.00) |
0.147 (1.00) |
0.0631 (1.00) |
1 (1.00) |
1 (1.00) |
| KNDC1 | 7 (21%) | 27 |
0.251 (1.00) |
0.497 (1.00) |
0.406 (1.00) |
0.288 (1.00) |
1 (1.00) |
1 (1.00) |
| PDCD6 | 3 (9%) | 31 |
0.744 (1.00) |
0.661 (1.00) |
0.0416 (1.00) |
0.0159 (1.00) |
0.36 (1.00) |
1 (1.00) |
| ATP6V0E2 | 4 (12%) | 30 |
0.289 (1.00) |
0.048 (1.00) |
0.502 (1.00) |
0.389 (1.00) |
1 (1.00) |
0.601 (1.00) |
| HES3 | 3 (9%) | 31 |
0.385 (1.00) |
0.198 (1.00) |
1 (1.00) |
1 (1.00) |
1 (1.00) |
1 (1.00) |
| PRKAR1A | 3 (9%) | 31 |
0.0583 (1.00) |
0.877 (1.00) |
0.161 (1.00) |
0.105 (1.00) |
0.36 (1.00) |
0.227 (1.00) |
| ATOH8 | 3 (9%) | 31 |
0.188 (1.00) |
0.99 (1.00) |
0.829 (1.00) |
0.704 (1.00) |
0.36 (1.00) |
1 (1.00) |
| BTBD11 | 4 (12%) | 30 |
0.055 (1.00) |
0.646 (1.00) |
0.602 (1.00) |
0.424 (1.00) |
0.454 (1.00) |
1 (1.00) |
| PLIN5 | 4 (12%) | 30 |
0.704 (1.00) |
0.283 (1.00) |
0.79 (1.00) |
1 (1.00) |
0.454 (1.00) |
1 (1.00) |
| ASB16 | 4 (12%) | 30 |
0.867 (1.00) |
0.488 (1.00) |
1 (1.00) |
0.788 (1.00) |
1 (1.00) |
0.601 (1.00) |
| NPTX1 | 5 (15%) | 29 |
0.237 (1.00) |
0.101 (1.00) |
0.147 (1.00) |
0.0631 (1.00) |
1 (1.00) |
1 (1.00) |
| LRRN4 | 3 (9%) | 31 |
0.438 (1.00) |
0.397 (1.00) |
0.602 (1.00) |
1 (1.00) |
0.36 (1.00) |
1 (1.00) |
| CCDC96 | 4 (12%) | 30 |
0.337 (1.00) |
0.136 (1.00) |
0.829 (1.00) |
0.704 (1.00) |
0.36 (1.00) |
0.601 (1.00) |
| PCMTD1 | 3 (9%) | 31 |
0.851 (1.00) |
0.439 (1.00) |
1 (1.00) |
1 (1.00) |
||
| GLI3 | 5 (15%) | 29 |
0.769 (1.00) |
0.0234 (1.00) |
0.602 (1.00) |
0.424 (1.00) |
1 (1.00) |
1 (1.00) |
| MN1 | 3 (9%) | 31 |
0.138 (1.00) |
0.0816 (1.00) |
1 (1.00) |
0.389 (1.00) |
0.36 (1.00) |
0.227 (1.00) |
| C9ORF66 | 3 (9%) | 31 |
0.834 (1.00) |
0.365 (1.00) |
0.502 (1.00) |
0.236 (1.00) |
1 (1.00) |
1 (1.00) |
| KRTAP10-7 | 3 (9%) | 31 |
0.289 (1.00) |
0.765 (1.00) |
1 (1.00) |
1 (1.00) |
||
| ARRDC4 | 5 (15%) | 29 |
0.652 (1.00) |
0.58 (1.00) |
0.916 (1.00) |
1 (1.00) |
0.538 (1.00) |
1 (1.00) |
| VARS | 3 (9%) | 31 |
0.254 (1.00) |
0.274 (1.00) |
1 (1.00) |
1 (1.00) |
||
| PLEC | 6 (18%) | 28 |
0.204 (1.00) |
0.387 (1.00) |
0.469 (1.00) |
1 (1.00) |
0.557 (1.00) |
0.656 (1.00) |
| RCCD1 | 3 (9%) | 31 |
0.348 (1.00) |
0.605 (1.00) |
1 (1.00) |
1 (1.00) |
P value = 1.68e-05 (logrank test), Q value = 0.0094
Table S1. Gene #84: 'SCRT1 MUTATION STATUS' versus Clinical Feature #1: 'Time to Death'
| nPatients | nDeath | Duration Range (Median), Month | |
|---|---|---|---|
| ALL | 34 | 8 | 6.9 - 121.2 (29.8) |
| SCRT1 MUTATED | 4 | 2 | 6.9 - 18.1 (10.7) |
| SCRT1 WILD-TYPE | 30 | 6 | 8.3 - 121.2 (32.0) |
Figure S1. Get High-res Image Gene #84: 'SCRT1 MUTATION STATUS' versus Clinical Feature #1: 'Time to Death'
P value = 0.000254 (t-test), Q value = 0.14
Table S2. Gene #84: 'SCRT1 MUTATION STATUS' versus Clinical Feature #2: 'AGE'
| nPatients | Mean (Std.Dev) | |
|---|---|---|
| ALL | 34 | 50.8 (14.3) |
| SCRT1 MUTATED | 4 | 63.5 (3.7) |
| SCRT1 WILD-TYPE | 30 | 49.1 (14.4) |
Figure S2. Get High-res Image Gene #84: 'SCRT1 MUTATION STATUS' versus Clinical Feature #2: 'AGE'

P value = 5.59e-05 (t-test), Q value = 0.031
Table S3. Gene #92: 'MADCAM1 MUTATION STATUS' versus Clinical Feature #2: 'AGE'
| nPatients | Mean (Std.Dev) | |
|---|---|---|
| ALL | 34 | 50.8 (14.3) |
| MADCAM1 MUTATED | 3 | 63.3 (2.1) |
| MADCAM1 WILD-TYPE | 31 | 49.6 (14.4) |
Figure S3. Get High-res Image Gene #92: 'MADCAM1 MUTATION STATUS' versus Clinical Feature #2: 'AGE'
-
Mutation data file = transformed.cor.cli.txt
-
Clinical data file = ACC-TP.merged_data.txt
-
Number of patients = 34
-
Number of significantly mutated genes = 97
-
Number of selected clinical features = 6
-
Exclude genes that fewer than K tumors have mutations, K = 3
For survival clinical features, the Kaplan-Meier survival curves of tumors with and without gene mutations were plotted and the statistical significance P values were estimated by logrank test (Bland and Altman 2004) using the 'survdiff' function in R
For continuous numerical clinical features, two-tailed Student's t test with unequal variance (Lehmann and Romano 2005) was applied to compare the clinical values between tumors with and without gene mutations using 't.test' function in R
For binary or multi-class clinical features (nominal or ordinal), two-tailed Fisher's exact tests (Fisher 1922) were used to estimate the P values using the 'fisher.test' function in R
For multiple hypothesis correction, Q value is the False Discovery Rate (FDR) analogue of the P value (Benjamini and Hochberg 1995), defined as the minimum FDR at which the test may be called significant. We used the 'Benjamini and Hochberg' method of 'p.adjust' function in R to convert P values into Q values.
In addition to the links below, the full results of the analysis summarized in this report can also be downloaded programmatically using firehose_get, or interactively from either the Broad GDAC website or TCGA Data Coordination Center Portal.