This pipeline computes the correlation between significant arm-level copy number variations (cnvs) and selected clinical features.
Testing the association between copy number variation 80 arm-level events and 9 clinical features across 150 patients, 2 significant findings detected with Q value < 0.25.
-
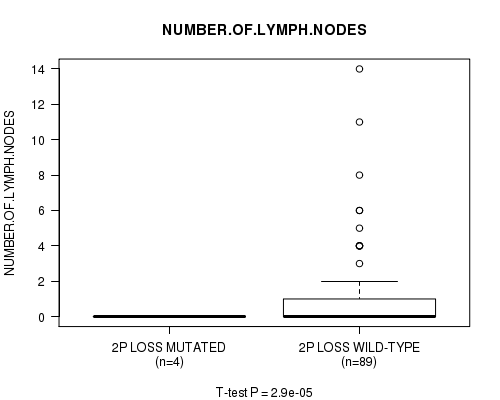
2p loss cnv correlated to 'NUMBER.OF.LYMPH.NODES'.
-
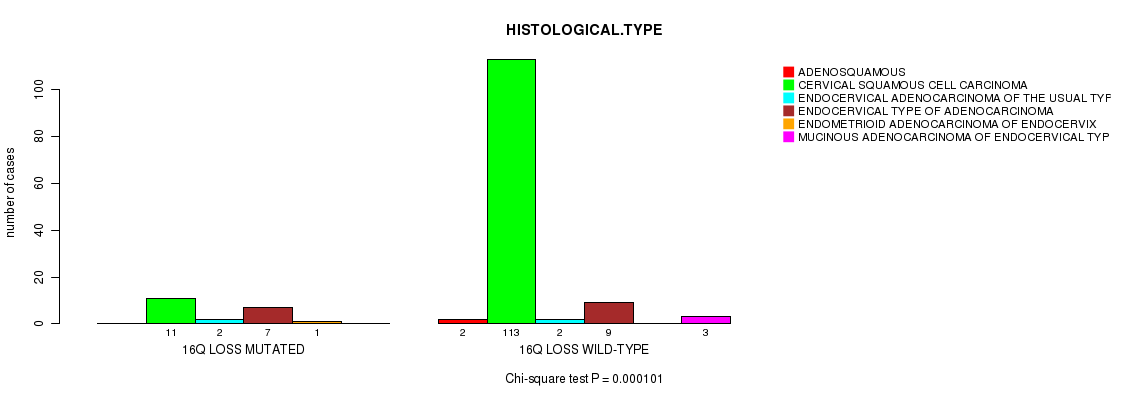
16q loss cnv correlated to 'HISTOLOGICAL.TYPE'.
Table 1. Get Full Table Overview of the association between significant copy number variation of 80 arm-level events and 9 clinical features. Shown in the table are P values (Q values). Thresholded by Q value < 0.25, 2 significant findings detected.
|
Clinical Features |
Time to Death |
AGE |
PATHOLOGY T STAGE |
PATHOLOGY N STAGE |
PATHOLOGY M STAGE |
HISTOLOGICAL TYPE |
RADIATIONS RADIATION REGIMENINDICATION |
NUMBERPACKYEARSSMOKED |
NUMBER OF LYMPH NODES |
||
| nCNV (%) | nWild-Type | logrank test | t-test | Fisher's exact test | Fisher's exact test | Fisher's exact test | Chi-square test | Fisher's exact test | t-test | t-test | |
| 2p loss | 8 (5%) | 142 |
0.571 (1.00) |
0.307 (1.00) |
1 (1.00) |
0.661 (1.00) |
0.73 (1.00) |
0.308 (1.00) |
0.621 (1.00) |
2.9e-05 (0.0198) |
|
| 16q loss | 21 (14%) | 129 |
0.48 (1.00) |
0.0628 (1.00) |
0.388 (1.00) |
0.171 (1.00) |
0.871 (1.00) |
0.000101 (0.0685) |
1 (1.00) |
0.668 (1.00) |
0.732 (1.00) |
| 1p gain | 45 (30%) | 105 |
0.84 (1.00) |
0.116 (1.00) |
0.494 (1.00) |
0.655 (1.00) |
0.68 (1.00) |
0.284 (1.00) |
1 (1.00) |
0.4 (1.00) |
0.35 (1.00) |
| 1q gain | 73 (49%) | 77 |
0.549 (1.00) |
0.687 (1.00) |
0.21 (1.00) |
0.683 (1.00) |
0.729 (1.00) |
0.916 (1.00) |
0.274 (1.00) |
0.899 (1.00) |
0.6 (1.00) |
| 2p gain | 26 (17%) | 124 |
0.144 (1.00) |
0.329 (1.00) |
1 (1.00) |
1 (1.00) |
0.867 (1.00) |
0.511 (1.00) |
1 (1.00) |
0.573 (1.00) |
0.92 (1.00) |
| 2q gain | 18 (12%) | 132 |
0.00737 (1.00) |
0.41 (1.00) |
1 (1.00) |
0.727 (1.00) |
1 (1.00) |
0.841 (1.00) |
0.739 (1.00) |
0.651 (1.00) |
|
| 3p gain | 37 (25%) | 113 |
0.0215 (1.00) |
0.281 (1.00) |
1 (1.00) |
0.618 (1.00) |
1 (1.00) |
0.163 (1.00) |
0.445 (1.00) |
0.432 (1.00) |
0.117 (1.00) |
| 3q gain | 89 (59%) | 61 |
0.475 (1.00) |
0.832 (1.00) |
0.674 (1.00) |
0.0658 (1.00) |
0.0939 (1.00) |
0.082 (1.00) |
0.0255 (1.00) |
0.543 (1.00) |
0.0134 (1.00) |
| 4p gain | 3 (2%) | 147 |
0.193 (1.00) |
0.33 (1.00) |
0.986 (1.00) |
0.424 (1.00) |
|||||
| 4q gain | 4 (3%) | 146 |
0.85 (1.00) |
0.0244 (1.00) |
0.557 (1.00) |
0.253 (1.00) |
0.166 (1.00) |
0.955 (1.00) |
1 (1.00) |
0.551 (1.00) |
|
| 5p gain | 51 (34%) | 99 |
0.63 (1.00) |
0.284 (1.00) |
0.641 (1.00) |
0.501 (1.00) |
0.737 (1.00) |
0.333 (1.00) |
0.355 (1.00) |
0.287 (1.00) |
0.594 (1.00) |
| 5q gain | 22 (15%) | 128 |
0.387 (1.00) |
0.17 (1.00) |
1 (1.00) |
1 (1.00) |
0.599 (1.00) |
0.778 (1.00) |
1 (1.00) |
0.573 (1.00) |
0.44 (1.00) |
| 6p gain | 31 (21%) | 119 |
0.498 (1.00) |
0.823 (1.00) |
0.597 (1.00) |
1 (1.00) |
0.26 (1.00) |
0.868 (1.00) |
0.416 (1.00) |
0.764 (1.00) |
0.524 (1.00) |
| 6q gain | 17 (11%) | 133 |
0.153 (1.00) |
0.891 (1.00) |
0.503 (1.00) |
1 (1.00) |
0.111 (1.00) |
0.727 (1.00) |
0.164 (1.00) |
0.461 (1.00) |
0.316 (1.00) |
| 7p gain | 16 (11%) | 134 |
0.968 (1.00) |
0.318 (1.00) |
0.269 (1.00) |
1 (1.00) |
1 (1.00) |
0.878 (1.00) |
0.732 (1.00) |
0.577 (1.00) |
|
| 7q gain | 15 (10%) | 135 |
0.294 (1.00) |
0.0976 (1.00) |
0.722 (1.00) |
1 (1.00) |
0.809 (1.00) |
0.624 (1.00) |
0.135 (1.00) |
0.0682 (1.00) |
|
| 8p gain | 24 (16%) | 126 |
0.448 (1.00) |
0.0223 (1.00) |
0.561 (1.00) |
1 (1.00) |
1 (1.00) |
0.802 (1.00) |
0.555 (1.00) |
0.68 (1.00) |
0.522 (1.00) |
| 8q gain | 41 (27%) | 109 |
0.757 (1.00) |
0.0366 (1.00) |
1 (1.00) |
0.817 (1.00) |
0.556 (1.00) |
0.253 (1.00) |
0.465 (1.00) |
0.289 (1.00) |
0.941 (1.00) |
| 9p gain | 18 (12%) | 132 |
0.945 (1.00) |
0.973 (1.00) |
0.513 (1.00) |
0.349 (1.00) |
1 (1.00) |
0.917 (1.00) |
0.31 (1.00) |
0.434 (1.00) |
0.7 (1.00) |
| 9q gain | 20 (13%) | 130 |
0.982 (1.00) |
0.815 (1.00) |
0.534 (1.00) |
0.543 (1.00) |
1 (1.00) |
0.753 (1.00) |
0.199 (1.00) |
0.687 (1.00) |
0.7 (1.00) |
| 10p gain | 11 (7%) | 139 |
0.692 (1.00) |
0.393 (1.00) |
0.441 (1.00) |
0.153 (1.00) |
0.608 (1.00) |
0.969 (1.00) |
1 (1.00) |
0.342 (1.00) |
|
| 10q gain | 6 (4%) | 144 |
0.814 (1.00) |
0.46 (1.00) |
0.318 (1.00) |
0.598 (1.00) |
0.21 (1.00) |
0.987 (1.00) |
1 (1.00) |
0.508 (1.00) |
|
| 11p gain | 4 (3%) | 146 |
0.255 (1.00) |
0.09 (1.00) |
0.0212 (1.00) |
0.253 (1.00) |
1 (1.00) |
0.239 (1.00) |
0.522 (1.00) |
0.344 (1.00) |
|
| 11q gain | 4 (3%) | 146 |
0.266 (1.00) |
0.265 (1.00) |
0.068 (1.00) |
0.598 (1.00) |
1 (1.00) |
0.239 (1.00) |
0.522 (1.00) |
0.344 (1.00) |
|
| 12p gain | 22 (15%) | 128 |
0.234 (1.00) |
0.0193 (1.00) |
0.561 (1.00) |
1 (1.00) |
1 (1.00) |
0.85 (1.00) |
0.21 (1.00) |
0.062 (1.00) |
0.296 (1.00) |
| 12q gain | 22 (15%) | 128 |
0.4 (1.00) |
0.0057 (1.00) |
0.771 (1.00) |
1 (1.00) |
1 (1.00) |
0.679 (1.00) |
0.21 (1.00) |
0.0932 (1.00) |
0.399 (1.00) |
| 13q gain | 13 (9%) | 137 |
0.482 (1.00) |
0.974 (1.00) |
1 (1.00) |
1 (1.00) |
1 (1.00) |
0.239 (1.00) |
1 (1.00) |
0.189 (1.00) |
|
| 14q gain | 21 (14%) | 129 |
0.895 (1.00) |
0.615 (1.00) |
1 (1.00) |
0.247 (1.00) |
0.646 (1.00) |
0.401 (1.00) |
0.755 (1.00) |
0.751 (1.00) |
0.167 (1.00) |
| 15q gain | 23 (15%) | 127 |
0.0299 (1.00) |
0.958 (1.00) |
0.215 (1.00) |
1 (1.00) |
1 (1.00) |
0.756 (1.00) |
0.223 (1.00) |
0.00638 (1.00) |
0.791 (1.00) |
| 16p gain | 20 (13%) | 130 |
0.962 (1.00) |
0.893 (1.00) |
0.561 (1.00) |
0.391 (1.00) |
0.871 (1.00) |
0.922 (1.00) |
0.747 (1.00) |
0.534 (1.00) |
0.819 (1.00) |
| 16q gain | 17 (11%) | 133 |
0.0627 (1.00) |
0.563 (1.00) |
0.188 (1.00) |
1 (1.00) |
0.478 (1.00) |
0.85 (1.00) |
0.487 (1.00) |
0.862 (1.00) |
0.305 (1.00) |
| 17p gain | 11 (7%) | 139 |
0.805 (1.00) |
0.31 (1.00) |
0.0529 (1.00) |
0.0146 (1.00) |
0.541 (1.00) |
0.922 (1.00) |
0.0876 (1.00) |
0.172 (1.00) |
|
| 17q gain | 21 (14%) | 129 |
0.999 (1.00) |
0.974 (1.00) |
0.00839 (1.00) |
0.0585 (1.00) |
0.856 (1.00) |
0.662 (1.00) |
0.755 (1.00) |
0.137 (1.00) |
|
| 18p gain | 18 (12%) | 132 |
0.592 (1.00) |
0.043 (1.00) |
0.316 (1.00) |
1 (1.00) |
0.478 (1.00) |
0.841 (1.00) |
0.185 (1.00) |
0.914 (1.00) |
0.67 (1.00) |
| 18q gain | 8 (5%) | 142 |
0.724 (1.00) |
0.00961 (1.00) |
0.137 (1.00) |
0.598 (1.00) |
0.448 (1.00) |
0.88 (1.00) |
0.129 (1.00) |
0.164 (1.00) |
|
| 19p gain | 21 (14%) | 129 |
0.723 (1.00) |
0.729 (1.00) |
0.382 (1.00) |
0.0348 (1.00) |
1 (1.00) |
0.716 (1.00) |
0.0514 (1.00) |
0.549 (1.00) |
0.722 (1.00) |
| 19q gain | 32 (21%) | 118 |
0.0378 (1.00) |
0.838 (1.00) |
1 (1.00) |
0.181 (1.00) |
1 (1.00) |
0.319 (1.00) |
0.029 (1.00) |
0.352 (1.00) |
0.893 (1.00) |
| 20p gain | 48 (32%) | 102 |
0.991 (1.00) |
0.365 (1.00) |
0.817 (1.00) |
0.0424 (1.00) |
0.739 (1.00) |
0.814 (1.00) |
0.644 (1.00) |
0.927 (1.00) |
0.264 (1.00) |
| 20q gain | 54 (36%) | 96 |
0.58 (1.00) |
0.188 (1.00) |
1 (1.00) |
0.383 (1.00) |
0.534 (1.00) |
0.841 (1.00) |
0.654 (1.00) |
0.764 (1.00) |
0.593 (1.00) |
| 21q gain | 19 (13%) | 131 |
0.00175 (1.00) |
0.0516 (1.00) |
1 (1.00) |
1 (1.00) |
0.659 (1.00) |
0.472 (1.00) |
0.0929 (1.00) |
0.558 (1.00) |
0.941 (1.00) |
| 22q gain | 18 (12%) | 132 |
0.192 (1.00) |
0.0621 (1.00) |
0.316 (1.00) |
0.727 (1.00) |
0.834 (1.00) |
0.82 (1.00) |
1 (1.00) |
0.576 (1.00) |
|
| xq gain | 19 (13%) | 131 |
0.161 (1.00) |
0.549 (1.00) |
0.344 (1.00) |
0.526 (1.00) |
0.599 (1.00) |
0.787 (1.00) |
1 (1.00) |
0.96 (1.00) |
0.955 (1.00) |
| 1p loss | 6 (4%) | 144 |
0.59 (1.00) |
0.373 (1.00) |
1 (1.00) |
0.987 (1.00) |
0.262 (1.00) |
||||
| 1q loss | 6 (4%) | 144 |
0.764 (1.00) |
0.472 (1.00) |
0.576 (1.00) |
0.104 (1.00) |
1 (1.00) |
0.934 (1.00) |
0.0585 (1.00) |
0.636 (1.00) |
|
| 2q loss | 15 (10%) | 135 |
0.661 (1.00) |
0.519 (1.00) |
0.738 (1.00) |
1 (1.00) |
1 (1.00) |
0.467 (1.00) |
0.135 (1.00) |
0.781 (1.00) |
|
| 3p loss | 39 (26%) | 111 |
0.513 (1.00) |
0.43 (1.00) |
1 (1.00) |
0.00844 (1.00) |
0.724 (1.00) |
0.0504 (1.00) |
0.0429 (1.00) |
0.775 (1.00) |
0.44 (1.00) |
| 3q loss | 5 (3%) | 145 |
0.624 (1.00) |
0.402 (1.00) |
1 (1.00) |
0.955 (1.00) |
0.59 (1.00) |
||||
| 4p loss | 62 (41%) | 88 |
0.603 (1.00) |
0.894 (1.00) |
1 (1.00) |
0.0402 (1.00) |
0.448 (1.00) |
0.0328 (1.00) |
0.122 (1.00) |
0.859 (1.00) |
0.296 (1.00) |
| 4q loss | 40 (27%) | 110 |
0.0105 (1.00) |
0.554 (1.00) |
0.461 (1.00) |
0.0294 (1.00) |
0.923 (1.00) |
0.484 (1.00) |
0.62 (1.00) |
0.865 (1.00) |
0.219 (1.00) |
| 5p loss | 12 (8%) | 138 |
0.00146 (0.996) |
0.578 (1.00) |
0.441 (1.00) |
0.0569 (1.00) |
1 (1.00) |
0.957 (1.00) |
0.0301 (1.00) |
0.987 (1.00) |
0.301 (1.00) |
| 5q loss | 32 (21%) | 118 |
0.257 (1.00) |
0.239 (1.00) |
0.451 (1.00) |
1 (1.00) |
0.825 (1.00) |
0.541 (1.00) |
0.182 (1.00) |
0.756 (1.00) |
0.503 (1.00) |
| 6p loss | 19 (13%) | 131 |
0.726 (1.00) |
0.44 (1.00) |
0.722 (1.00) |
0.293 (1.00) |
1 (1.00) |
0.787 (1.00) |
0.201 (1.00) |
0.482 (1.00) |
0.878 (1.00) |
| 6q loss | 35 (23%) | 115 |
0.108 (1.00) |
0.394 (1.00) |
1 (1.00) |
0.113 (1.00) |
0.464 (1.00) |
0.66 (1.00) |
0.442 (1.00) |
0.0102 (1.00) |
0.624 (1.00) |
| 7p loss | 16 (11%) | 134 |
0.234 (1.00) |
0.716 (1.00) |
0.503 (1.00) |
0.293 (1.00) |
1 (1.00) |
0.935 (1.00) |
0.00106 (0.721) |
0.38 (1.00) |
0.303 (1.00) |
| 7q loss | 25 (17%) | 125 |
0.00502 (1.00) |
0.0606 (1.00) |
0.147 (1.00) |
0.0834 (1.00) |
0.187 (1.00) |
0.73 (1.00) |
0.00184 (1.00) |
0.669 (1.00) |
0.155 (1.00) |
| 8p loss | 40 (27%) | 110 |
0.292 (1.00) |
0.546 (1.00) |
0.625 (1.00) |
1 (1.00) |
0.923 (1.00) |
0.14 (1.00) |
0.321 (1.00) |
0.884 (1.00) |
0.823 (1.00) |
| 8q loss | 11 (7%) | 139 |
0.123 (1.00) |
0.599 (1.00) |
0.349 (1.00) |
0.661 (1.00) |
0.0572 (1.00) |
0.922 (1.00) |
0.0876 (1.00) |
0.584 (1.00) |
|
| 9p loss | 30 (20%) | 120 |
0.0712 (1.00) |
0.153 (1.00) |
1 (1.00) |
0.572 (1.00) |
0.885 (1.00) |
0.717 (1.00) |
0.589 (1.00) |
0.972 (1.00) |
0.519 (1.00) |
| 9q loss | 23 (15%) | 127 |
0.0548 (1.00) |
0.0471 (1.00) |
0.756 (1.00) |
0.747 (1.00) |
1 (1.00) |
0.878 (1.00) |
1 (1.00) |
0.621 (1.00) |
|
| 10p loss | 30 (20%) | 120 |
0.0761 (1.00) |
0.262 (1.00) |
0.0988 (1.00) |
0.0159 (1.00) |
0.0997 (1.00) |
0.895 (1.00) |
0.0511 (1.00) |
0.537 (1.00) |
0.104 (1.00) |
| 10q loss | 33 (22%) | 117 |
0.0123 (1.00) |
0.0553 (1.00) |
0.205 (1.00) |
0.0036 (1.00) |
0.0558 (1.00) |
0.856 (1.00) |
0.109 (1.00) |
0.257 (1.00) |
0.0953 (1.00) |
| 11p loss | 47 (31%) | 103 |
0.974 (1.00) |
0.0941 (1.00) |
0.824 (1.00) |
0.825 (1.00) |
0.543 (1.00) |
0.0773 (1.00) |
0.815 (1.00) |
0.605 (1.00) |
0.435 (1.00) |
| 11q loss | 60 (40%) | 90 |
0.827 (1.00) |
0.00449 (1.00) |
0.671 (1.00) |
1 (1.00) |
1 (1.00) |
0.195 (1.00) |
1 (1.00) |
0.994 (1.00) |
0.257 (1.00) |
| 12p loss | 22 (15%) | 128 |
0.529 (1.00) |
0.672 (1.00) |
0.55 (1.00) |
1 (1.00) |
1 (1.00) |
0.853 (1.00) |
0.764 (1.00) |
0.831 (1.00) |
0.675 (1.00) |
| 12q loss | 7 (5%) | 143 |
0.576 (1.00) |
0.106 (1.00) |
1 (1.00) |
1 (1.00) |
0.627 (1.00) |
0.989 (1.00) |
0.0909 (1.00) |
||
| 13q loss | 39 (26%) | 111 |
0.481 (1.00) |
0.208 (1.00) |
0.141 (1.00) |
0.245 (1.00) |
1 (1.00) |
0.0641 (1.00) |
0.461 (1.00) |
0.114 (1.00) |
0.32 (1.00) |
| 14q loss | 17 (11%) | 133 |
0.921 (1.00) |
0.123 (1.00) |
1 (1.00) |
0.492 (1.00) |
1 (1.00) |
0.909 (1.00) |
0.308 (1.00) |
0.203 (1.00) |
|
| 15q loss | 20 (13%) | 130 |
0.873 (1.00) |
0.345 (1.00) |
0.759 (1.00) |
0.769 (1.00) |
0.352 (1.00) |
0.526 (1.00) |
1 (1.00) |
0.269 (1.00) |
0.52 (1.00) |
| 16p loss | 16 (11%) | 134 |
0.386 (1.00) |
0.141 (1.00) |
0.504 (1.00) |
0.33 (1.00) |
0.051 (1.00) |
0.296 (1.00) |
1 (1.00) |
0.0241 (1.00) |
0.623 (1.00) |
| 17p loss | 47 (31%) | 103 |
0.301 (1.00) |
0.155 (1.00) |
1 (1.00) |
1 (1.00) |
0.406 (1.00) |
0.125 (1.00) |
0.639 (1.00) |
0.473 (1.00) |
0.553 (1.00) |
| 17q loss | 16 (11%) | 134 |
0.133 (1.00) |
0.0334 (1.00) |
0.726 (1.00) |
0.492 (1.00) |
1 (1.00) |
0.585 (1.00) |
0.732 (1.00) |
0.759 (1.00) |
0.00332 (1.00) |
| 18p loss | 28 (19%) | 122 |
0.642 (1.00) |
0.465 (1.00) |
0.0923 (1.00) |
0.171 (1.00) |
0.778 (1.00) |
0.583 (1.00) |
0.258 (1.00) |
0.761 (1.00) |
0.0359 (1.00) |
| 18q loss | 38 (25%) | 112 |
0.399 (1.00) |
0.89 (1.00) |
0.449 (1.00) |
0.0249 (1.00) |
0.45 (1.00) |
0.057 (1.00) |
0.802 (1.00) |
0.756 (1.00) |
0.723 (1.00) |
| 19p loss | 25 (17%) | 125 |
0.127 (1.00) |
0.821 (1.00) |
0.754 (1.00) |
0.0325 (1.00) |
1 (1.00) |
0.828 (1.00) |
0.375 (1.00) |
0.602 (1.00) |
0.851 (1.00) |
| 19q loss | 12 (8%) | 138 |
0.778 (1.00) |
0.43 (1.00) |
1 (1.00) |
0.267 (1.00) |
0.789 (1.00) |
0.627 (1.00) |
0.116 (1.00) |
0.629 (1.00) |
|
| 20p loss | 10 (7%) | 140 |
0.709 (1.00) |
0.143 (1.00) |
1 (1.00) |
1 (1.00) |
0.776 (1.00) |
0.901 (1.00) |
0.215 (1.00) |
0.0196 (1.00) |
0.0278 (1.00) |
| 20q loss | 4 (3%) | 146 |
0.226 (1.00) |
0.0833 (1.00) |
1 (1.00) |
1 (1.00) |
1 (1.00) |
0.955 (1.00) |
1 (1.00) |
0.85 (1.00) |
|
| 21q loss | 20 (13%) | 130 |
0.223 (1.00) |
0.913 (1.00) |
0.382 (1.00) |
0.775 (1.00) |
0.352 (1.00) |
0.552 (1.00) |
1 (1.00) |
0.417 (1.00) |
|
| 22q loss | 30 (20%) | 120 |
0.325 (1.00) |
0.4 (1.00) |
1 (1.00) |
1 (1.00) |
1 (1.00) |
0.321 (1.00) |
0.108 (1.00) |
0.809 (1.00) |
0.534 (1.00) |
| xq loss | 31 (21%) | 119 |
0.0693 (1.00) |
0.882 (1.00) |
0.449 (1.00) |
0.807 (1.00) |
0.651 (1.00) |
0.541 (1.00) |
0.601 (1.00) |
0.989 (1.00) |
0.638 (1.00) |
P value = 2.9e-05 (t-test), Q value = 0.02
Table S1. Gene #43: '2p loss' versus Clinical Feature #9: 'NUMBER.OF.LYMPH.NODES'
| nPatients | Mean (Std.Dev) | |
|---|---|---|
| ALL | 93 | 1.1 (2.3) |
| 2P LOSS MUTATED | 4 | 0.0 (0.0) |
| 2P LOSS WILD-TYPE | 89 | 1.1 (2.4) |
Figure S1. Get High-res Image Gene #43: '2p loss' versus Clinical Feature #9: 'NUMBER.OF.LYMPH.NODES'
P value = 0.000101 (Chi-square test), Q value = 0.069
Table S2. Gene #69: '16q loss' versus Clinical Feature #6: 'HISTOLOGICAL.TYPE'
| nPatients | ADENOSQUAMOUS | CERVICAL SQUAMOUS CELL CARCINOMA | ENDOCERVICAL ADENOCARCINOMA OF THE USUAL TYPE | ENDOCERVICAL TYPE OF ADENOCARCINOMA | ENDOMETRIOID ADENOCARCINOMA OF ENDOCERVIX | MUCINOUS ADENOCARCINOMA OF ENDOCERVICAL TYPE |
|---|---|---|---|---|---|---|
| ALL | 2 | 124 | 4 | 16 | 1 | 3 |
| 16Q LOSS MUTATED | 0 | 11 | 2 | 7 | 1 | 0 |
| 16Q LOSS WILD-TYPE | 2 | 113 | 2 | 9 | 0 | 3 |
Figure S2. Get High-res Image Gene #69: '16q loss' versus Clinical Feature #6: 'HISTOLOGICAL.TYPE'
-
Copy number data file = transformed.cor.cli.txt
-
Clinical data file = CESC-TP.merged_data.txt
-
Number of patients = 150
-
Number of significantly arm-level cnvs = 80
-
Number of selected clinical features = 9
-
Exclude regions that fewer than K tumors have mutations, K = 3
For survival clinical features, the Kaplan-Meier survival curves of tumors with and without gene mutations were plotted and the statistical significance P values were estimated by logrank test (Bland and Altman 2004) using the 'survdiff' function in R
For continuous numerical clinical features, two-tailed Student's t test with unequal variance (Lehmann and Romano 2005) was applied to compare the clinical values between tumors with and without gene mutations using 't.test' function in R
For binary or multi-class clinical features (nominal or ordinal), two-tailed Fisher's exact tests (Fisher 1922) were used to estimate the P values using the 'fisher.test' function in R
For multi-class clinical features (nominal or ordinal), Chi-square tests (Greenwood and Nikulin 1996) were used to estimate the P values using the 'chisq.test' function in R
For multiple hypothesis correction, Q value is the False Discovery Rate (FDR) analogue of the P value (Benjamini and Hochberg 1995), defined as the minimum FDR at which the test may be called significant. We used the 'Benjamini and Hochberg' method of 'p.adjust' function in R to convert P values into Q values.
In addition to the links below, the full results of the analysis summarized in this report can also be downloaded programmatically using firehose_get, or interactively from either the Broad GDAC website or TCGA Data Coordination Center Portal.