This pipeline uses various statistical tests to identify genes whose promoter methylation levels correlated to selected clinical features.
Testing the association between 19998 genes and 9 clinical features across 160 samples, statistically thresholded by Q value < 0.05, 4 clinical features related to at least one genes.
-
1 gene correlated to 'AGE'.
-
RARB
-
62 genes correlated to 'PATHOLOGY.M.STAGE'.
-
DUOX2 , DUOXA2 , TANC1 , LRCH1 , DPYD , ...
-
1940 genes correlated to 'HISTOLOGICAL.TYPE'.
-
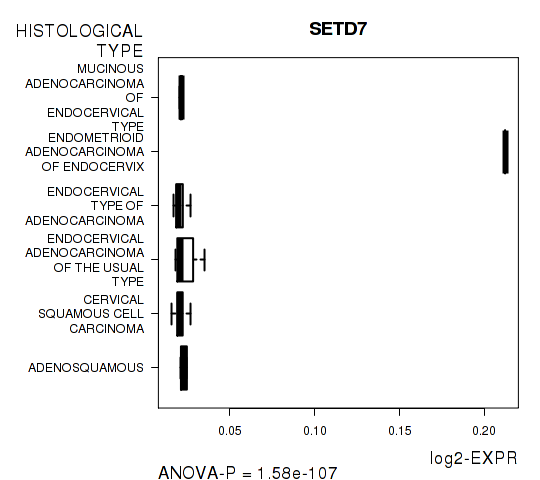
SETD7 , HORMAD1 , CIDEA , ANO6__1 , PLEKHA9 , ...
-
21 genes correlated to 'RADIATIONS.RADIATION.REGIMENINDICATION'.
-
C22ORF26__1 , LOC150381__1 , TMEM160 , CWC22 , C12ORF51 , ...
-
No genes correlated to 'Time to Death', 'PATHOLOGY.T.STAGE', 'PATHOLOGY.N.STAGE', 'NUMBERPACKYEARSSMOKED', and 'NUMBER.OF.LYMPH.NODES'.
Complete statistical result table is provided in Supplement Table 1
Table 1. Get Full Table This table shows the clinical features, statistical methods used, and the number of genes that are significantly associated with each clinical feature at Q value < 0.05.
| Clinical feature | Statistical test | Significant genes | Associated with | Associated with | ||
|---|---|---|---|---|---|---|
| Time to Death | Cox regression test | N=0 | ||||
| AGE | Spearman correlation test | N=1 | older | N=0 | younger | N=1 |
| PATHOLOGY T STAGE | Spearman correlation test | N=0 | ||||
| PATHOLOGY N STAGE | t test | N=0 | ||||
| PATHOLOGY M STAGE | ANOVA test | N=62 | ||||
| HISTOLOGICAL TYPE | ANOVA test | N=1940 | ||||
| RADIATIONS RADIATION REGIMENINDICATION | t test | N=21 | yes | N=7 | no | N=14 |
| NUMBERPACKYEARSSMOKED | Spearman correlation test | N=0 | ||||
| NUMBER OF LYMPH NODES | Spearman correlation test | N=0 |
Table S1. Basic characteristics of clinical feature: 'Time to Death'
| Time to Death | Duration (Months) | 0-177 (median=12.7) |
| censored | N = 121 | |
| death | N = 32 | |
| Significant markers | N = 0 |
Table S2. Basic characteristics of clinical feature: 'AGE'
| AGE | Mean (SD) | 47.79 (13) |
| Significant markers | N = 1 | |
| pos. correlated | 0 | |
| neg. correlated | 1 |
Table S3. Get Full Table List of one gene significantly correlated to 'AGE' by Spearman correlation test
| SpearmanCorr | corrP | Q | |
|---|---|---|---|
| RARB | -0.44 | 6.531e-09 | 0.000131 |
Figure S1. Get High-res Image As an example, this figure shows the association of RARB to 'AGE'. P value = 6.53e-09 with Spearman correlation analysis. The straight line presents the best linear regression.
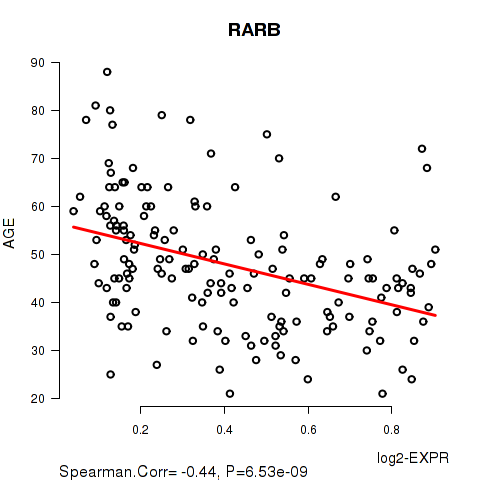
Table S4. Basic characteristics of clinical feature: 'PATHOLOGY.T.STAGE'
| PATHOLOGY.T.STAGE | Mean (SD) | 1.34 (0.6) |
| N | ||
| 1 | 87 | |
| 2 | 31 | |
| 3 | 2 | |
| 4 | 2 | |
| Significant markers | N = 0 |
Table S5. Basic characteristics of clinical feature: 'PATHOLOGY.N.STAGE'
| PATHOLOGY.N.STAGE | Labels | N |
| class0 | 79 | |
| class1 | 39 | |
| Significant markers | N = 0 |
Table S6. Basic characteristics of clinical feature: 'PATHOLOGY.M.STAGE'
| PATHOLOGY.M.STAGE | Labels | N |
| M0 | 68 | |
| M1 | 3 | |
| MX | 55 | |
| Significant markers | N = 62 |
Table S7. Get Full Table List of top 10 genes differentially expressed by 'PATHOLOGY.M.STAGE'
| ANOVA_P | Q | |
|---|---|---|
| DUOX2 | 3.459e-16 | 6.92e-12 |
| DUOXA2 | 3.459e-16 | 6.92e-12 |
| TANC1 | 5.904e-13 | 1.18e-08 |
| LRCH1 | 1.232e-12 | 2.46e-08 |
| DPYD | 4.852e-12 | 9.7e-08 |
| C17ORF75 | 2.104e-11 | 4.21e-07 |
| NEK9 | 2.325e-11 | 4.65e-07 |
| FIGNL1 | 4.248e-11 | 8.49e-07 |
| SERHL2 | 1.141e-10 | 2.28e-06 |
| HSPA1A__1 | 1.796e-10 | 3.59e-06 |
Figure S2. Get High-res Image As an example, this figure shows the association of DUOX2 to 'PATHOLOGY.M.STAGE'. P value = 3.46e-16 with ANOVA analysis.

Table S8. Basic characteristics of clinical feature: 'HISTOLOGICAL.TYPE'
| HISTOLOGICAL.TYPE | Labels | N |
| ADENOSQUAMOUS | 2 | |
| CERVICAL SQUAMOUS CELL CARCINOMA | 134 | |
| ENDOCERVICAL ADENOCARCINOMA OF THE USUAL TYPE | 4 | |
| ENDOCERVICAL TYPE OF ADENOCARCINOMA | 16 | |
| ENDOMETRIOID ADENOCARCINOMA OF ENDOCERVIX | 1 | |
| MUCINOUS ADENOCARCINOMA OF ENDOCERVICAL TYPE | 3 | |
| Significant markers | N = 1940 |
Table S9. Get Full Table List of top 10 genes differentially expressed by 'HISTOLOGICAL.TYPE'
| ANOVA_P | Q | |
|---|---|---|
| SETD7 | 1.577e-107 | 3.15e-103 |
| HORMAD1 | 4.041e-99 | 8.08e-95 |
| CIDEA | 6.654e-90 | 1.33e-85 |
| ANO6__1 | 2.209e-86 | 4.42e-82 |
| PLEKHA9 | 2.209e-86 | 4.42e-82 |
| PACS1 | 7.271e-68 | 1.45e-63 |
| FAM71D | 8.693e-54 | 1.74e-49 |
| PTGIR | 6.31e-46 | 1.26e-41 |
| ATP10D | 3.279e-45 | 6.55e-41 |
| CYP27C1 | 1.963e-42 | 3.92e-38 |
Figure S3. Get High-res Image As an example, this figure shows the association of SETD7 to 'HISTOLOGICAL.TYPE'. P value = 1.58e-107 with ANOVA analysis.
21 genes related to 'RADIATIONS.RADIATION.REGIMENINDICATION'.
Table S10. Basic characteristics of clinical feature: 'RADIATIONS.RADIATION.REGIMENINDICATION'
| RADIATIONS.RADIATION.REGIMENINDICATION | Labels | N |
| NO | 30 | |
| YES | 130 | |
| Significant markers | N = 21 | |
| Higher in YES | 7 | |
| Higher in NO | 14 |
Table S11. Get Full Table List of top 10 genes differentially expressed by 'RADIATIONS.RADIATION.REGIMENINDICATION'
| T(pos if higher in 'YES') | ttestP | Q | AUC | |
|---|---|---|---|---|
| C22ORF26__1 | -6.89 | 1.057e-08 | 0.000211 | 0.8333 |
| LOC150381__1 | -6.89 | 1.057e-08 | 0.000211 | 0.8333 |
| TMEM160 | 6.05 | 1.576e-08 | 0.000315 | 0.7472 |
| CWC22 | 5.88 | 2.475e-08 | 0.000495 | 0.7792 |
| C12ORF51 | -6.05 | 2.809e-08 | 0.000562 | 0.7764 |
| ANKRD5 | 5.87 | 3.229e-08 | 0.000646 | 0.7564 |
| ZFP91__1 | 6.13 | 3.266e-08 | 0.000653 | 0.7778 |
| ZFP91-CNTF__2 | 6.13 | 3.266e-08 | 0.000653 | 0.7778 |
| ZYG11B | -6.11 | 2.092e-07 | 0.00418 | 0.8023 |
| BTC | -6.18 | 2.172e-07 | 0.00434 | 0.8372 |
Figure S4. Get High-res Image As an example, this figure shows the association of C22ORF26__1 to 'RADIATIONS.RADIATION.REGIMENINDICATION'. P value = 1.06e-08 with T-test analysis.

Table S12. Basic characteristics of clinical feature: 'NUMBERPACKYEARSSMOKED'
| NUMBERPACKYEARSSMOKED | Mean (SD) | 18.44 (12) |
| Significant markers | N = 0 |
-
Expresson data file = CESC-TP.meth.by_min_clin_corr.data.txt
-
Clinical data file = CESC-TP.merged_data.txt
-
Number of patients = 160
-
Number of genes = 19998
-
Number of clinical features = 9
For survival clinical features, Wald's test in univariate Cox regression analysis with proportional hazards model (Andersen and Gill 1982) was used to estimate the P values using the 'coxph' function in R. Kaplan-Meier survival curves were plot using the four quartile subgroups of patients based on expression levels
For continuous numerical clinical features, Spearman's rank correlation coefficients (Spearman 1904) and two-tailed P values were estimated using 'cor.test' function in R
For two-class clinical features, two-tailed Student's t test with unequal variance (Lehmann and Romano 2005) was applied to compare the log2-expression levels between the two clinical classes using 't.test' function in R
For multi-class clinical features (ordinal or nominal), one-way analysis of variance (Howell 2002) was applied to compare the log2-expression levels between different clinical classes using 'anova' function in R
For multiple hypothesis correction, Q value is the False Discovery Rate (FDR) analogue of the P value (Benjamini and Hochberg 1995), defined as the minimum FDR at which the test may be called significant. We used the 'Benjamini and Hochberg' method of 'p.adjust' function in R to convert P values into Q values.
In addition to the links below, the full results of the analysis summarized in this report can also be downloaded programmatically using firehose_get, or interactively from either the Broad GDAC website or TCGA Data Coordination Center Portal.