This pipeline uses various statistical tests to identify mRNAs whose expression levels correlated to selected clinical features.
Testing the association between 18196 genes and 9 clinical features across 146 samples, statistically thresholded by Q value < 0.05, 4 clinical features related to at least one genes.
-
2 genes correlated to 'AGE'.
-
NXNL2|158046 , RRAGD|58528
-
1 gene correlated to 'PATHOLOGY.N.STAGE'.
-
ART3|419
-
22 genes correlated to 'PATHOLOGY.M.STAGE'.
-
ARF1|375 , ELP3|55140 , HOXA4|3201 , FERMT1|55612 , CBX3|11335 , ...
-
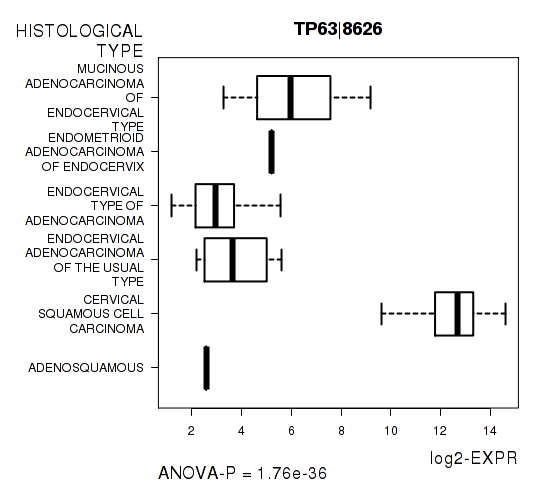
1331 genes correlated to 'HISTOLOGICAL.TYPE'.
-
TP63|8626 , GPR87|53836 , DNALI1|7802 , CLCA2|9635 , HNF1A|6927 , ...
-
No genes correlated to 'Time to Death', 'PATHOLOGY.T.STAGE', 'RADIATIONS.RADIATION.REGIMENINDICATION', 'NUMBERPACKYEARSSMOKED', and 'NUMBER.OF.LYMPH.NODES'.
Complete statistical result table is provided in Supplement Table 1
Table 1. Get Full Table This table shows the clinical features, statistical methods used, and the number of genes that are significantly associated with each clinical feature at Q value < 0.05.
| Clinical feature | Statistical test | Significant genes | Associated with | Associated with | ||
|---|---|---|---|---|---|---|
| Time to Death | Cox regression test | N=0 | ||||
| AGE | Spearman correlation test | N=2 | older | N=1 | younger | N=1 |
| PATHOLOGY T STAGE | Spearman correlation test | N=0 | ||||
| PATHOLOGY N STAGE | t test | N=1 | class1 | N=0 | class0 | N=1 |
| PATHOLOGY M STAGE | ANOVA test | N=22 | ||||
| HISTOLOGICAL TYPE | ANOVA test | N=1331 | ||||
| RADIATIONS RADIATION REGIMENINDICATION | t test | N=0 | ||||
| NUMBERPACKYEARSSMOKED | Spearman correlation test | N=0 | ||||
| NUMBER OF LYMPH NODES | Spearman correlation test | N=0 |
Table S1. Basic characteristics of clinical feature: 'Time to Death'
| Time to Death | Duration (Months) | 0-177 (median=12.7) |
| censored | N = 115 | |
| death | N = 24 | |
| Significant markers | N = 0 |
Table S2. Basic characteristics of clinical feature: 'AGE'
| AGE | Mean (SD) | 47.52 (13) |
| Significant markers | N = 2 | |
| pos. correlated | 1 | |
| neg. correlated | 1 |
Table S3. Get Full Table List of 2 genes significantly correlated to 'AGE' by Spearman correlation test
| SpearmanCorr | corrP | Q | |
|---|---|---|---|
| NXNL2|158046 | -0.4137 | 6.141e-07 | 0.0112 |
| RRAGD|58528 | 0.379 | 2.589e-06 | 0.0471 |
Figure S1. Get High-res Image As an example, this figure shows the association of NXNL2|158046 to 'AGE'. P value = 6.14e-07 with Spearman correlation analysis. The straight line presents the best linear regression.

Table S4. Basic characteristics of clinical feature: 'PATHOLOGY.T.STAGE'
| PATHOLOGY.T.STAGE | Mean (SD) | 1.32 (0.56) |
| N | ||
| 1 | 79 | |
| 2 | 29 | |
| 3 | 2 | |
| 4 | 1 | |
| Significant markers | N = 0 |
Table S5. Basic characteristics of clinical feature: 'PATHOLOGY.N.STAGE'
| PATHOLOGY.N.STAGE | Labels | N |
| class0 | 71 | |
| class1 | 36 | |
| Significant markers | N = 1 | |
| Higher in class1 | 0 | |
| Higher in class0 | 1 |
Table S6. Get Full Table List of one gene differentially expressed by 'PATHOLOGY.N.STAGE'
| T(pos if higher in 'class1') | ttestP | Q | AUC | |
|---|---|---|---|---|
| ART3|419 | -5.06 | 2.703e-06 | 0.0492 | 0.7683 |
Figure S2. Get High-res Image As an example, this figure shows the association of ART3|419 to 'PATHOLOGY.N.STAGE'. P value = 2.7e-06 with T-test analysis.
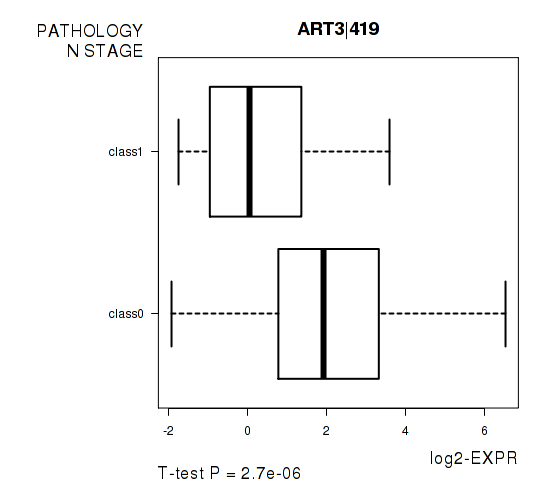
Table S7. Basic characteristics of clinical feature: 'PATHOLOGY.M.STAGE'
| PATHOLOGY.M.STAGE | Labels | N |
| M0 | 62 | |
| M1 | 3 | |
| MX | 50 | |
| Significant markers | N = 22 |
Table S8. Get Full Table List of top 10 genes differentially expressed by 'PATHOLOGY.M.STAGE'
| ANOVA_P | Q | |
|---|---|---|
| ARF1|375 | 3.524e-10 | 6.41e-06 |
| ELP3|55140 | 7.643e-10 | 1.39e-05 |
| HOXA4|3201 | 9.333e-10 | 1.7e-05 |
| FERMT1|55612 | 2.409e-09 | 4.38e-05 |
| CBX3|11335 | 2.653e-09 | 4.83e-05 |
| PKD1L3|342372 | 2.241e-08 | 0.000408 |
| PZP|5858 | 1.307e-07 | 0.00238 |
| TRIM29|23650 | 1.367e-07 | 0.00249 |
| MC4R|4160 | 2.665e-07 | 0.00485 |
| SSR2|6746 | 2.776e-07 | 0.00505 |
Figure S3. Get High-res Image As an example, this figure shows the association of ARF1|375 to 'PATHOLOGY.M.STAGE'. P value = 3.52e-10 with ANOVA analysis.

Table S9. Basic characteristics of clinical feature: 'HISTOLOGICAL.TYPE'
| HISTOLOGICAL.TYPE | Labels | N |
| ADENOSQUAMOUS | 1 | |
| CERVICAL SQUAMOUS CELL CARCINOMA | 122 | |
| ENDOCERVICAL ADENOCARCINOMA OF THE USUAL TYPE | 4 | |
| ENDOCERVICAL TYPE OF ADENOCARCINOMA | 15 | |
| ENDOMETRIOID ADENOCARCINOMA OF ENDOCERVIX | 1 | |
| MUCINOUS ADENOCARCINOMA OF ENDOCERVICAL TYPE | 3 | |
| Significant markers | N = 1331 |
Table S10. Get Full Table List of top 10 genes differentially expressed by 'HISTOLOGICAL.TYPE'
| ANOVA_P | Q | |
|---|---|---|
| TP63|8626 | 1.757e-36 | 3.2e-32 |
| GPR87|53836 | 4.724e-32 | 8.59e-28 |
| DNALI1|7802 | 4.82e-28 | 8.77e-24 |
| CLCA2|9635 | 1.006e-26 | 1.83e-22 |
| HNF1A|6927 | 1.248e-26 | 2.27e-22 |
| LOC642587|642587 | 3.698e-25 | 6.73e-21 |
| PKP1|5317 | 3.7e-25 | 6.73e-21 |
| GPR109A|338442 | 7.438e-25 | 1.35e-20 |
| CALML3|810 | 8.36e-25 | 1.52e-20 |
| HOXD11|3237 | 1.239e-24 | 2.25e-20 |
Figure S4. Get High-res Image As an example, this figure shows the association of TP63|8626 to 'HISTOLOGICAL.TYPE'. P value = 1.76e-36 with ANOVA analysis.
No gene related to 'RADIATIONS.RADIATION.REGIMENINDICATION'.
Table S11. Basic characteristics of clinical feature: 'RADIATIONS.RADIATION.REGIMENINDICATION'
| RADIATIONS.RADIATION.REGIMENINDICATION | Labels | N |
| NO | 28 | |
| YES | 118 | |
| Significant markers | N = 0 |
Table S12. Basic characteristics of clinical feature: 'NUMBERPACKYEARSSMOKED'
| NUMBERPACKYEARSSMOKED | Mean (SD) | 18.83 (11) |
| Significant markers | N = 0 |
-
Expresson data file = CESC-TP.uncv2.mRNAseq_RSEM_normalized_log2.txt
-
Clinical data file = CESC-TP.merged_data.txt
-
Number of patients = 146
-
Number of genes = 18196
-
Number of clinical features = 9
For survival clinical features, Wald's test in univariate Cox regression analysis with proportional hazards model (Andersen and Gill 1982) was used to estimate the P values using the 'coxph' function in R. Kaplan-Meier survival curves were plot using the four quartile subgroups of patients based on expression levels
For continuous numerical clinical features, Spearman's rank correlation coefficients (Spearman 1904) and two-tailed P values were estimated using 'cor.test' function in R
For two-class clinical features, two-tailed Student's t test with unequal variance (Lehmann and Romano 2005) was applied to compare the log2-expression levels between the two clinical classes using 't.test' function in R
For multi-class clinical features (ordinal or nominal), one-way analysis of variance (Howell 2002) was applied to compare the log2-expression levels between different clinical classes using 'anova' function in R
For multiple hypothesis correction, Q value is the False Discovery Rate (FDR) analogue of the P value (Benjamini and Hochberg 1995), defined as the minimum FDR at which the test may be called significant. We used the 'Benjamini and Hochberg' method of 'p.adjust' function in R to convert P values into Q values.
In addition to the links below, the full results of the analysis summarized in this report can also be downloaded programmatically using firehose_get, or interactively from either the Broad GDAC website or TCGA Data Coordination Center Portal.