This pipeline computes the correlation between significant arm-level copy number variations (cnvs) and selected clinical features.
Testing the association between copy number variation 80 arm-level events and 6 clinical features across 560 patients, 10 significant findings detected with Q value < 0.25.
-
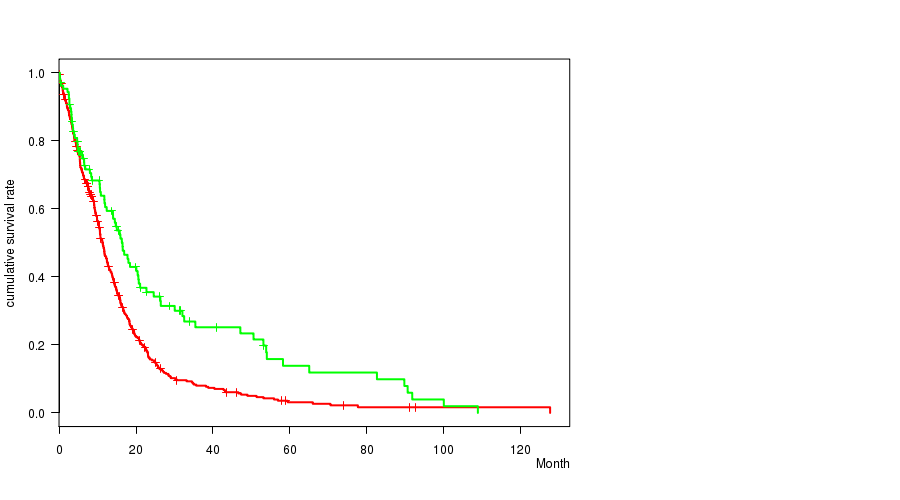
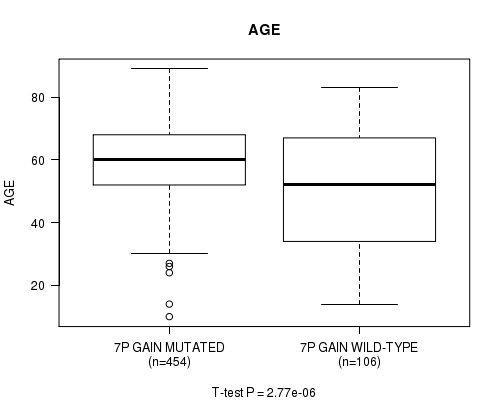
7p gain cnv correlated to 'Time to Death' and 'AGE'.
-
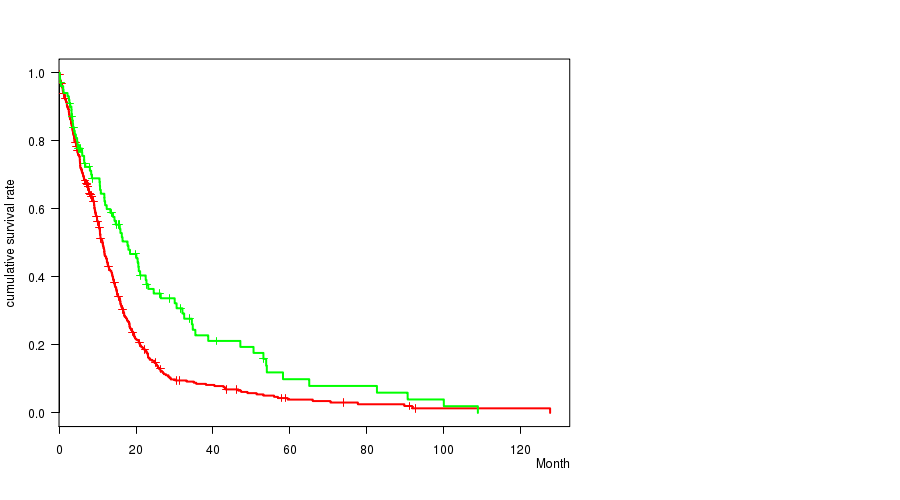
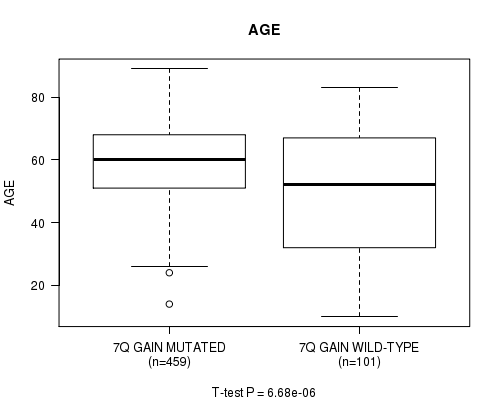
7q gain cnv correlated to 'Time to Death' and 'AGE'.
-
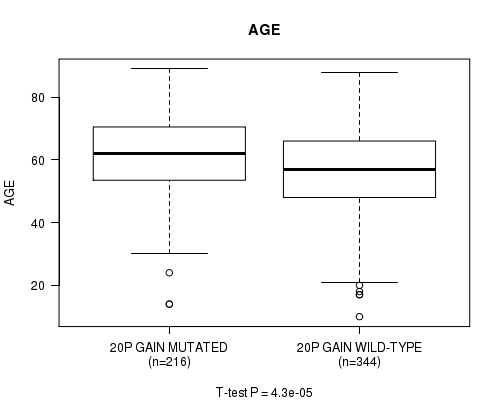
20p gain cnv correlated to 'AGE'.
-
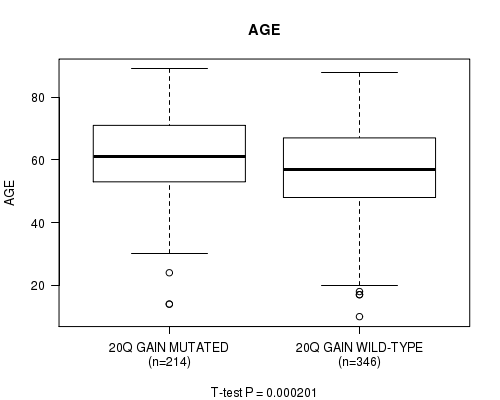
20q gain cnv correlated to 'AGE'.
-
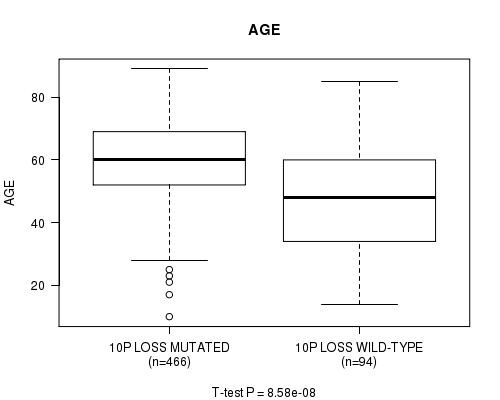
10p loss cnv correlated to 'Time to Death' and 'AGE'.
-
10q loss cnv correlated to 'Time to Death' and 'AGE'.
Table 1. Get Full Table Overview of the association between significant copy number variation of 80 arm-level events and 6 clinical features. Shown in the table are P values (Q values). Thresholded by Q value < 0.25, 10 significant findings detected.
|
Clinical Features |
Time to Death |
AGE | GENDER |
KARNOFSKY PERFORMANCE SCORE |
HISTOLOGICAL TYPE |
RADIATIONS RADIATION REGIMENINDICATION |
||
| nCNV (%) | nWild-Type | logrank test | t-test | Fisher's exact test | t-test | Fisher's exact test | Fisher's exact test | |
| 7p gain | 454 (81%) | 106 |
0.000102 (0.0482) |
2.77e-06 (0.00132) |
1 (1.00) |
0.68 (1.00) |
0.0153 (1.00) |
0.133 (1.00) |
| 7q gain | 459 (82%) | 101 |
0.000175 (0.0822) |
6.68e-06 (0.00318) |
0.368 (1.00) |
0.88 (1.00) |
0.0257 (1.00) |
0.0995 (1.00) |
| 10p loss | 466 (83%) | 94 |
2.14e-05 (0.0102) |
8.58e-08 (4.11e-05) |
0.249 (1.00) |
0.0969 (1.00) |
0.00275 (1.00) |
0.716 (1.00) |
| 10q loss | 478 (85%) | 82 |
6.6e-05 (0.0312) |
5.1e-07 (0.000244) |
0.541 (1.00) |
0.00225 (1.00) |
0.0118 (1.00) |
0.61 (1.00) |
| 20p gain | 216 (39%) | 344 |
0.567 (1.00) |
4.3e-05 (0.0204) |
0.287 (1.00) |
0.481 (1.00) |
0.496 (1.00) |
0.515 (1.00) |
| 20q gain | 214 (38%) | 346 |
0.836 (1.00) |
0.000201 (0.0945) |
0.247 (1.00) |
0.616 (1.00) |
0.476 (1.00) |
0.513 (1.00) |
| 1p gain | 81 (14%) | 479 |
0.232 (1.00) |
0.588 (1.00) |
0.624 (1.00) |
0.307 (1.00) |
0.144 (1.00) |
0.368 (1.00) |
| 1q gain | 87 (16%) | 473 |
0.569 (1.00) |
0.864 (1.00) |
0.403 (1.00) |
0.332 (1.00) |
0.201 (1.00) |
0.383 (1.00) |
| 2p gain | 36 (6%) | 524 |
0.688 (1.00) |
0.891 (1.00) |
0.111 (1.00) |
0.496 (1.00) |
1 (1.00) |
0.854 (1.00) |
| 2q gain | 35 (6%) | 525 |
0.572 (1.00) |
0.651 (1.00) |
0.284 (1.00) |
0.363 (1.00) |
1 (1.00) |
1 (1.00) |
| 3p gain | 56 (10%) | 504 |
0.97 (1.00) |
0.0192 (1.00) |
0.391 (1.00) |
0.699 (1.00) |
0.495 (1.00) |
1 (1.00) |
| 3q gain | 61 (11%) | 499 |
0.941 (1.00) |
0.0483 (1.00) |
0.581 (1.00) |
0.626 (1.00) |
0.417 (1.00) |
0.772 (1.00) |
| 4p gain | 36 (6%) | 524 |
0.915 (1.00) |
0.276 (1.00) |
0.86 (1.00) |
0.093 (1.00) |
1 (1.00) |
0.712 (1.00) |
| 4q gain | 33 (6%) | 527 |
0.953 (1.00) |
0.385 (1.00) |
0.467 (1.00) |
0.077 (1.00) |
1 (1.00) |
0.441 (1.00) |
| 5p gain | 49 (9%) | 511 |
0.843 (1.00) |
0.556 (1.00) |
0.168 (1.00) |
0.202 (1.00) |
0.0389 (1.00) |
0.633 (1.00) |
| 5q gain | 41 (7%) | 519 |
0.675 (1.00) |
0.527 (1.00) |
0.134 (1.00) |
0.696 (1.00) |
0.0529 (1.00) |
0.49 (1.00) |
| 6p gain | 23 (4%) | 537 |
0.432 (1.00) |
0.56 (1.00) |
0.514 (1.00) |
0.501 (1.00) |
1 (1.00) |
0.171 (1.00) |
| 6q gain | 22 (4%) | 538 |
0.377 (1.00) |
0.293 (1.00) |
0.828 (1.00) |
0.452 (1.00) |
1 (1.00) |
0.485 (1.00) |
| 8p gain | 52 (9%) | 508 |
0.709 (1.00) |
0.512 (1.00) |
0.657 (1.00) |
0.749 (1.00) |
0.894 (1.00) |
0.642 (1.00) |
| 8q gain | 59 (11%) | 501 |
0.56 (1.00) |
0.154 (1.00) |
0.481 (1.00) |
0.862 (1.00) |
0.912 (1.00) |
1 (1.00) |
| 9p gain | 47 (8%) | 513 |
0.643 (1.00) |
0.83 (1.00) |
0.163 (1.00) |
0.932 (1.00) |
0.317 (1.00) |
0.745 (1.00) |
| 9q gain | 71 (13%) | 489 |
0.751 (1.00) |
0.941 (1.00) |
0.195 (1.00) |
0.615 (1.00) |
0.602 (1.00) |
1 (1.00) |
| 10p gain | 12 (2%) | 548 |
0.00406 (1.00) |
0.00256 (1.00) |
0.0706 (1.00) |
0.00059 (0.277) |
0.543 (1.00) |
1 (1.00) |
| 10q gain | 3 (1%) | 557 |
0.478 (1.00) |
0.906 (1.00) |
0.564 (1.00) |
1 (1.00) |
0.238 (1.00) |
|
| 11p gain | 17 (3%) | 543 |
0.434 (1.00) |
0.752 (1.00) |
0.806 (1.00) |
0.505 (1.00) |
1 (1.00) |
0.601 (1.00) |
| 11q gain | 14 (2%) | 546 |
0.145 (1.00) |
0.136 (1.00) |
0.267 (1.00) |
0.134 (1.00) |
0.599 (1.00) |
0.244 (1.00) |
| 12p gain | 58 (10%) | 502 |
0.518 (1.00) |
0.188 (1.00) |
0.571 (1.00) |
0.496 (1.00) |
0.911 (1.00) |
0.552 (1.00) |
| 12q gain | 47 (8%) | 513 |
0.869 (1.00) |
0.561 (1.00) |
0.278 (1.00) |
0.771 (1.00) |
0.548 (1.00) |
0.624 (1.00) |
| 13q gain | 10 (2%) | 550 |
0.541 (1.00) |
0.00986 (1.00) |
0.202 (1.00) |
0.0914 (1.00) |
0.296 (1.00) |
0.0811 (1.00) |
| 14q gain | 22 (4%) | 538 |
0.264 (1.00) |
0.145 (1.00) |
0.513 (1.00) |
0.44 (1.00) |
0.0532 (1.00) |
0.645 (1.00) |
| 15q gain | 24 (4%) | 536 |
0.504 (1.00) |
0.985 (1.00) |
0.527 (1.00) |
0.0908 (1.00) |
0.451 (1.00) |
0.177 (1.00) |
| 16p gain | 38 (7%) | 522 |
0.0309 (1.00) |
0.65 (1.00) |
0.306 (1.00) |
0.746 (1.00) |
1 (1.00) |
0.0726 (1.00) |
| 16q gain | 37 (7%) | 523 |
0.117 (1.00) |
0.59 (1.00) |
0.606 (1.00) |
0.972 (1.00) |
1 (1.00) |
0.0999 (1.00) |
| 17p gain | 47 (8%) | 513 |
0.311 (1.00) |
0.0899 (1.00) |
0.212 (1.00) |
0.594 (1.00) |
0.275 (1.00) |
0.329 (1.00) |
| 17q gain | 58 (10%) | 502 |
0.057 (1.00) |
0.0323 (1.00) |
0.479 (1.00) |
0.648 (1.00) |
0.499 (1.00) |
0.299 (1.00) |
| 18p gain | 57 (10%) | 503 |
0.779 (1.00) |
0.797 (1.00) |
0.669 (1.00) |
0.26 (1.00) |
0.174 (1.00) |
0.881 (1.00) |
| 18q gain | 57 (10%) | 503 |
0.93 (1.00) |
0.509 (1.00) |
0.2 (1.00) |
0.242 (1.00) |
0.174 (1.00) |
0.653 (1.00) |
| 19p gain | 218 (39%) | 342 |
0.303 (1.00) |
0.668 (1.00) |
0.859 (1.00) |
0.835 (1.00) |
0.336 (1.00) |
0.71 (1.00) |
| 19q gain | 193 (34%) | 367 |
0.319 (1.00) |
0.215 (1.00) |
0.716 (1.00) |
0.915 (1.00) |
0.922 (1.00) |
0.634 (1.00) |
| 21q gain | 62 (11%) | 498 |
0.488 (1.00) |
0.0459 (1.00) |
1 (1.00) |
0.11 (1.00) |
0.0503 (1.00) |
1 (1.00) |
| 22q gain | 34 (6%) | 526 |
0.433 (1.00) |
0.702 (1.00) |
1 (1.00) |
0.413 (1.00) |
0.601 (1.00) |
1 (1.00) |
| xq gain | 16 (3%) | 544 |
0.923 (1.00) |
0.316 (1.00) |
1 (1.00) |
0.5 (1.00) |
0.264 (1.00) |
0.17 (1.00) |
| 1p loss | 15 (3%) | 545 |
0.277 (1.00) |
0.0299 (1.00) |
0.424 (1.00) |
0.863 (1.00) |
0.625 (1.00) |
0.575 (1.00) |
| 1q loss | 14 (2%) | 546 |
0.525 (1.00) |
0.00349 (1.00) |
1 (1.00) |
0.195 (1.00) |
1 (1.00) |
0.39 (1.00) |
| 2p loss | 32 (6%) | 528 |
0.745 (1.00) |
0.186 (1.00) |
0.135 (1.00) |
0.856 (1.00) |
1 (1.00) |
0.17 (1.00) |
| 2q loss | 32 (6%) | 528 |
0.92 (1.00) |
0.366 (1.00) |
0.263 (1.00) |
0.591 (1.00) |
0.312 (1.00) |
0.0771 (1.00) |
| 3p loss | 40 (7%) | 520 |
0.284 (1.00) |
0.0367 (1.00) |
1 (1.00) |
0.86 (1.00) |
0.287 (1.00) |
0.113 (1.00) |
| 3q loss | 34 (6%) | 526 |
0.755 (1.00) |
0.411 (1.00) |
0.589 (1.00) |
0.82 (1.00) |
0.417 (1.00) |
0.572 (1.00) |
| 4p loss | 53 (9%) | 507 |
0.624 (1.00) |
0.596 (1.00) |
0.184 (1.00) |
0.408 (1.00) |
0.527 (1.00) |
0.643 (1.00) |
| 4q loss | 53 (9%) | 507 |
0.167 (1.00) |
0.122 (1.00) |
0.659 (1.00) |
0.374 (1.00) |
1 (1.00) |
0.643 (1.00) |
| 5p loss | 42 (8%) | 518 |
0.0538 (1.00) |
0.333 (1.00) |
1 (1.00) |
0.757 (1.00) |
0.772 (1.00) |
0.0373 (1.00) |
| 5q loss | 43 (8%) | 517 |
0.104 (1.00) |
0.303 (1.00) |
1 (1.00) |
0.974 (1.00) |
0.325 (1.00) |
0.127 (1.00) |
| 6p loss | 86 (15%) | 474 |
0.00826 (1.00) |
0.43 (1.00) |
0.811 (1.00) |
0.511 (1.00) |
0.571 (1.00) |
0.53 (1.00) |
| 6q loss | 123 (22%) | 437 |
0.304 (1.00) |
0.73 (1.00) |
0.348 (1.00) |
0.489 (1.00) |
0.764 (1.00) |
1 (1.00) |
| 7p loss | 8 (1%) | 552 |
0.351 (1.00) |
0.151 (1.00) |
1 (1.00) |
0.646 (1.00) |
1 (1.00) |
0.446 (1.00) |
| 7q loss | 6 (1%) | 554 |
0.523 (1.00) |
0.0988 (1.00) |
1 (1.00) |
0.227 (1.00) |
1 (1.00) |
0.67 (1.00) |
| 8p loss | 58 (10%) | 502 |
0.74 (1.00) |
0.2 (1.00) |
0.156 (1.00) |
0.744 (1.00) |
0.911 (1.00) |
0.552 (1.00) |
| 8q loss | 42 (8%) | 518 |
0.29 (1.00) |
0.0794 (1.00) |
0.416 (1.00) |
0.452 (1.00) |
1 (1.00) |
1 (1.00) |
| 9p loss | 195 (35%) | 365 |
0.535 (1.00) |
0.558 (1.00) |
0.717 (1.00) |
0.895 (1.00) |
0.546 (1.00) |
0.775 (1.00) |
| 9q loss | 90 (16%) | 470 |
0.415 (1.00) |
0.402 (1.00) |
0.29 (1.00) |
0.461 (1.00) |
0.0949 (1.00) |
1 (1.00) |
| 11p loss | 97 (17%) | 463 |
0.183 (1.00) |
0.651 (1.00) |
0.0861 (1.00) |
0.376 (1.00) |
0.378 (1.00) |
0.632 (1.00) |
| 11q loss | 92 (16%) | 468 |
0.906 (1.00) |
0.455 (1.00) |
0.414 (1.00) |
0.745 (1.00) |
1 (1.00) |
0.271 (1.00) |
| 12p loss | 59 (11%) | 501 |
0.96 (1.00) |
0.646 (1.00) |
0.401 (1.00) |
0.907 (1.00) |
1 (1.00) |
0.66 (1.00) |
| 12q loss | 58 (10%) | 502 |
1 (1.00) |
0.618 (1.00) |
0.479 (1.00) |
0.753 (1.00) |
0.655 (1.00) |
0.882 (1.00) |
| 13q loss | 181 (32%) | 379 |
0.903 (1.00) |
0.681 (1.00) |
0.926 (1.00) |
0.75 (1.00) |
0.552 (1.00) |
0.629 (1.00) |
| 14q loss | 145 (26%) | 415 |
0.919 (1.00) |
0.754 (1.00) |
0.431 (1.00) |
0.666 (1.00) |
0.716 (1.00) |
0.837 (1.00) |
| 15q loss | 101 (18%) | 459 |
0.611 (1.00) |
0.103 (1.00) |
0.5 (1.00) |
0.49 (1.00) |
0.687 (1.00) |
0.0763 (1.00) |
| 16p loss | 63 (11%) | 497 |
0.0654 (1.00) |
0.4 (1.00) |
0.683 (1.00) |
0.945 (1.00) |
0.324 (1.00) |
0.061 (1.00) |
| 16q loss | 82 (15%) | 478 |
0.0239 (1.00) |
0.837 (1.00) |
1 (1.00) |
0.586 (1.00) |
0.643 (1.00) |
0.0286 (1.00) |
| 17p loss | 61 (11%) | 499 |
0.762 (1.00) |
0.492 (1.00) |
0.27 (1.00) |
0.825 (1.00) |
0.749 (1.00) |
0.191 (1.00) |
| 17q loss | 40 (7%) | 520 |
0.994 (1.00) |
0.463 (1.00) |
0.502 (1.00) |
0.468 (1.00) |
1 (1.00) |
0.0339 (1.00) |
| 18p loss | 68 (12%) | 492 |
0.185 (1.00) |
0.731 (1.00) |
0.51 (1.00) |
0.465 (1.00) |
0.771 (1.00) |
1 (1.00) |
| 18q loss | 60 (11%) | 500 |
0.411 (1.00) |
0.783 (1.00) |
0.78 (1.00) |
0.184 (1.00) |
0.746 (1.00) |
0.245 (1.00) |
| 19p loss | 25 (4%) | 535 |
0.44 (1.00) |
0.511 (1.00) |
0.677 (1.00) |
0.841 (1.00) |
0.636 (1.00) |
1 (1.00) |
| 19q loss | 33 (6%) | 527 |
0.523 (1.00) |
0.485 (1.00) |
0.716 (1.00) |
0.558 (1.00) |
0.188 (1.00) |
0.849 (1.00) |
| 20p loss | 18 (3%) | 542 |
0.846 (1.00) |
0.268 (1.00) |
0.219 (1.00) |
0.747 (1.00) |
1 (1.00) |
1 (1.00) |
| 20q loss | 16 (3%) | 544 |
0.755 (1.00) |
0.645 (1.00) |
0.196 (1.00) |
0.873 (1.00) |
1 (1.00) |
0.596 (1.00) |
| 21q loss | 40 (7%) | 520 |
0.989 (1.00) |
0.627 (1.00) |
0.502 (1.00) |
0.194 (1.00) |
0.862 (1.00) |
0.481 (1.00) |
| 22q loss | 178 (32%) | 382 |
0.443 (1.00) |
0.202 (1.00) |
1 (1.00) |
0.493 (1.00) |
0.344 (1.00) |
0.697 (1.00) |
| xq loss | 104 (19%) | 456 |
0.262 (1.00) |
0.391 (1.00) |
0.505 (1.00) |
0.306 (1.00) |
0.835 (1.00) |
0.726 (1.00) |
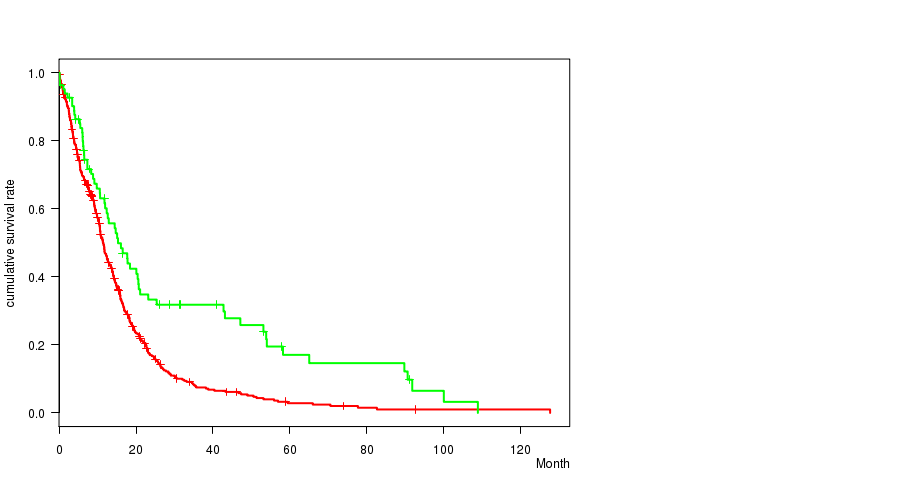
P value = 0.000102 (logrank test), Q value = 0.048
Table S1. Gene #13: '7p gain' versus Clinical Feature #1: 'Time to Death'
| nPatients | nDeath | Duration Range (Median), Month | |
|---|---|---|---|
| ALL | 560 | 458 | 0.1 - 127.6 (9.9) |
| 7P GAIN MUTATED | 454 | 378 | 0.1 - 127.6 (9.6) |
| 7P GAIN WILD-TYPE | 106 | 80 | 0.2 - 108.8 (13.0) |
Figure S1. Get High-res Image Gene #13: '7p gain' versus Clinical Feature #1: 'Time to Death'
P value = 2.77e-06 (t-test), Q value = 0.0013
Table S2. Gene #13: '7p gain' versus Clinical Feature #2: 'AGE'
| nPatients | Mean (Std.Dev) | |
|---|---|---|
| ALL | 560 | 57.9 (14.5) |
| 7P GAIN MUTATED | 454 | 59.7 (12.4) |
| 7P GAIN WILD-TYPE | 106 | 50.1 (19.3) |
Figure S2. Get High-res Image Gene #13: '7p gain' versus Clinical Feature #2: 'AGE'
P value = 0.000175 (logrank test), Q value = 0.082
Table S3. Gene #14: '7q gain' versus Clinical Feature #1: 'Time to Death'
| nPatients | nDeath | Duration Range (Median), Month | |
|---|---|---|---|
| ALL | 560 | 458 | 0.1 - 127.6 (9.9) |
| 7Q GAIN MUTATED | 459 | 380 | 0.1 - 127.6 (9.5) |
| 7Q GAIN WILD-TYPE | 101 | 78 | 0.2 - 108.8 (14.0) |
Figure S3. Get High-res Image Gene #14: '7q gain' versus Clinical Feature #1: 'Time to Death'
P value = 6.68e-06 (t-test), Q value = 0.0032
Table S4. Gene #14: '7q gain' versus Clinical Feature #2: 'AGE'
| nPatients | Mean (Std.Dev) | |
|---|---|---|
| ALL | 560 | 57.9 (14.5) |
| 7Q GAIN MUTATED | 459 | 59.6 (12.3) |
| 7Q GAIN WILD-TYPE | 101 | 49.9 (20.0) |
Figure S4. Get High-res Image Gene #14: '7q gain' versus Clinical Feature #2: 'AGE'
P value = 4.3e-05 (t-test), Q value = 0.02
Table S5. Gene #36: '20p gain' versus Clinical Feature #2: 'AGE'
| nPatients | Mean (Std.Dev) | |
|---|---|---|
| ALL | 560 | 57.9 (14.5) |
| 20P GAIN MUTATED | 216 | 60.9 (13.1) |
| 20P GAIN WILD-TYPE | 344 | 56.0 (15.0) |
Figure S5. Get High-res Image Gene #36: '20p gain' versus Clinical Feature #2: 'AGE'
P value = 0.000201 (t-test), Q value = 0.095
Table S6. Gene #37: '20q gain' versus Clinical Feature #2: 'AGE'
| nPatients | Mean (Std.Dev) | |
|---|---|---|
| ALL | 560 | 57.9 (14.5) |
| 20Q GAIN MUTATED | 214 | 60.7 (13.3) |
| 20Q GAIN WILD-TYPE | 346 | 56.1 (14.9) |
Figure S6. Get High-res Image Gene #37: '20q gain' versus Clinical Feature #2: 'AGE'
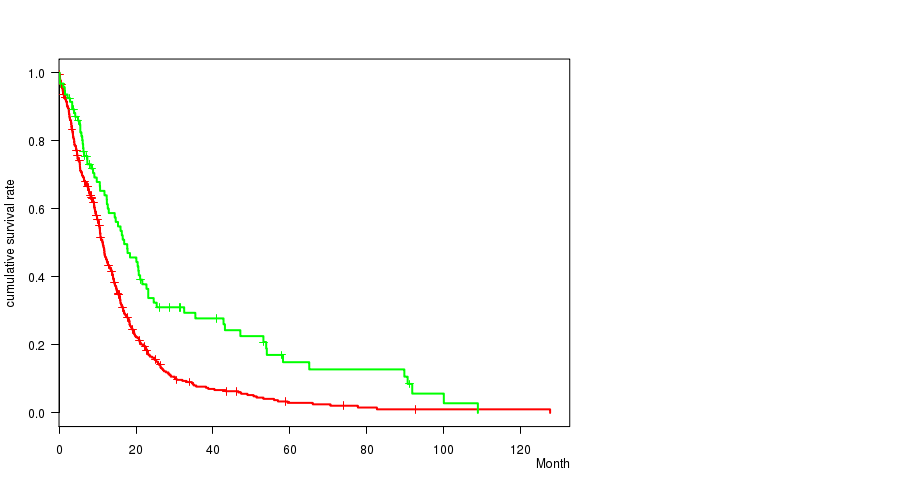
P value = 2.14e-05 (logrank test), Q value = 0.01
Table S7. Gene #59: '10p loss' versus Clinical Feature #1: 'Time to Death'
| nPatients | nDeath | Duration Range (Median), Month | |
|---|---|---|---|
| ALL | 560 | 458 | 0.1 - 127.6 (9.9) |
| 10P LOSS MUTATED | 466 | 387 | 0.1 - 127.6 (9.8) |
| 10P LOSS WILD-TYPE | 94 | 71 | 0.2 - 108.8 (12.5) |
Figure S7. Get High-res Image Gene #59: '10p loss' versus Clinical Feature #1: 'Time to Death'
P value = 8.58e-08 (t-test), Q value = 4.1e-05
Table S8. Gene #59: '10p loss' versus Clinical Feature #2: 'AGE'
| nPatients | Mean (Std.Dev) | |
|---|---|---|
| ALL | 560 | 57.9 (14.5) |
| 10P LOSS MUTATED | 466 | 59.8 (12.6) |
| 10P LOSS WILD-TYPE | 94 | 48.2 (18.7) |
Figure S8. Get High-res Image Gene #59: '10p loss' versus Clinical Feature #2: 'AGE'
P value = 6.6e-05 (logrank test), Q value = 0.031
Table S9. Gene #60: '10q loss' versus Clinical Feature #1: 'Time to Death'
| nPatients | nDeath | Duration Range (Median), Month | |
|---|---|---|---|
| ALL | 560 | 458 | 0.1 - 127.6 (9.9) |
| 10Q LOSS MUTATED | 478 | 396 | 0.1 - 127.6 (9.8) |
| 10Q LOSS WILD-TYPE | 82 | 62 | 0.2 - 108.8 (12.2) |
Figure S9. Get High-res Image Gene #60: '10q loss' versus Clinical Feature #1: 'Time to Death'
P value = 5.1e-07 (t-test), Q value = 0.00024
Table S10. Gene #60: '10q loss' versus Clinical Feature #2: 'AGE'
| nPatients | Mean (Std.Dev) | |
|---|---|---|
| ALL | 560 | 57.9 (14.5) |
| 10Q LOSS MUTATED | 478 | 59.5 (12.9) |
| 10Q LOSS WILD-TYPE | 82 | 48.1 (18.5) |
Figure S10. Get High-res Image Gene #60: '10q loss' versus Clinical Feature #2: 'AGE'

-
Copy number data file = transformed.cor.cli.txt
-
Clinical data file = GBM-TP.merged_data.txt
-
Number of patients = 560
-
Number of significantly arm-level cnvs = 80
-
Number of selected clinical features = 6
-
Exclude regions that fewer than K tumors have mutations, K = 3
For survival clinical features, the Kaplan-Meier survival curves of tumors with and without gene mutations were plotted and the statistical significance P values were estimated by logrank test (Bland and Altman 2004) using the 'survdiff' function in R
For continuous numerical clinical features, two-tailed Student's t test with unequal variance (Lehmann and Romano 2005) was applied to compare the clinical values between tumors with and without gene mutations using 't.test' function in R
For binary or multi-class clinical features (nominal or ordinal), two-tailed Fisher's exact tests (Fisher 1922) were used to estimate the P values using the 'fisher.test' function in R
For multiple hypothesis correction, Q value is the False Discovery Rate (FDR) analogue of the P value (Benjamini and Hochberg 1995), defined as the minimum FDR at which the test may be called significant. We used the 'Benjamini and Hochberg' method of 'p.adjust' function in R to convert P values into Q values.
In addition to the links below, the full results of the analysis summarized in this report can also be downloaded programmatically using firehose_get, or interactively from either the Broad GDAC website or TCGA Data Coordination Center Portal.