This pipeline computes the correlation between significant arm-level copy number variations (cnvs) and selected clinical features.
Testing the association between copy number variation 79 arm-level events and 9 clinical features across 498 patients, 24 significant findings detected with Q value < 0.25.
-
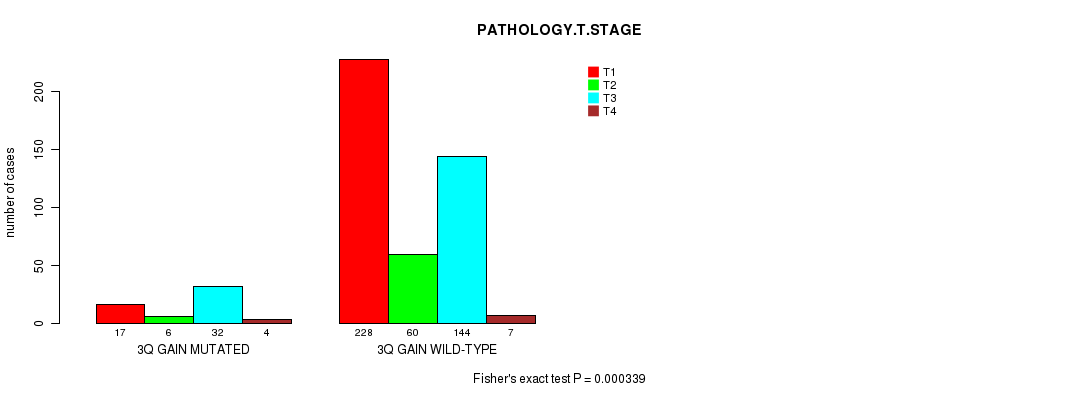
3q gain cnv correlated to 'PATHOLOGY.T.STAGE'.
-
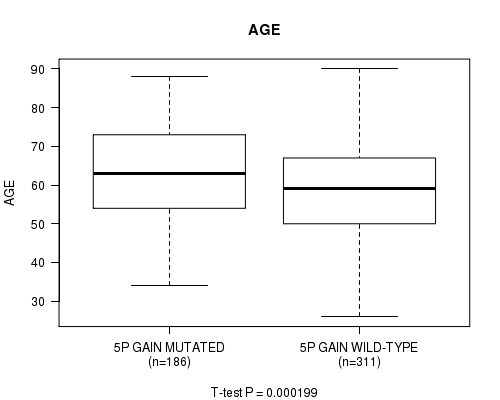
5p gain cnv correlated to 'AGE'.
-
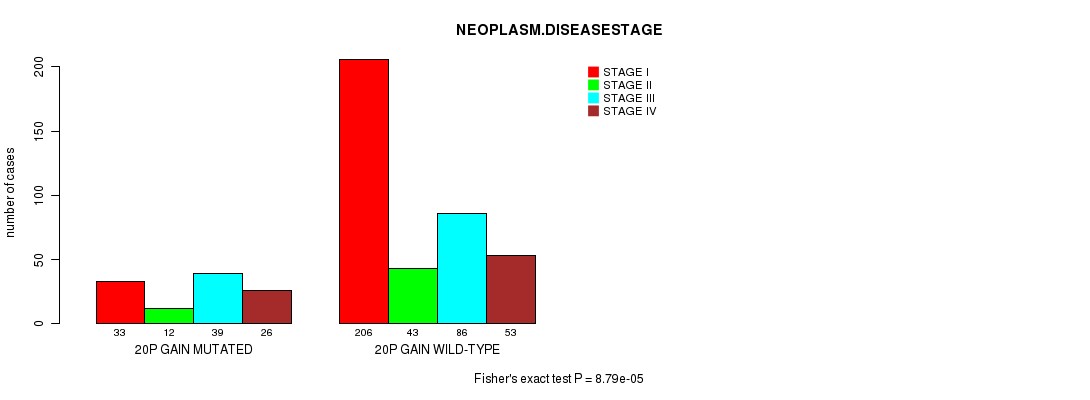
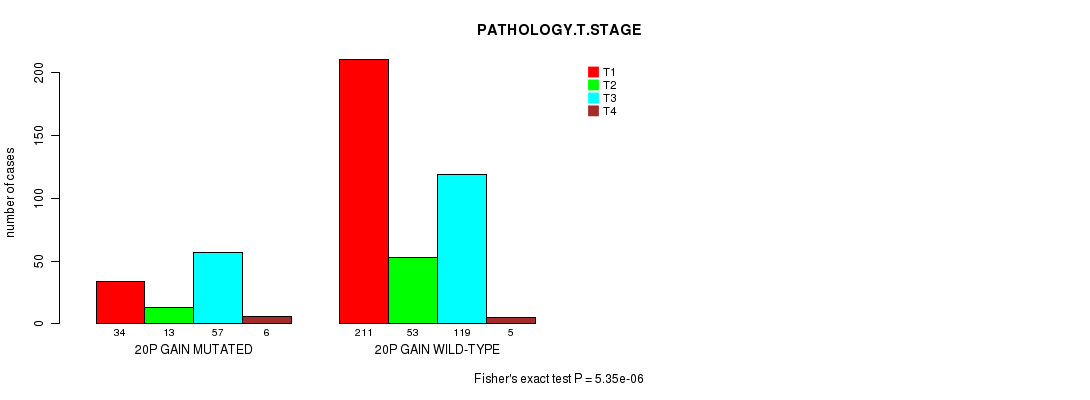
20p gain cnv correlated to 'NEOPLASM.DISEASESTAGE' and 'PATHOLOGY.T.STAGE'.
-
20q gain cnv correlated to 'NEOPLASM.DISEASESTAGE' and 'PATHOLOGY.T.STAGE'.
-
4p loss cnv correlated to 'Time to Death' and 'PATHOLOGY.T.STAGE'.
-
4q loss cnv correlated to 'Time to Death', 'NEOPLASM.DISEASESTAGE', and 'PATHOLOGY.T.STAGE'.
-
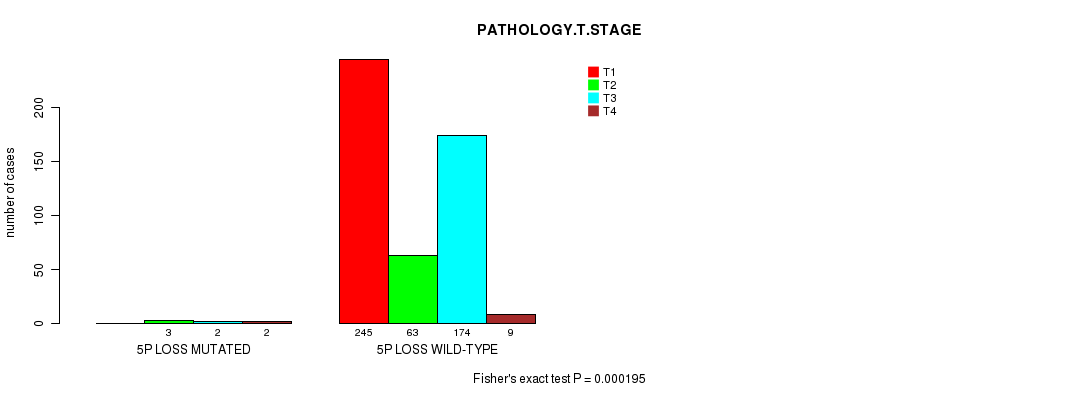
5p loss cnv correlated to 'PATHOLOGY.T.STAGE'.
-
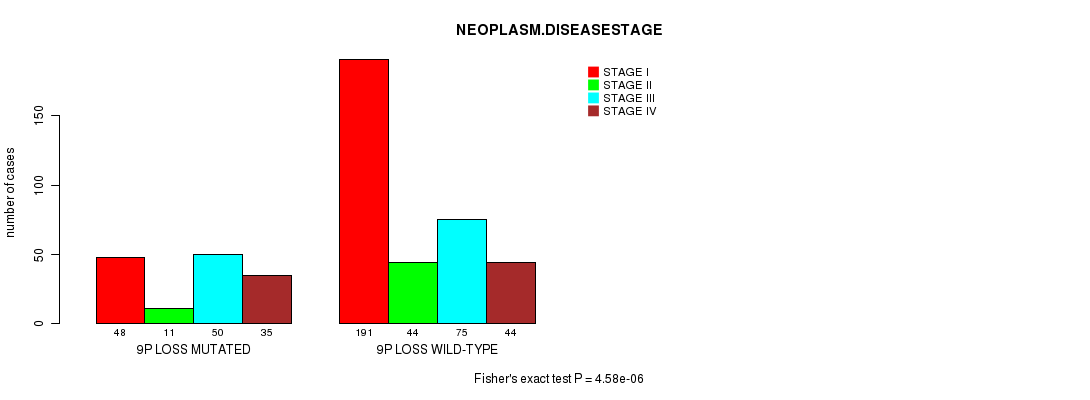
9p loss cnv correlated to 'Time to Death', 'NEOPLASM.DISEASESTAGE', and 'PATHOLOGY.T.STAGE'.
-
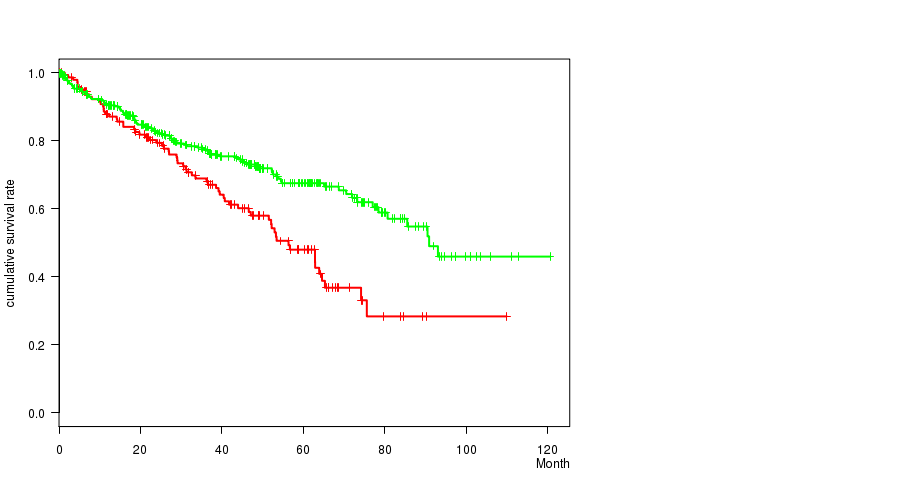
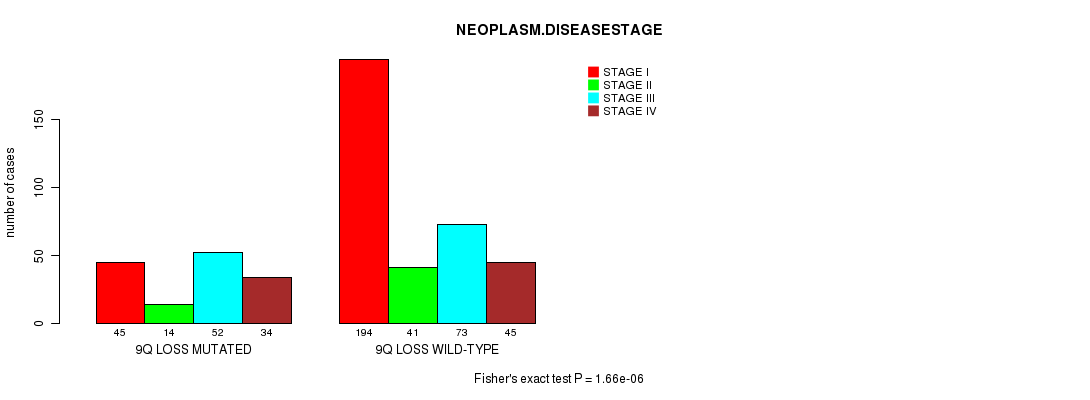
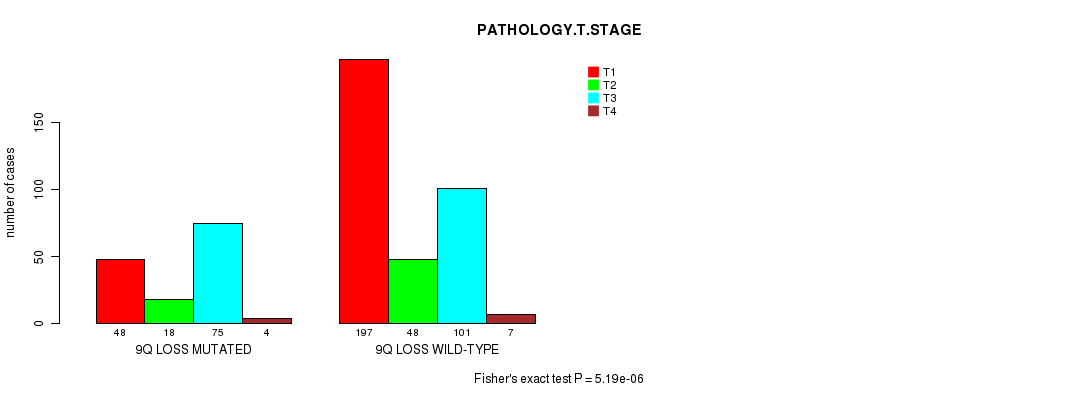
9q loss cnv correlated to 'Time to Death', 'NEOPLASM.DISEASESTAGE', and 'PATHOLOGY.T.STAGE'.
-
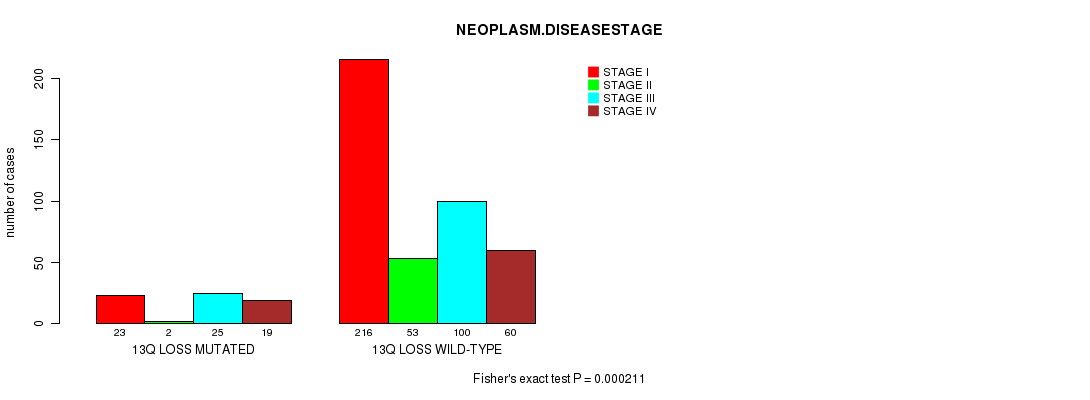
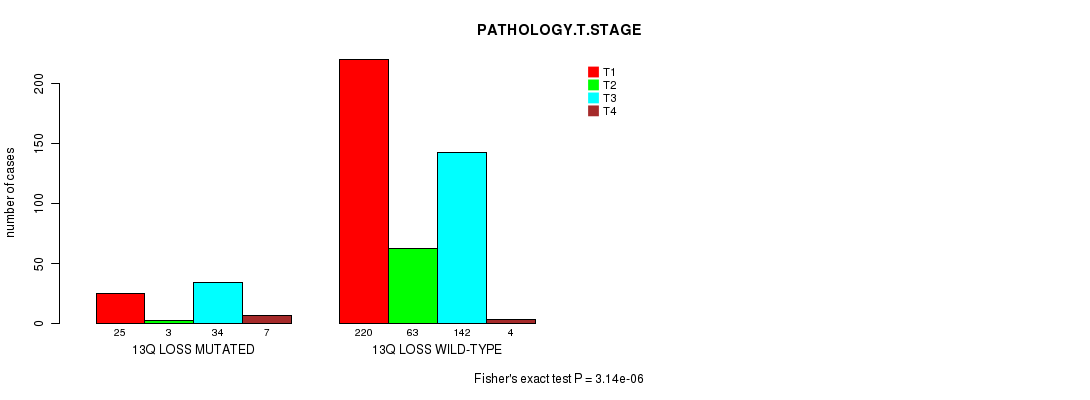
13q loss cnv correlated to 'NEOPLASM.DISEASESTAGE' and 'PATHOLOGY.T.STAGE'.
-
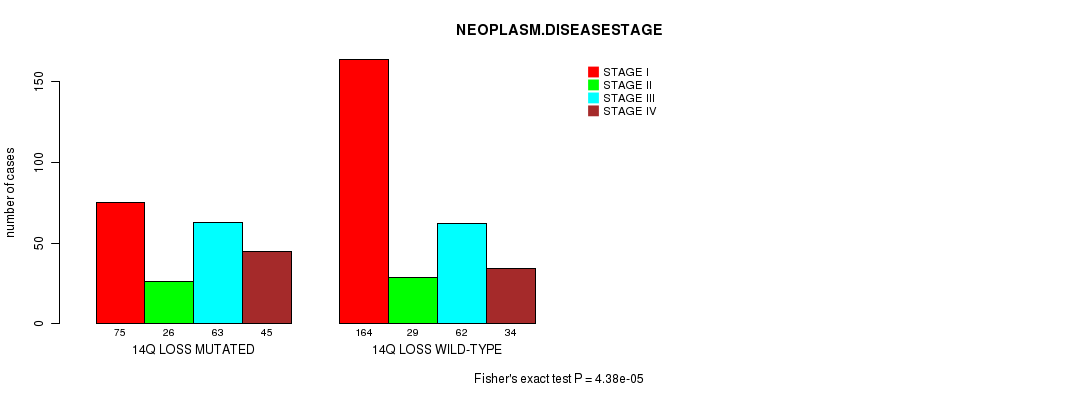
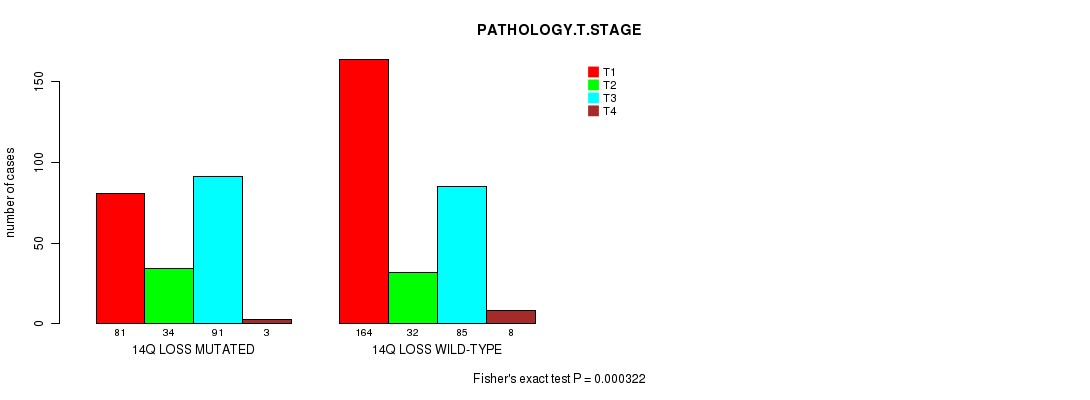
14q loss cnv correlated to 'NEOPLASM.DISEASESTAGE' and 'PATHOLOGY.T.STAGE'.
-
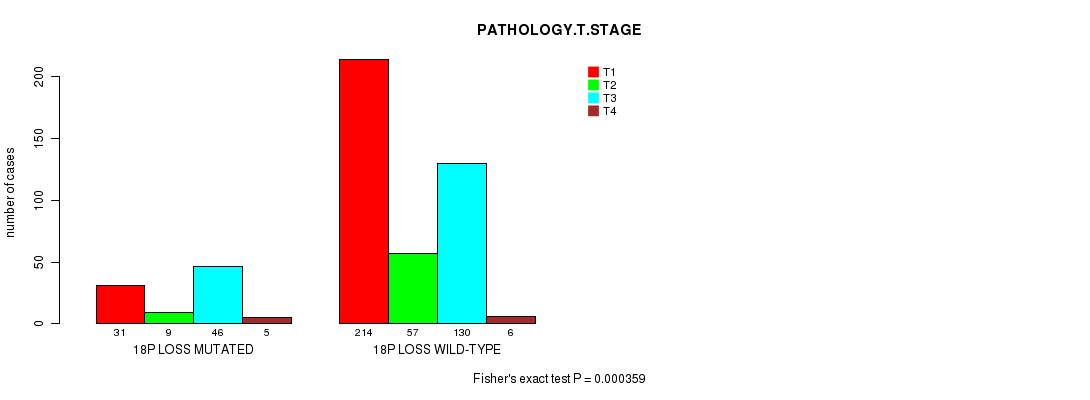
18p loss cnv correlated to 'PATHOLOGY.T.STAGE'.
-
19p loss cnv correlated to 'Time to Death'.
Table 1. Get Full Table Overview of the association between significant copy number variation of 79 arm-level events and 9 clinical features. Shown in the table are P values (Q values). Thresholded by Q value < 0.25, 24 significant findings detected.
|
Clinical Features |
Time to Death |
AGE |
NEOPLASM DISEASESTAGE |
PATHOLOGY T STAGE |
PATHOLOGY N STAGE |
PATHOLOGY M STAGE |
GENDER |
KARNOFSKY PERFORMANCE SCORE |
NUMBERPACKYEARSSMOKED | ||
| nCNV (%) | nWild-Type | logrank test | t-test | Fisher's exact test | Fisher's exact test | Fisher's exact test | Fisher's exact test | Fisher's exact test | t-test | t-test | |
| 4q loss | 65 (13%) | 433 |
2.85e-06 (0.00172) |
0.9 (1.00) |
1.63e-05 (0.00974) |
6.63e-06 (0.00397) |
0.466 (1.00) |
0.00848 (1.00) |
0.333 (1.00) |
0.193 (1.00) |
|
| 9p loss | 144 (29%) | 354 |
1.17e-05 (0.00702) |
0.0691 (1.00) |
4.58e-06 (0.00276) |
5.51e-05 (0.0327) |
0.101 (1.00) |
0.00175 (0.988) |
0.000873 (0.501) |
0.576 (1.00) |
|
| 9q loss | 145 (29%) | 353 |
0.000239 (0.14) |
0.0498 (1.00) |
1.66e-06 (0.001) |
5.19e-06 (0.00312) |
0.171 (1.00) |
0.00465 (1.00) |
0.00063 (0.362) |
0.487 (1.00) |
|
| 20p gain | 110 (22%) | 388 |
0.187 (1.00) |
0.194 (1.00) |
8.79e-05 (0.052) |
5.35e-06 (0.00321) |
0.547 (1.00) |
0.0242 (1.00) |
0.00141 (0.8) |
0.373 (1.00) |
|
| 20q gain | 113 (23%) | 385 |
0.143 (1.00) |
0.0614 (1.00) |
6.04e-05 (0.0358) |
1.9e-05 (0.0113) |
0.239 (1.00) |
0.0332 (1.00) |
0.00683 (1.00) |
0.373 (1.00) |
|
| 4p loss | 71 (14%) | 427 |
1.68e-05 (0.00999) |
0.971 (1.00) |
0.000452 (0.262) |
0.000285 (0.167) |
0.727 (1.00) |
0.0569 (1.00) |
0.894 (1.00) |
0.13 (1.00) |
|
| 13q loss | 69 (14%) | 429 |
0.00106 (0.606) |
0.558 (1.00) |
0.000211 (0.124) |
3.14e-06 (0.00189) |
0.323 (1.00) |
0.105 (1.00) |
0.34 (1.00) |
0.669 (1.00) |
|
| 14q loss | 209 (42%) | 289 |
0.00107 (0.611) |
0.165 (1.00) |
4.38e-05 (0.026) |
0.000322 (0.188) |
0.00248 (1.00) |
0.00173 (0.978) |
0.0707 (1.00) |
0.0872 (1.00) |
|
| 3q gain | 59 (12%) | 439 |
0.394 (1.00) |
0.625 (1.00) |
0.00233 (1.00) |
0.000339 (0.198) |
0.00753 (1.00) |
0.018 (1.00) |
1 (1.00) |
0.193 (1.00) |
|
| 5p gain | 186 (37%) | 312 |
0.0576 (1.00) |
0.000199 (0.117) |
0.161 (1.00) |
0.298 (1.00) |
0.62 (1.00) |
0.696 (1.00) |
0.0254 (1.00) |
0.572 (1.00) |
|
| 5p loss | 7 (1%) | 491 |
0.0187 (1.00) |
0.291 (1.00) |
0.00189 (1.00) |
0.000195 (0.115) |
1 (1.00) |
0.12 (1.00) |
0.243 (1.00) |
||
| 18p loss | 91 (18%) | 407 |
0.00286 (1.00) |
0.123 (1.00) |
0.000573 (0.331) |
0.000359 (0.209) |
1 (1.00) |
0.172 (1.00) |
0.182 (1.00) |
0.494 (1.00) |
|
| 19p loss | 11 (2%) | 487 |
0.00017 (0.1) |
0.0391 (1.00) |
0.0329 (1.00) |
0.000893 (0.512) |
1 (1.00) |
0.431 (1.00) |
0.755 (1.00) |
||
| 1p gain | 22 (4%) | 476 |
0.00271 (1.00) |
0.303 (1.00) |
0.324 (1.00) |
0.328 (1.00) |
0.214 (1.00) |
0.448 (1.00) |
1 (1.00) |
0.482 (1.00) |
|
| 1q gain | 50 (10%) | 448 |
0.0833 (1.00) |
0.0691 (1.00) |
0.132 (1.00) |
0.169 (1.00) |
0.427 (1.00) |
0.769 (1.00) |
0.755 (1.00) |
0.499 (1.00) |
|
| 2p gain | 75 (15%) | 423 |
0.813 (1.00) |
0.148 (1.00) |
0.188 (1.00) |
0.463 (1.00) |
1 (1.00) |
0.323 (1.00) |
0.794 (1.00) |
0.491 (1.00) |
|
| 2q gain | 76 (15%) | 422 |
0.663 (1.00) |
0.2 (1.00) |
0.327 (1.00) |
0.715 (1.00) |
1 (1.00) |
0.266 (1.00) |
0.361 (1.00) |
0.387 (1.00) |
|
| 3p gain | 20 (4%) | 478 |
0.0783 (1.00) |
0.852 (1.00) |
0.103 (1.00) |
0.177 (1.00) |
0.0587 (1.00) |
0.211 (1.00) |
0.344 (1.00) |
0.328 (1.00) |
|
| 4p gain | 13 (3%) | 485 |
0.0984 (1.00) |
0.865 (1.00) |
0.468 (1.00) |
0.209 (1.00) |
0.5 (1.00) |
1 (1.00) |
0.557 (1.00) |
||
| 4q gain | 13 (3%) | 485 |
0.296 (1.00) |
0.865 (1.00) |
0.575 (1.00) |
0.755 (1.00) |
0.459 (1.00) |
0.725 (1.00) |
1 (1.00) |
||
| 5q gain | 199 (40%) | 299 |
0.0609 (1.00) |
0.000608 (0.35) |
0.415 (1.00) |
0.456 (1.00) |
1 (1.00) |
0.731 (1.00) |
0.0348 (1.00) |
0.572 (1.00) |
|
| 6p gain | 11 (2%) | 487 |
0.744 (1.00) |
0.775 (1.00) |
0.384 (1.00) |
0.274 (1.00) |
1 (1.00) |
0.707 (1.00) |
0.344 (1.00) |
||
| 6q gain | 9 (2%) | 489 |
0.536 (1.00) |
0.321 (1.00) |
0.268 (1.00) |
0.298 (1.00) |
1 (1.00) |
1 (1.00) |
0.172 (1.00) |
||
| 7p gain | 166 (33%) | 332 |
1 (1.00) |
0.443 (1.00) |
0.0857 (1.00) |
0.137 (1.00) |
0.449 (1.00) |
0.0487 (1.00) |
0.00375 (1.00) |
0.711 (1.00) |
|
| 7q gain | 167 (34%) | 331 |
0.511 (1.00) |
0.498 (1.00) |
0.019 (1.00) |
0.0663 (1.00) |
0.443 (1.00) |
0.00492 (1.00) |
0.00968 (1.00) |
0.528 (1.00) |
|
| 8p gain | 29 (6%) | 469 |
0.543 (1.00) |
0.249 (1.00) |
0.00562 (1.00) |
0.00419 (1.00) |
1 (1.00) |
0.328 (1.00) |
0.841 (1.00) |
0.757 (1.00) |
|
| 8q gain | 57 (11%) | 441 |
0.342 (1.00) |
0.0745 (1.00) |
0.0197 (1.00) |
0.00561 (1.00) |
0.427 (1.00) |
0.156 (1.00) |
0.302 (1.00) |
0.471 (1.00) |
|
| 9p gain | 13 (3%) | 485 |
0.269 (1.00) |
0.563 (1.00) |
0.947 (1.00) |
0.0521 (1.00) |
1 (1.00) |
0.296 (1.00) |
0.0145 (1.00) |
||
| 9q gain | 12 (2%) | 486 |
0.961 (1.00) |
0.337 (1.00) |
0.243 (1.00) |
0.00315 (1.00) |
1 (1.00) |
1 (1.00) |
0.121 (1.00) |
||
| 10p gain | 17 (3%) | 481 |
0.774 (1.00) |
0.148 (1.00) |
0.356 (1.00) |
0.105 (1.00) |
0.108 (1.00) |
0.765 (1.00) |
0.798 (1.00) |
0.887 (1.00) |
|
| 10q gain | 12 (2%) | 486 |
0.663 (1.00) |
0.0405 (1.00) |
0.827 (1.00) |
0.884 (1.00) |
0.263 (1.00) |
1 (1.00) |
0.357 (1.00) |
0.81 (1.00) |
|
| 11p gain | 31 (6%) | 467 |
0.997 (1.00) |
0.932 (1.00) |
0.0484 (1.00) |
0.0222 (1.00) |
1 (1.00) |
0.045 (1.00) |
0.847 (1.00) |
0.484 (1.00) |
|
| 11q gain | 29 (6%) | 469 |
0.491 (1.00) |
0.999 (1.00) |
0.243 (1.00) |
0.126 (1.00) |
1 (1.00) |
0.102 (1.00) |
1 (1.00) |
||
| 12p gain | 117 (23%) | 381 |
0.00915 (1.00) |
0.0445 (1.00) |
0.00167 (0.945) |
0.00513 (1.00) |
0.258 (1.00) |
0.047 (1.00) |
0.581 (1.00) |
0.268 (1.00) |
|
| 12q gain | 117 (23%) | 381 |
0.0139 (1.00) |
0.1 (1.00) |
0.00167 (0.945) |
0.00513 (1.00) |
0.404 (1.00) |
0.047 (1.00) |
0.581 (1.00) |
0.268 (1.00) |
|
| 13q gain | 22 (4%) | 476 |
0.226 (1.00) |
0.338 (1.00) |
0.178 (1.00) |
0.264 (1.00) |
1 (1.00) |
0.448 (1.00) |
0.261 (1.00) |
||
| 14q gain | 16 (3%) | 482 |
0.152 (1.00) |
0.566 (1.00) |
0.285 (1.00) |
0.00793 (1.00) |
1 (1.00) |
0.362 (1.00) |
1 (1.00) |
||
| 15q gain | 26 (5%) | 472 |
0.271 (1.00) |
0.378 (1.00) |
0.649 (1.00) |
0.458 (1.00) |
0.214 (1.00) |
0.645 (1.00) |
0.833 (1.00) |
0.349 (1.00) |
|
| 16p gain | 104 (21%) | 394 |
0.393 (1.00) |
0.246 (1.00) |
0.226 (1.00) |
0.129 (1.00) |
0.133 (1.00) |
0.547 (1.00) |
0.818 (1.00) |
0.449 (1.00) |
|
| 16q gain | 96 (19%) | 402 |
0.238 (1.00) |
0.313 (1.00) |
0.23 (1.00) |
0.0823 (1.00) |
0.212 (1.00) |
0.703 (1.00) |
0.905 (1.00) |
0.31 (1.00) |
|
| 17p gain | 25 (5%) | 473 |
0.91 (1.00) |
0.365 (1.00) |
0.0766 (1.00) |
0.822 (1.00) |
0.214 (1.00) |
0.0459 (1.00) |
0.833 (1.00) |
0.74 (1.00) |
|
| 17q gain | 31 (6%) | 467 |
0.576 (1.00) |
0.376 (1.00) |
0.52 (1.00) |
0.732 (1.00) |
0.3 (1.00) |
0.342 (1.00) |
1 (1.00) |
0.471 (1.00) |
|
| 18p gain | 25 (5%) | 473 |
0.0456 (1.00) |
0.661 (1.00) |
0.667 (1.00) |
0.893 (1.00) |
1 (1.00) |
0.487 (1.00) |
0.0832 (1.00) |
||
| 18q gain | 25 (5%) | 473 |
0.11 (1.00) |
0.517 (1.00) |
0.541 (1.00) |
0.807 (1.00) |
0.605 (1.00) |
0.487 (1.00) |
0.0832 (1.00) |
||
| 19p gain | 51 (10%) | 447 |
0.978 (1.00) |
0.641 (1.00) |
0.0111 (1.00) |
0.025 (1.00) |
0.405 (1.00) |
0.0236 (1.00) |
0.28 (1.00) |
0.716 (1.00) |
|
| 19q gain | 57 (11%) | 441 |
0.555 (1.00) |
0.405 (1.00) |
0.00302 (1.00) |
0.0104 (1.00) |
0.439 (1.00) |
0.0106 (1.00) |
0.302 (1.00) |
0.716 (1.00) |
|
| 21q gain | 48 (10%) | 450 |
0.567 (1.00) |
0.115 (1.00) |
0.231 (1.00) |
0.113 (1.00) |
1 (1.00) |
0.656 (1.00) |
0.43 (1.00) |
0.297 (1.00) |
|
| 22q gain | 40 (8%) | 458 |
0.482 (1.00) |
0.481 (1.00) |
0.831 (1.00) |
0.121 (1.00) |
1 (1.00) |
0.86 (1.00) |
0.388 (1.00) |
0.829 (1.00) |
|
| xq gain | 29 (6%) | 469 |
0.841 (1.00) |
0.817 (1.00) |
0.0863 (1.00) |
0.145 (1.00) |
1 (1.00) |
0.0157 (1.00) |
0.693 (1.00) |
0.328 (1.00) |
|
| 1p loss | 56 (11%) | 442 |
0.565 (1.00) |
0.0822 (1.00) |
0.371 (1.00) |
0.0107 (1.00) |
0.702 (1.00) |
0.534 (1.00) |
0.233 (1.00) |
0.297 (1.00) |
|
| 1q loss | 36 (7%) | 462 |
0.71 (1.00) |
0.629 (1.00) |
0.768 (1.00) |
0.0765 (1.00) |
1 (1.00) |
0.396 (1.00) |
0.717 (1.00) |
0.484 (1.00) |
|
| 2p loss | 14 (3%) | 484 |
0.998 (1.00) |
0.93 (1.00) |
0.42 (1.00) |
0.128 (1.00) |
1 (1.00) |
0.732 (1.00) |
0.779 (1.00) |
||
| 2q loss | 14 (3%) | 484 |
0.984 (1.00) |
0.911 (1.00) |
0.564 (1.00) |
0.224 (1.00) |
1 (1.00) |
0.732 (1.00) |
0.779 (1.00) |
||
| 3p loss | 358 (72%) | 140 |
0.573 (1.00) |
0.727 (1.00) |
0.0166 (1.00) |
0.0324 (1.00) |
0.793 (1.00) |
0.149 (1.00) |
0.0211 (1.00) |
0.0785 (1.00) |
|
| 3q loss | 99 (20%) | 399 |
0.73 (1.00) |
0.0142 (1.00) |
0.636 (1.00) |
0.275 (1.00) |
0.746 (1.00) |
0.146 (1.00) |
0.000595 (0.344) |
0.384 (1.00) |
|
| 5q loss | 6 (1%) | 492 |
0.0521 (1.00) |
0.232 (1.00) |
0.00662 (1.00) |
0.000451 (0.262) |
1 (1.00) |
0.268 (1.00) |
0.423 (1.00) |
||
| 6p loss | 98 (20%) | 400 |
0.392 (1.00) |
0.428 (1.00) |
0.0711 (1.00) |
0.044 (1.00) |
0.00508 (1.00) |
0.412 (1.00) |
0.002 (1.00) |
0.122 (1.00) |
|
| 6q loss | 123 (25%) | 375 |
0.493 (1.00) |
0.899 (1.00) |
0.286 (1.00) |
0.192 (1.00) |
0.00122 (0.693) |
0.719 (1.00) |
0.0637 (1.00) |
0.21 (1.00) |
|
| 7q loss | 3 (1%) | 495 |
0.525 (1.00) |
0.558 (1.00) |
0.127 (1.00) |
0.011 (1.00) |
0.0729 (1.00) |
1 (1.00) |
0.555 (1.00) |
||
| 8p loss | 134 (27%) | 364 |
0.354 (1.00) |
0.686 (1.00) |
0.406 (1.00) |
0.329 (1.00) |
0.776 (1.00) |
0.422 (1.00) |
0.0722 (1.00) |
0.893 (1.00) |
|
| 8q loss | 65 (13%) | 433 |
0.649 (1.00) |
0.958 (1.00) |
0.631 (1.00) |
0.255 (1.00) |
0.466 (1.00) |
0.815 (1.00) |
0.0174 (1.00) |
0.654 (1.00) |
|
| 10p loss | 65 (13%) | 433 |
0.382 (1.00) |
0.492 (1.00) |
0.081 (1.00) |
0.00974 (1.00) |
0.14 (1.00) |
0.726 (1.00) |
0.333 (1.00) |
0.0269 (1.00) |
|
| 10q loss | 86 (17%) | 412 |
0.473 (1.00) |
0.507 (1.00) |
0.0935 (1.00) |
0.00232 (1.00) |
0.322 (1.00) |
0.789 (1.00) |
0.105 (1.00) |
0.112 (1.00) |
|
| 11p loss | 18 (4%) | 480 |
0.0112 (1.00) |
0.144 (1.00) |
0.476 (1.00) |
0.444 (1.00) |
0.159 (1.00) |
0.557 (1.00) |
1 (1.00) |
0.81 (1.00) |
|
| 11q loss | 23 (5%) | 475 |
0.00979 (1.00) |
0.0226 (1.00) |
0.704 (1.00) |
0.627 (1.00) |
0.243 (1.00) |
0.467 (1.00) |
0.502 (1.00) |
0.887 (1.00) |
|
| 12p loss | 3 (1%) | 495 |
0.324 (1.00) |
0.754 (1.00) |
0.491 (1.00) |
0.743 (1.00) |
1 (1.00) |
1 (1.00) |
1 (1.00) |
||
| 12q loss | 4 (1%) | 494 |
0.964 (1.00) |
0.342 (1.00) |
0.174 (1.00) |
0.414 (1.00) |
1 (1.00) |
1 (1.00) |
1 (1.00) |
||
| 15q loss | 35 (7%) | 463 |
0.00244 (1.00) |
0.833 (1.00) |
0.00113 (0.643) |
0.000445 (0.259) |
1 (1.00) |
0.0338 (1.00) |
0.0659 (1.00) |
0.484 (1.00) |
|
| 16p loss | 9 (2%) | 489 |
0.129 (1.00) |
0.843 (1.00) |
0.259 (1.00) |
0.00912 (1.00) |
0.368 (1.00) |
1 (1.00) |
1 (1.00) |
||
| 16q loss | 13 (3%) | 485 |
0.214 (1.00) |
0.913 (1.00) |
0.306 (1.00) |
0.00392 (1.00) |
0.459 (1.00) |
1 (1.00) |
1 (1.00) |
||
| 17p loss | 44 (9%) | 454 |
0.377 (1.00) |
0.435 (1.00) |
0.222 (1.00) |
0.184 (1.00) |
0.376 (1.00) |
0.0852 (1.00) |
0.186 (1.00) |
0.0261 (1.00) |
|
| 17q loss | 28 (6%) | 470 |
0.457 (1.00) |
0.829 (1.00) |
0.361 (1.00) |
0.344 (1.00) |
1 (1.00) |
0.311 (1.00) |
0.312 (1.00) |
||
| 18q loss | 93 (19%) | 405 |
0.0113 (1.00) |
0.138 (1.00) |
0.012 (1.00) |
0.00624 (1.00) |
1 (1.00) |
0.193 (1.00) |
0.148 (1.00) |
0.569 (1.00) |
|
| 19q loss | 4 (1%) | 494 |
0.00404 (1.00) |
0.829 (1.00) |
0.245 (1.00) |
0.00309 (1.00) |
1 (1.00) |
0.14 (1.00) |
1 (1.00) |
||
| 20p loss | 8 (2%) | 490 |
0.824 (1.00) |
0.704 (1.00) |
0.727 (1.00) |
0.617 (1.00) |
1 (1.00) |
0.397 (1.00) |
1 (1.00) |
||
| 20q loss | 3 (1%) | 495 |
0.808 (1.00) |
0.181 (1.00) |
0.244 (1.00) |
0.111 (1.00) |
0.414 (1.00) |
1 (1.00) |
|||
| 21q loss | 53 (11%) | 445 |
0.638 (1.00) |
0.587 (1.00) |
0.197 (1.00) |
0.00406 (1.00) |
0.0939 (1.00) |
1 (1.00) |
0.761 (1.00) |
0.505 (1.00) |
|
| 22q loss | 38 (8%) | 460 |
0.0021 (1.00) |
0.267 (1.00) |
0.0203 (1.00) |
0.16 (1.00) |
1 (1.00) |
0.163 (1.00) |
0.726 (1.00) |
0.115 (1.00) |
|
| xq loss | 44 (9%) | 454 |
0.244 (1.00) |
0.422 (1.00) |
0.66 (1.00) |
0.21 (1.00) |
0.328 (1.00) |
1 (1.00) |
0.186 (1.00) |
P value = 0.000339 (Fisher's exact test), Q value = 0.2
Table S1. Gene #6: '3q gain' versus Clinical Feature #4: 'PATHOLOGY.T.STAGE'
| nPatients | T1 | T2 | T3 | T4 |
|---|---|---|---|---|
| ALL | 245 | 66 | 176 | 11 |
| 3Q GAIN MUTATED | 17 | 6 | 32 | 4 |
| 3Q GAIN WILD-TYPE | 228 | 60 | 144 | 7 |
Figure S1. Get High-res Image Gene #6: '3q gain' versus Clinical Feature #4: 'PATHOLOGY.T.STAGE'
P value = 0.000199 (t-test), Q value = 0.12
Table S2. Gene #9: '5p gain' versus Clinical Feature #2: 'AGE'
| nPatients | Mean (Std.Dev) | |
|---|---|---|
| ALL | 497 | 60.5 (12.2) |
| 5P GAIN MUTATED | 186 | 63.2 (11.8) |
| 5P GAIN WILD-TYPE | 311 | 59.0 (12.1) |
Figure S2. Get High-res Image Gene #9: '5p gain' versus Clinical Feature #2: 'AGE'
P value = 8.79e-05 (Fisher's exact test), Q value = 0.052
Table S3. Gene #36: '20p gain' versus Clinical Feature #3: 'NEOPLASM.DISEASESTAGE'
| nPatients | STAGE I | STAGE II | STAGE III | STAGE IV |
|---|---|---|---|---|
| ALL | 239 | 55 | 125 | 79 |
| 20P GAIN MUTATED | 33 | 12 | 39 | 26 |
| 20P GAIN WILD-TYPE | 206 | 43 | 86 | 53 |
Figure S3. Get High-res Image Gene #36: '20p gain' versus Clinical Feature #3: 'NEOPLASM.DISEASESTAGE'
P value = 5.35e-06 (Fisher's exact test), Q value = 0.0032
Table S4. Gene #36: '20p gain' versus Clinical Feature #4: 'PATHOLOGY.T.STAGE'
| nPatients | T1 | T2 | T3 | T4 |
|---|---|---|---|---|
| ALL | 245 | 66 | 176 | 11 |
| 20P GAIN MUTATED | 34 | 13 | 57 | 6 |
| 20P GAIN WILD-TYPE | 211 | 53 | 119 | 5 |
Figure S4. Get High-res Image Gene #36: '20p gain' versus Clinical Feature #4: 'PATHOLOGY.T.STAGE'
P value = 6.04e-05 (Fisher's exact test), Q value = 0.036
Table S5. Gene #37: '20q gain' versus Clinical Feature #3: 'NEOPLASM.DISEASESTAGE'
| nPatients | STAGE I | STAGE II | STAGE III | STAGE IV |
|---|---|---|---|---|
| ALL | 239 | 55 | 125 | 79 |
| 20Q GAIN MUTATED | 34 | 12 | 41 | 26 |
| 20Q GAIN WILD-TYPE | 205 | 43 | 84 | 53 |
Figure S5. Get High-res Image Gene #37: '20q gain' versus Clinical Feature #3: 'NEOPLASM.DISEASESTAGE'

P value = 1.9e-05 (Fisher's exact test), Q value = 0.011
Table S6. Gene #37: '20q gain' versus Clinical Feature #4: 'PATHOLOGY.T.STAGE'
| nPatients | T1 | T2 | T3 | T4 |
|---|---|---|---|---|
| ALL | 245 | 66 | 176 | 11 |
| 20Q GAIN MUTATED | 36 | 13 | 59 | 5 |
| 20Q GAIN WILD-TYPE | 209 | 53 | 117 | 6 |
Figure S6. Get High-res Image Gene #37: '20q gain' versus Clinical Feature #4: 'PATHOLOGY.T.STAGE'

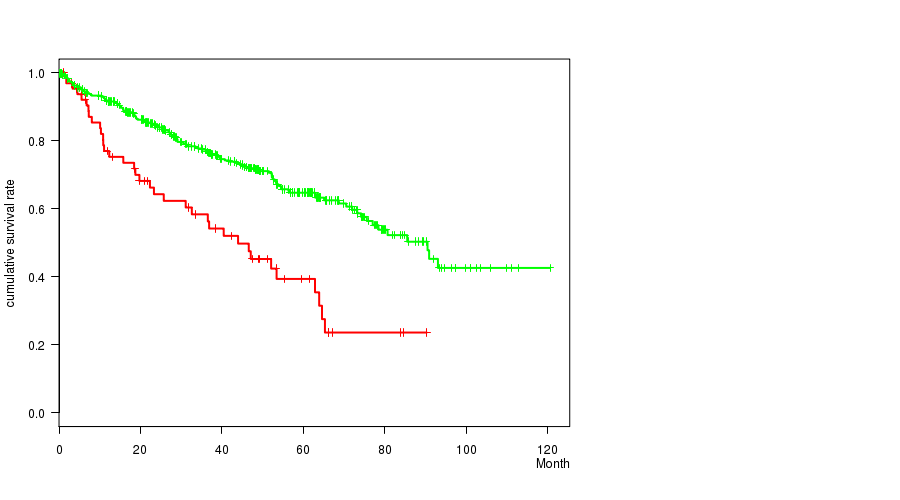
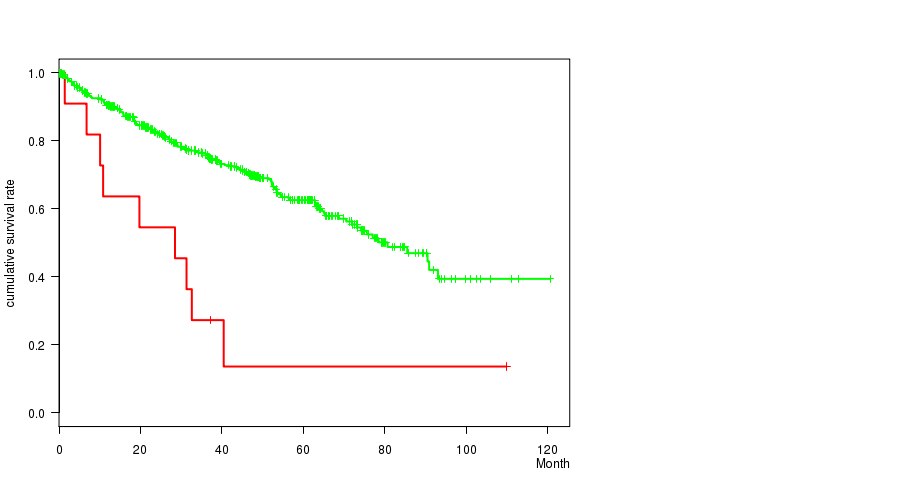
P value = 1.68e-05 (logrank test), Q value = 0.01
Table S7. Gene #47: '4p loss' versus Clinical Feature #1: 'Time to Death'
| nPatients | nDeath | Duration Range (Median), Month | |
|---|---|---|---|
| ALL | 497 | 166 | 0.1 - 120.6 (37.1) |
| 4P LOSS MUTATED | 71 | 38 | 0.5 - 90.3 (31.1) |
| 4P LOSS WILD-TYPE | 426 | 128 | 0.1 - 120.6 (37.2) |
Figure S7. Get High-res Image Gene #47: '4p loss' versus Clinical Feature #1: 'Time to Death'
P value = 0.000285 (Fisher's exact test), Q value = 0.17
Table S8. Gene #47: '4p loss' versus Clinical Feature #4: 'PATHOLOGY.T.STAGE'
| nPatients | T1 | T2 | T3 | T4 |
|---|---|---|---|---|
| ALL | 245 | 66 | 176 | 11 |
| 4P LOSS MUTATED | 21 | 8 | 38 | 4 |
| 4P LOSS WILD-TYPE | 224 | 58 | 138 | 7 |
Figure S8. Get High-res Image Gene #47: '4p loss' versus Clinical Feature #4: 'PATHOLOGY.T.STAGE'

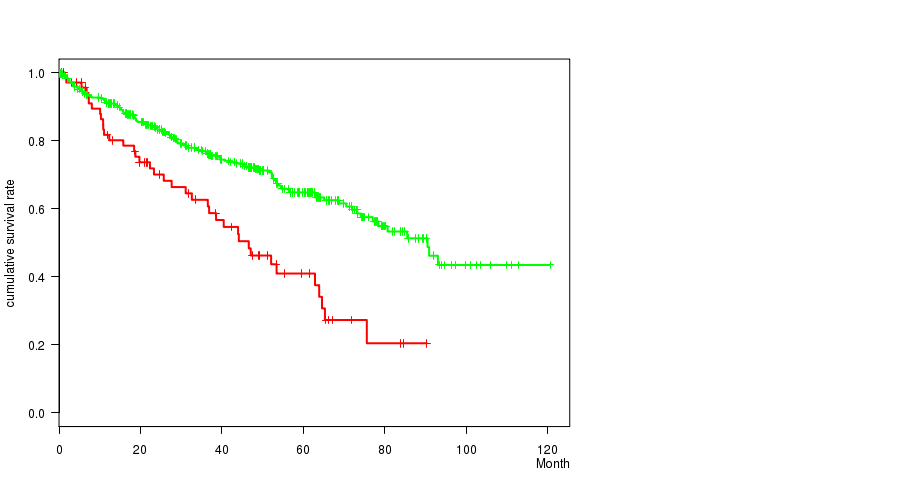
P value = 2.85e-06 (logrank test), Q value = 0.0017
Table S9. Gene #48: '4q loss' versus Clinical Feature #1: 'Time to Death'
| nPatients | nDeath | Duration Range (Median), Month | |
|---|---|---|---|
| ALL | 497 | 166 | 0.1 - 120.6 (37.1) |
| 4Q LOSS MUTATED | 65 | 36 | 1.2 - 90.3 (25.7) |
| 4Q LOSS WILD-TYPE | 432 | 130 | 0.1 - 120.6 (37.3) |
Figure S9. Get High-res Image Gene #48: '4q loss' versus Clinical Feature #1: 'Time to Death'
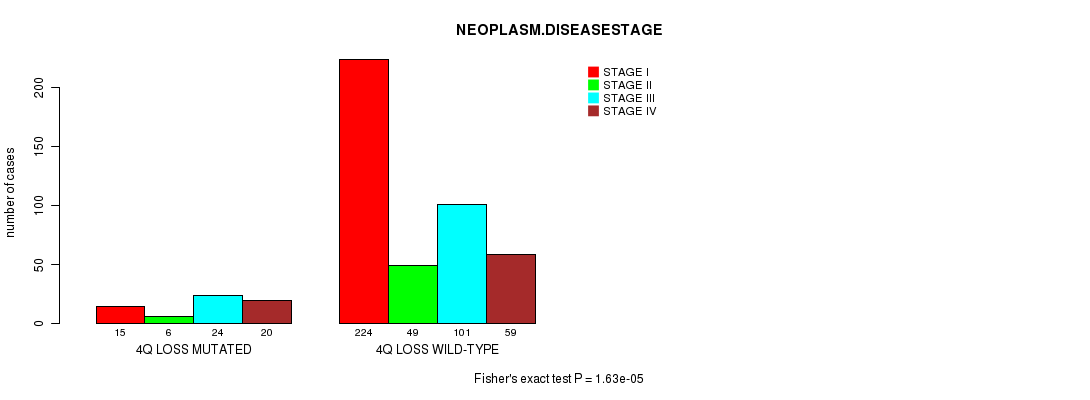
P value = 1.63e-05 (Fisher's exact test), Q value = 0.0097
Table S10. Gene #48: '4q loss' versus Clinical Feature #3: 'NEOPLASM.DISEASESTAGE'
| nPatients | STAGE I | STAGE II | STAGE III | STAGE IV |
|---|---|---|---|---|
| ALL | 239 | 55 | 125 | 79 |
| 4Q LOSS MUTATED | 15 | 6 | 24 | 20 |
| 4Q LOSS WILD-TYPE | 224 | 49 | 101 | 59 |
Figure S10. Get High-res Image Gene #48: '4q loss' versus Clinical Feature #3: 'NEOPLASM.DISEASESTAGE'
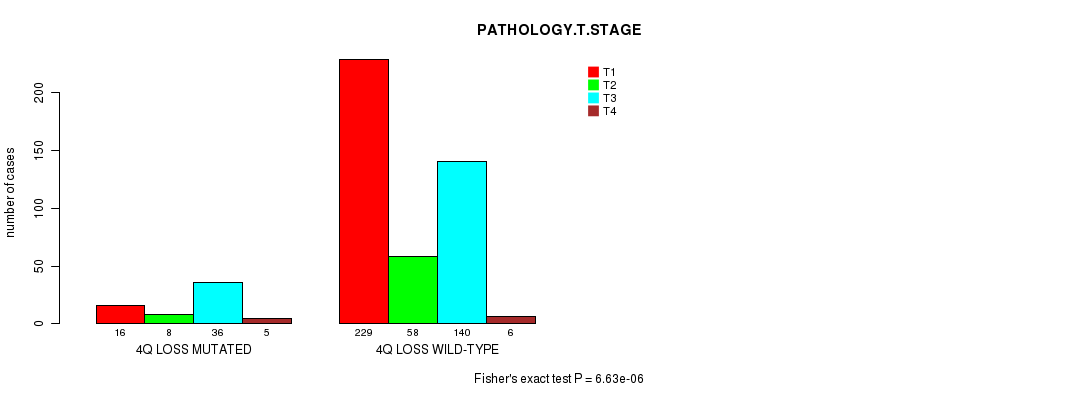
P value = 6.63e-06 (Fisher's exact test), Q value = 0.004
Table S11. Gene #48: '4q loss' versus Clinical Feature #4: 'PATHOLOGY.T.STAGE'
| nPatients | T1 | T2 | T3 | T4 |
|---|---|---|---|---|
| ALL | 245 | 66 | 176 | 11 |
| 4Q LOSS MUTATED | 16 | 8 | 36 | 5 |
| 4Q LOSS WILD-TYPE | 229 | 58 | 140 | 6 |
Figure S11. Get High-res Image Gene #48: '4q loss' versus Clinical Feature #4: 'PATHOLOGY.T.STAGE'
P value = 0.000195 (Fisher's exact test), Q value = 0.11
Table S12. Gene #49: '5p loss' versus Clinical Feature #4: 'PATHOLOGY.T.STAGE'
| nPatients | T1 | T2 | T3 | T4 |
|---|---|---|---|---|
| ALL | 245 | 66 | 176 | 11 |
| 5P LOSS MUTATED | 0 | 3 | 2 | 2 |
| 5P LOSS WILD-TYPE | 245 | 63 | 174 | 9 |
Figure S12. Get High-res Image Gene #49: '5p loss' versus Clinical Feature #4: 'PATHOLOGY.T.STAGE'
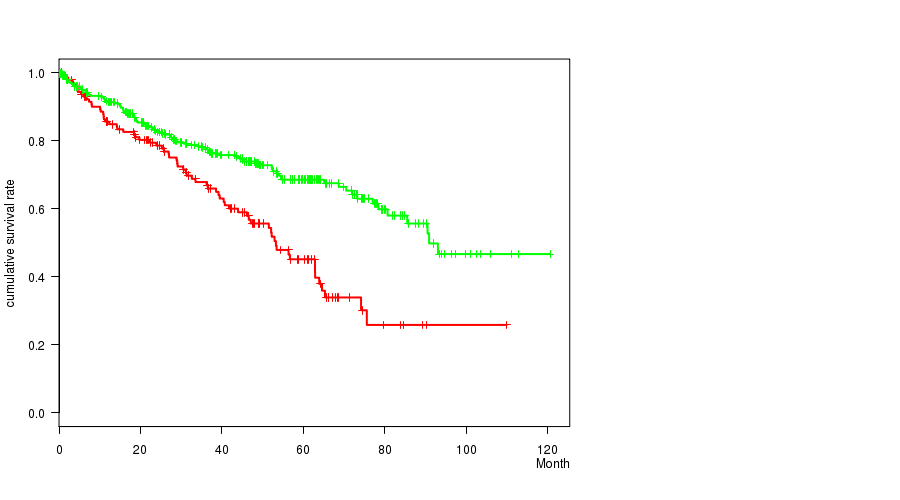
P value = 1.17e-05 (logrank test), Q value = 0.007
Table S13. Gene #56: '9p loss' versus Clinical Feature #1: 'Time to Death'
| nPatients | nDeath | Duration Range (Median), Month | |
|---|---|---|---|
| ALL | 497 | 166 | 0.1 - 120.6 (37.1) |
| 9P LOSS MUTATED | 144 | 69 | 0.2 - 109.9 (34.9) |
| 9P LOSS WILD-TYPE | 353 | 97 | 0.1 - 120.6 (37.2) |
Figure S13. Get High-res Image Gene #56: '9p loss' versus Clinical Feature #1: 'Time to Death'
P value = 4.58e-06 (Fisher's exact test), Q value = 0.0028
Table S14. Gene #56: '9p loss' versus Clinical Feature #3: 'NEOPLASM.DISEASESTAGE'
| nPatients | STAGE I | STAGE II | STAGE III | STAGE IV |
|---|---|---|---|---|
| ALL | 239 | 55 | 125 | 79 |
| 9P LOSS MUTATED | 48 | 11 | 50 | 35 |
| 9P LOSS WILD-TYPE | 191 | 44 | 75 | 44 |
Figure S14. Get High-res Image Gene #56: '9p loss' versus Clinical Feature #3: 'NEOPLASM.DISEASESTAGE'
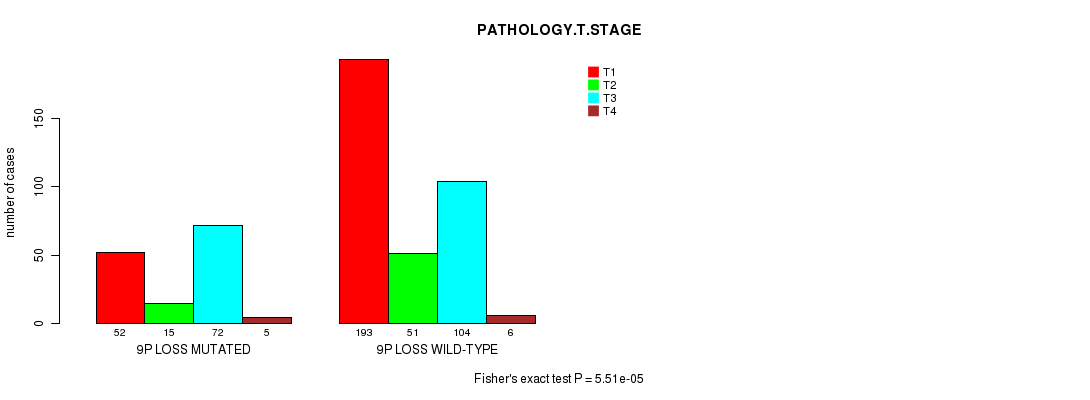
P value = 5.51e-05 (Fisher's exact test), Q value = 0.033
Table S15. Gene #56: '9p loss' versus Clinical Feature #4: 'PATHOLOGY.T.STAGE'
| nPatients | T1 | T2 | T3 | T4 |
|---|---|---|---|---|
| ALL | 245 | 66 | 176 | 11 |
| 9P LOSS MUTATED | 52 | 15 | 72 | 5 |
| 9P LOSS WILD-TYPE | 193 | 51 | 104 | 6 |
Figure S15. Get High-res Image Gene #56: '9p loss' versus Clinical Feature #4: 'PATHOLOGY.T.STAGE'
P value = 0.000239 (logrank test), Q value = 0.14
Table S16. Gene #57: '9q loss' versus Clinical Feature #1: 'Time to Death'
| nPatients | nDeath | Duration Range (Median), Month | |
|---|---|---|---|
| ALL | 497 | 166 | 0.1 - 120.6 (37.1) |
| 9Q LOSS MUTATED | 145 | 67 | 0.2 - 109.9 (36.5) |
| 9Q LOSS WILD-TYPE | 352 | 99 | 0.1 - 120.6 (37.2) |
Figure S16. Get High-res Image Gene #57: '9q loss' versus Clinical Feature #1: 'Time to Death'
P value = 1.66e-06 (Fisher's exact test), Q value = 0.001
Table S17. Gene #57: '9q loss' versus Clinical Feature #3: 'NEOPLASM.DISEASESTAGE'
| nPatients | STAGE I | STAGE II | STAGE III | STAGE IV |
|---|---|---|---|---|
| ALL | 239 | 55 | 125 | 79 |
| 9Q LOSS MUTATED | 45 | 14 | 52 | 34 |
| 9Q LOSS WILD-TYPE | 194 | 41 | 73 | 45 |
Figure S17. Get High-res Image Gene #57: '9q loss' versus Clinical Feature #3: 'NEOPLASM.DISEASESTAGE'
P value = 5.19e-06 (Fisher's exact test), Q value = 0.0031
Table S18. Gene #57: '9q loss' versus Clinical Feature #4: 'PATHOLOGY.T.STAGE'
| nPatients | T1 | T2 | T3 | T4 |
|---|---|---|---|---|
| ALL | 245 | 66 | 176 | 11 |
| 9Q LOSS MUTATED | 48 | 18 | 75 | 4 |
| 9Q LOSS WILD-TYPE | 197 | 48 | 101 | 7 |
Figure S18. Get High-res Image Gene #57: '9q loss' versus Clinical Feature #4: 'PATHOLOGY.T.STAGE'
P value = 0.000211 (Fisher's exact test), Q value = 0.12
Table S19. Gene #64: '13q loss' versus Clinical Feature #3: 'NEOPLASM.DISEASESTAGE'
| nPatients | STAGE I | STAGE II | STAGE III | STAGE IV |
|---|---|---|---|---|
| ALL | 239 | 55 | 125 | 79 |
| 13Q LOSS MUTATED | 23 | 2 | 25 | 19 |
| 13Q LOSS WILD-TYPE | 216 | 53 | 100 | 60 |
Figure S19. Get High-res Image Gene #64: '13q loss' versus Clinical Feature #3: 'NEOPLASM.DISEASESTAGE'
P value = 3.14e-06 (Fisher's exact test), Q value = 0.0019
Table S20. Gene #64: '13q loss' versus Clinical Feature #4: 'PATHOLOGY.T.STAGE'
| nPatients | T1 | T2 | T3 | T4 |
|---|---|---|---|---|
| ALL | 245 | 66 | 176 | 11 |
| 13Q LOSS MUTATED | 25 | 3 | 34 | 7 |
| 13Q LOSS WILD-TYPE | 220 | 63 | 142 | 4 |
Figure S20. Get High-res Image Gene #64: '13q loss' versus Clinical Feature #4: 'PATHOLOGY.T.STAGE'
P value = 4.38e-05 (Fisher's exact test), Q value = 0.026
Table S21. Gene #65: '14q loss' versus Clinical Feature #3: 'NEOPLASM.DISEASESTAGE'
| nPatients | STAGE I | STAGE II | STAGE III | STAGE IV |
|---|---|---|---|---|
| ALL | 239 | 55 | 125 | 79 |
| 14Q LOSS MUTATED | 75 | 26 | 63 | 45 |
| 14Q LOSS WILD-TYPE | 164 | 29 | 62 | 34 |
Figure S21. Get High-res Image Gene #65: '14q loss' versus Clinical Feature #3: 'NEOPLASM.DISEASESTAGE'
P value = 0.000322 (Fisher's exact test), Q value = 0.19
Table S22. Gene #65: '14q loss' versus Clinical Feature #4: 'PATHOLOGY.T.STAGE'
| nPatients | T1 | T2 | T3 | T4 |
|---|---|---|---|---|
| ALL | 245 | 66 | 176 | 11 |
| 14Q LOSS MUTATED | 81 | 34 | 91 | 3 |
| 14Q LOSS WILD-TYPE | 164 | 32 | 85 | 8 |
Figure S22. Get High-res Image Gene #65: '14q loss' versus Clinical Feature #4: 'PATHOLOGY.T.STAGE'
P value = 0.000359 (Fisher's exact test), Q value = 0.21
Table S23. Gene #71: '18p loss' versus Clinical Feature #4: 'PATHOLOGY.T.STAGE'
| nPatients | T1 | T2 | T3 | T4 |
|---|---|---|---|---|
| ALL | 245 | 66 | 176 | 11 |
| 18P LOSS MUTATED | 31 | 9 | 46 | 5 |
| 18P LOSS WILD-TYPE | 214 | 57 | 130 | 6 |
Figure S23. Get High-res Image Gene #71: '18p loss' versus Clinical Feature #4: 'PATHOLOGY.T.STAGE'
P value = 0.00017 (logrank test), Q value = 0.1
Table S24. Gene #73: '19p loss' versus Clinical Feature #1: 'Time to Death'
| nPatients | nDeath | Duration Range (Median), Month | |
|---|---|---|---|
| ALL | 497 | 166 | 0.1 - 120.6 (37.1) |
| 19P LOSS MUTATED | 11 | 9 | 1.4 - 109.9 (28.5) |
| 19P LOSS WILD-TYPE | 486 | 157 | 0.1 - 120.6 (37.2) |
Figure S24. Get High-res Image Gene #73: '19p loss' versus Clinical Feature #1: 'Time to Death'
-
Copy number data file = transformed.cor.cli.txt
-
Clinical data file = KIRC-TP.merged_data.txt
-
Number of patients = 498
-
Number of significantly arm-level cnvs = 79
-
Number of selected clinical features = 9
-
Exclude regions that fewer than K tumors have mutations, K = 3
For survival clinical features, the Kaplan-Meier survival curves of tumors with and without gene mutations were plotted and the statistical significance P values were estimated by logrank test (Bland and Altman 2004) using the 'survdiff' function in R
For continuous numerical clinical features, two-tailed Student's t test with unequal variance (Lehmann and Romano 2005) was applied to compare the clinical values between tumors with and without gene mutations using 't.test' function in R
For binary or multi-class clinical features (nominal or ordinal), two-tailed Fisher's exact tests (Fisher 1922) were used to estimate the P values using the 'fisher.test' function in R
For multiple hypothesis correction, Q value is the False Discovery Rate (FDR) analogue of the P value (Benjamini and Hochberg 1995), defined as the minimum FDR at which the test may be called significant. We used the 'Benjamini and Hochberg' method of 'p.adjust' function in R to convert P values into Q values.
In addition to the links below, the full results of the analysis summarized in this report can also be downloaded programmatically using firehose_get, or interactively from either the Broad GDAC website or TCGA Data Coordination Center Portal.