This pipeline computes the correlation between significant arm-level copy number variations (cnvs) and selected clinical features.
Testing the association between copy number variation 69 arm-level events and 10 clinical features across 163 patients, 47 significant findings detected with Q value < 0.25.
-
1p gain cnv correlated to 'Time to Death'.
-
1q gain cnv correlated to 'Time to Death', 'NEOPLASM.DISEASESTAGE', and 'PATHOLOGY.T.STAGE'.
-
6q gain cnv correlated to 'Time to Death'.
-
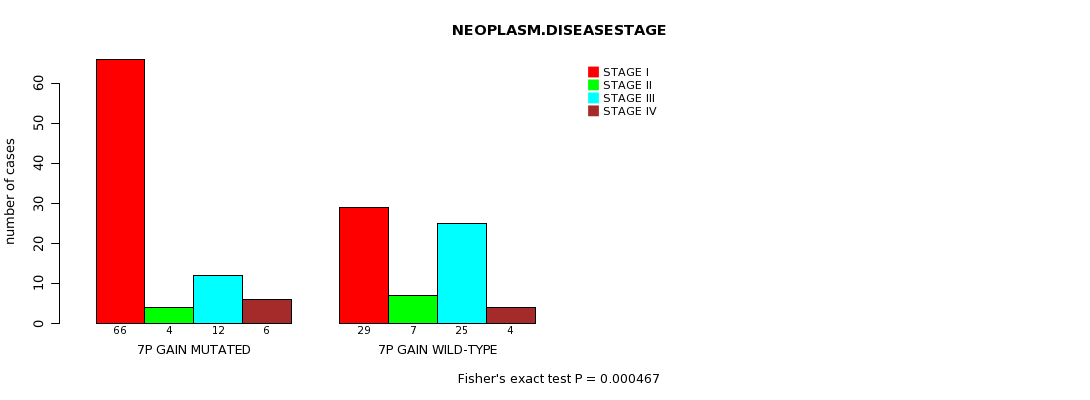
7p gain cnv correlated to 'NEOPLASM.DISEASESTAGE'.
-
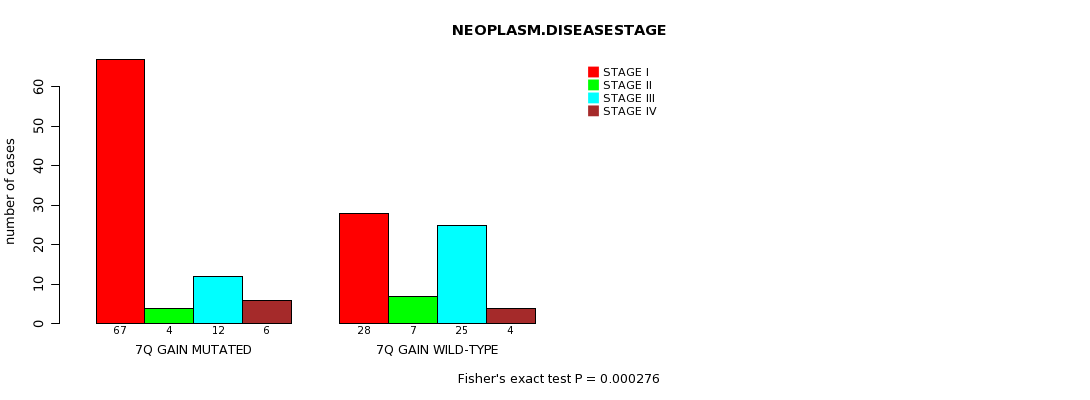
7q gain cnv correlated to 'NEOPLASM.DISEASESTAGE'.
-
8q gain cnv correlated to 'Time to Death'.
-
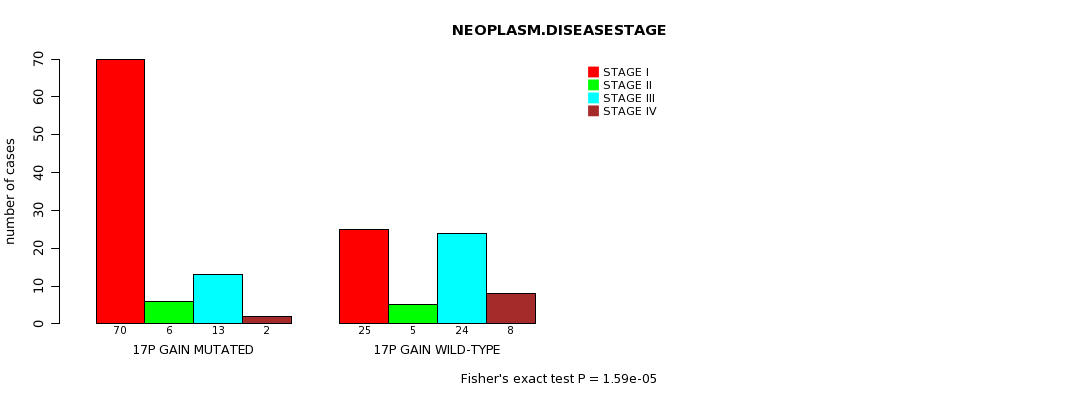
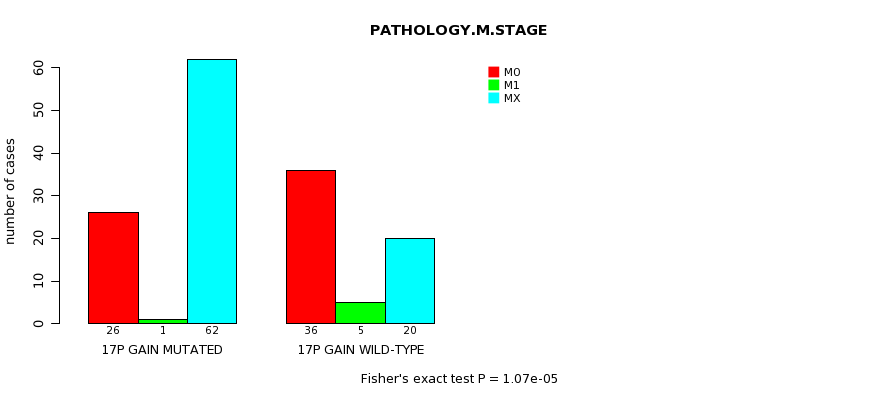
17p gain cnv correlated to 'NEOPLASM.DISEASESTAGE' and 'PATHOLOGY.M.STAGE'.
-
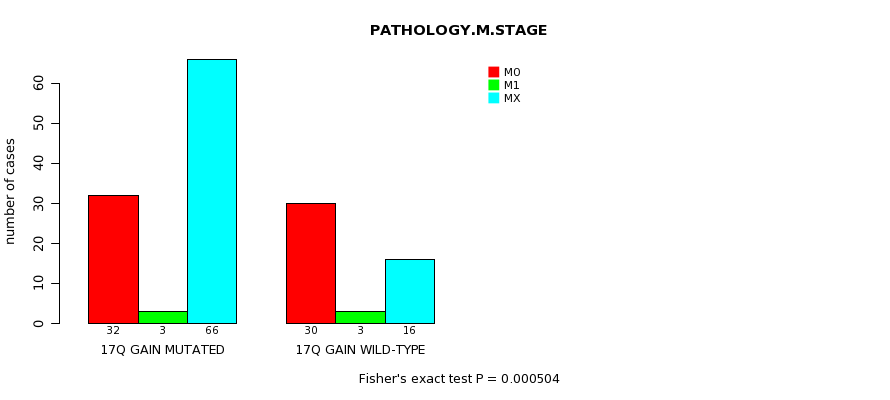
17q gain cnv correlated to 'PATHOLOGY.M.STAGE'.
-
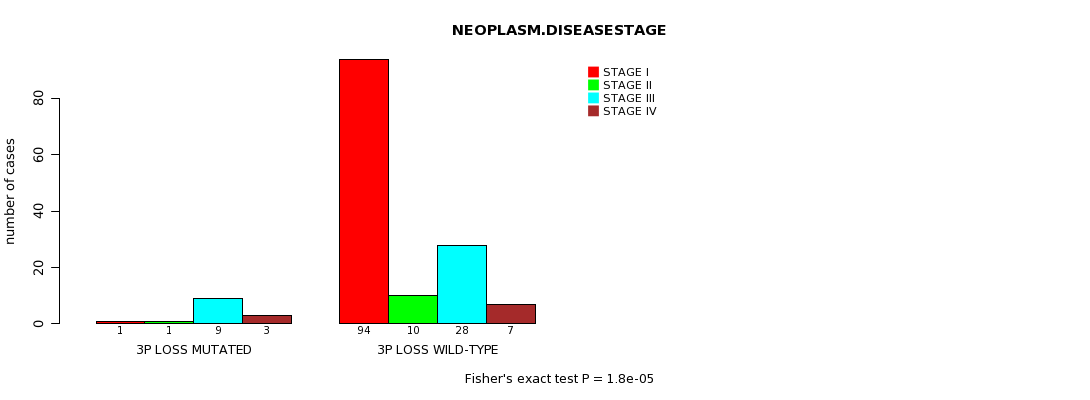
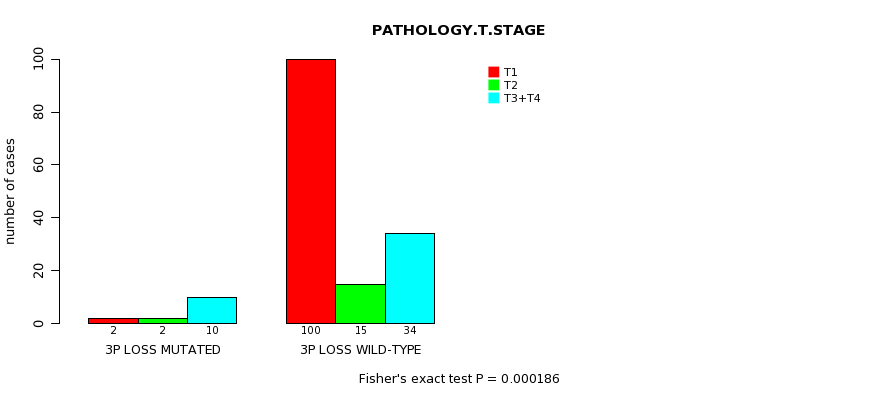
3p loss cnv correlated to 'NEOPLASM.DISEASESTAGE' and 'PATHOLOGY.T.STAGE'.
-
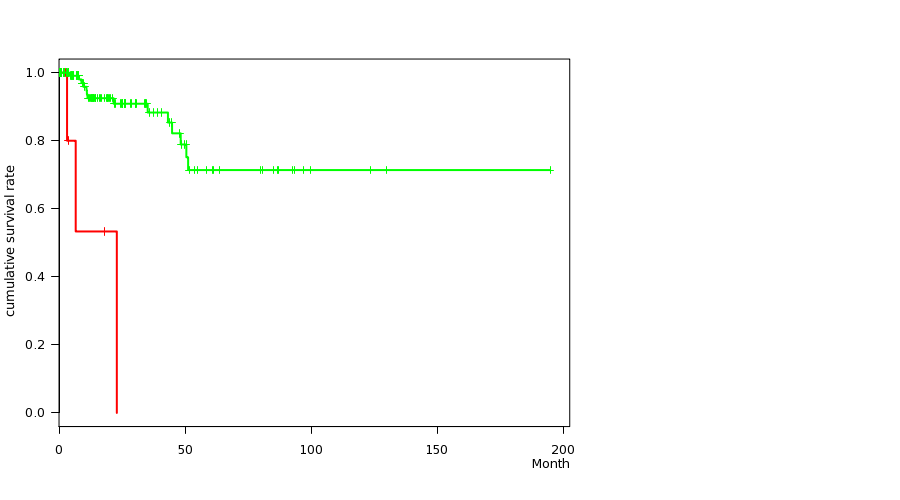
3q loss cnv correlated to 'Time to Death'.
-
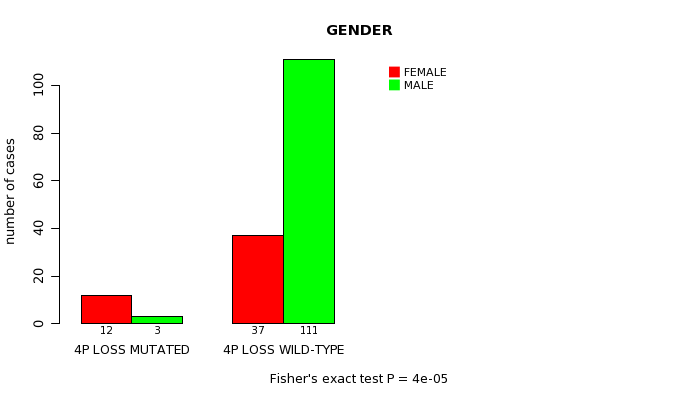
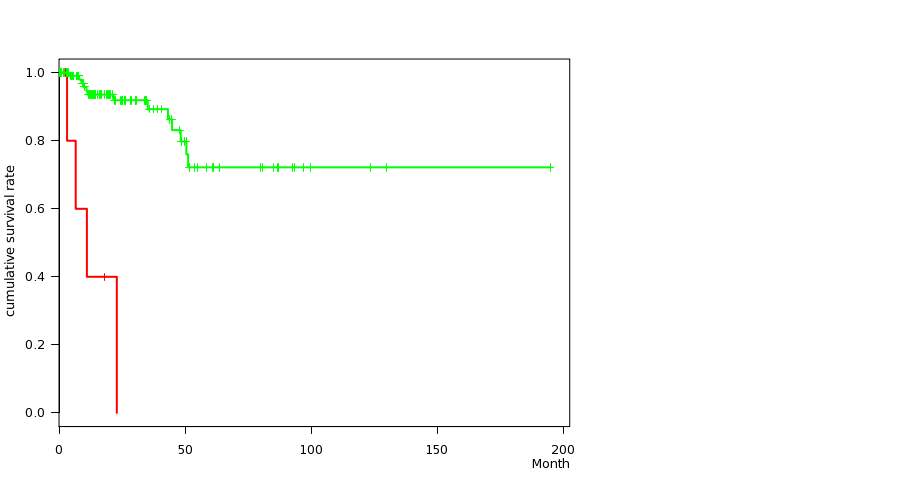
4p loss cnv correlated to 'Time to Death', 'NEOPLASM.DISEASESTAGE', 'PATHOLOGY.T.STAGE', and 'GENDER'.
-
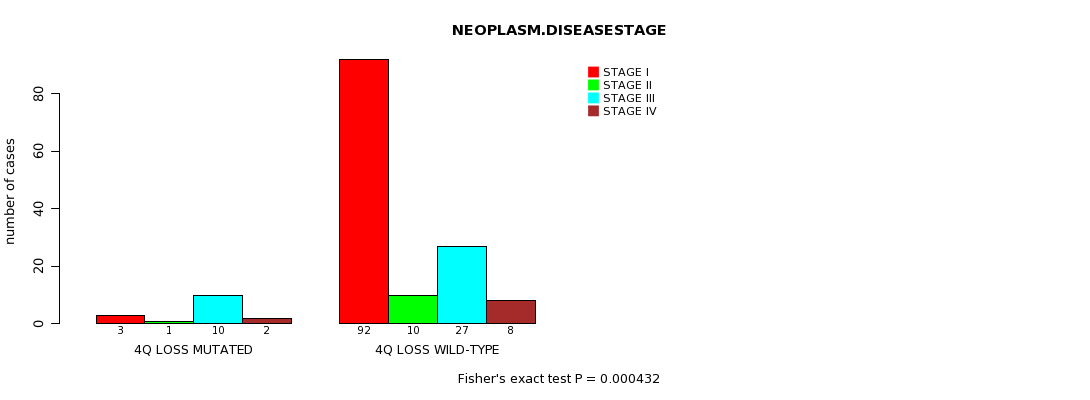
4q loss cnv correlated to 'NEOPLASM.DISEASESTAGE' and 'PATHOLOGY.T.STAGE'.
-
5p loss cnv correlated to 'Time to Death'.
-
5q loss cnv correlated to 'Time to Death'.
-
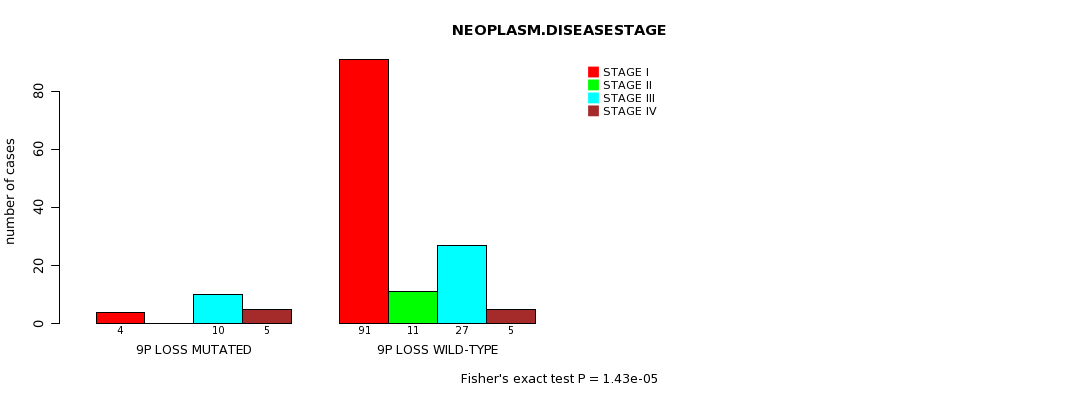
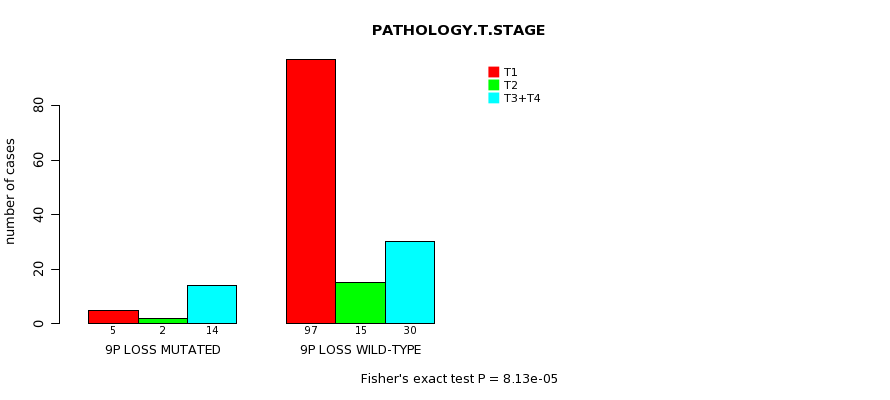
9p loss cnv correlated to 'NEOPLASM.DISEASESTAGE' and 'PATHOLOGY.T.STAGE'.
-
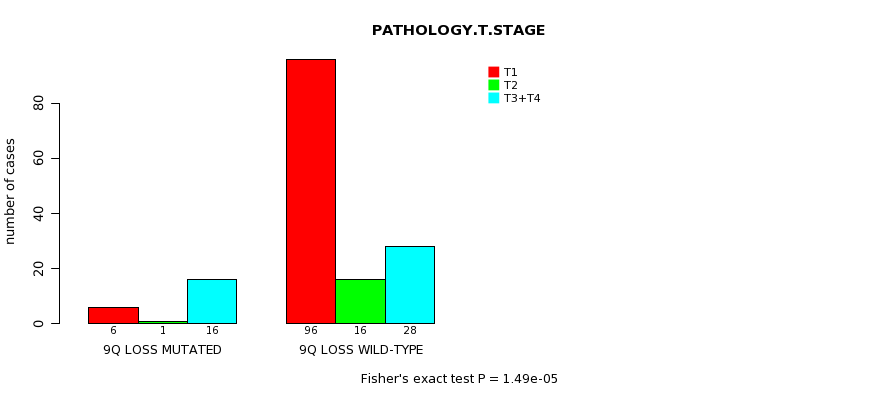
9q loss cnv correlated to 'NEOPLASM.DISEASESTAGE' and 'PATHOLOGY.T.STAGE'.
-
11q loss cnv correlated to 'Time to Death', 'NEOPLASM.DISEASESTAGE', and 'PATHOLOGY.T.STAGE'.
-
13q loss cnv correlated to 'Time to Death' and 'GENDER'.
-
15q loss cnv correlated to 'Time to Death'.
-
16p loss cnv correlated to 'Time to Death'.
-
16q loss cnv correlated to 'Time to Death'.
-
17p loss cnv correlated to 'Time to Death' and 'NEOPLASM.DISEASESTAGE'.
-
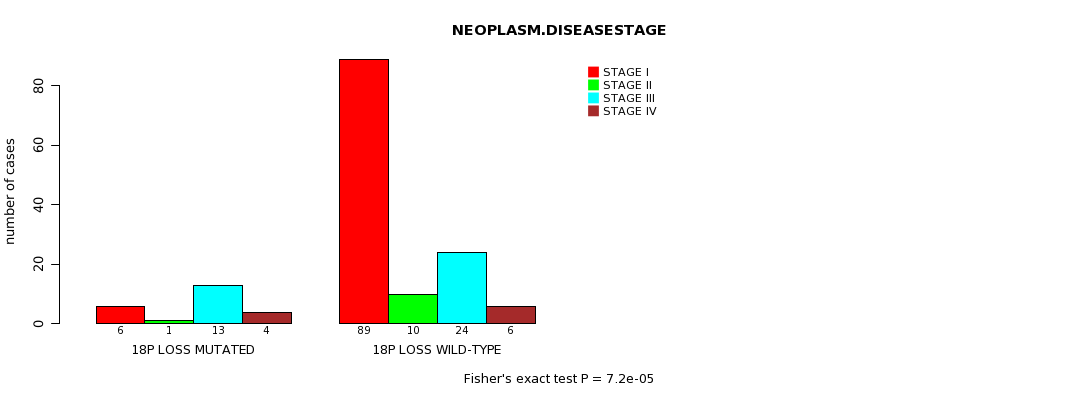
18p loss cnv correlated to 'Time to Death', 'NEOPLASM.DISEASESTAGE', and 'PATHOLOGY.T.STAGE'.
-
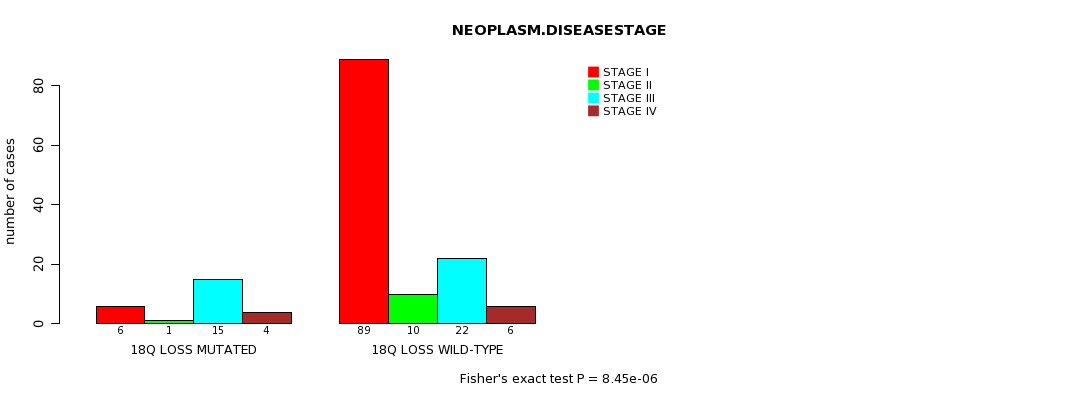
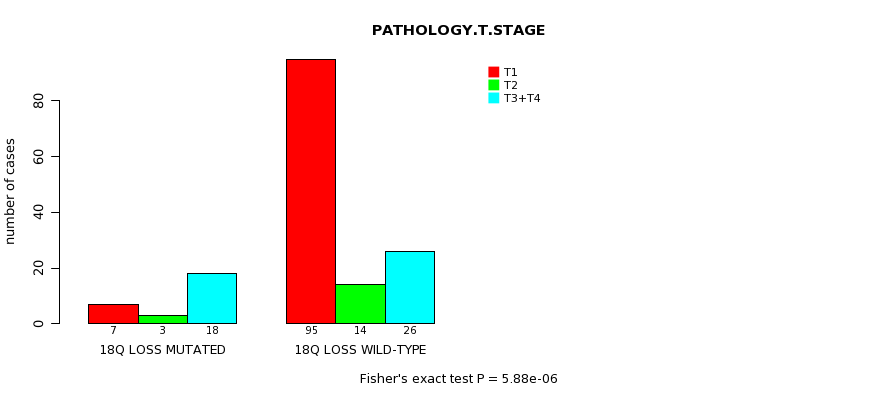
18q loss cnv correlated to 'Time to Death', 'NEOPLASM.DISEASESTAGE', and 'PATHOLOGY.T.STAGE'.
-
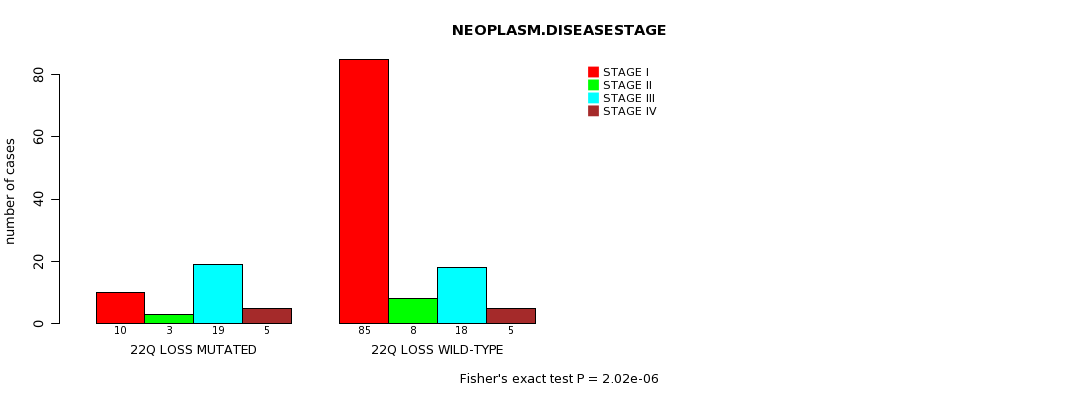
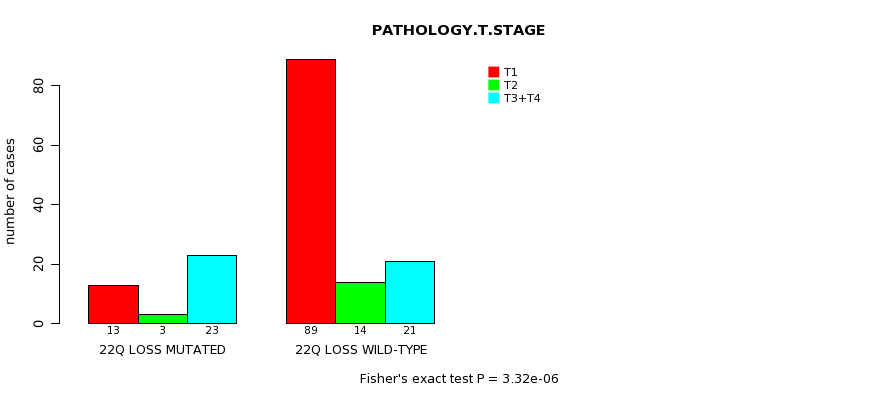
22q loss cnv correlated to 'NEOPLASM.DISEASESTAGE' and 'PATHOLOGY.T.STAGE'.
-
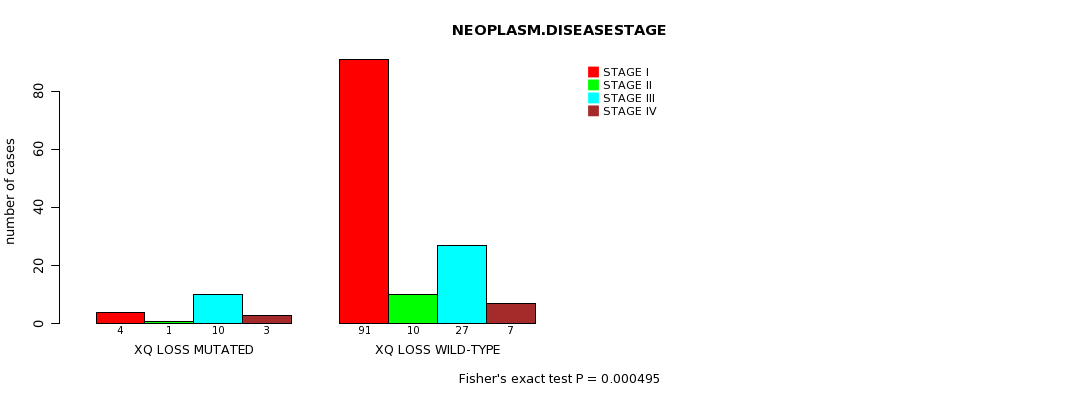
xq loss cnv correlated to 'Time to Death', 'NEOPLASM.DISEASESTAGE', and 'PATHOLOGY.T.STAGE'.
Table 1. Get Full Table Overview of the association between significant copy number variation of 69 arm-level events and 10 clinical features. Shown in the table are P values (Q values). Thresholded by Q value < 0.25, 47 significant findings detected.
|
Clinical Features |
Time to Death |
AGE |
NEOPLASM DISEASESTAGE |
PATHOLOGY T STAGE |
PATHOLOGY N STAGE |
PATHOLOGY M STAGE |
GENDER |
KARNOFSKY PERFORMANCE SCORE |
NUMBERPACKYEARSSMOKED | YEAROFTOBACCOSMOKINGONSET | ||
| nCNV (%) | nWild-Type | logrank test | t-test | Fisher's exact test | Fisher's exact test | Fisher's exact test | Fisher's exact test | Fisher's exact test | t-test | t-test | t-test | |
| 4p loss | 15 (9%) | 148 |
0.000358 (0.177) |
0.00867 (1.00) |
5.58e-05 (0.0283) |
1.58e-05 (0.00818) |
0.00898 (1.00) |
0.536 (1.00) |
4e-05 (0.0204) |
0.792 (1.00) |
||
| 1q gain | 13 (8%) | 150 |
3.52e-05 (0.018) |
0.666 (1.00) |
1.29e-05 (0.00671) |
3.26e-05 (0.0168) |
0.408 (1.00) |
0.133 (1.00) |
0.0629 (1.00) |
0.478 (1.00) |
||
| 11q loss | 14 (9%) | 149 |
2.48e-05 (0.0128) |
0.331 (1.00) |
0.000129 (0.0644) |
5.22e-05 (0.0266) |
0.0641 (1.00) |
0.0824 (1.00) |
0.36 (1.00) |
0.792 (1.00) |
||
| 18p loss | 26 (16%) | 137 |
5.21e-05 (0.0266) |
0.18 (1.00) |
7.2e-05 (0.0363) |
5.11e-06 (0.0027) |
0.0607 (1.00) |
0.0774 (1.00) |
0.063 (1.00) |
0.724 (1.00) |
||
| 18q loss | 28 (17%) | 135 |
5.21e-05 (0.0266) |
0.28 (1.00) |
8.45e-06 (0.00444) |
5.88e-06 (0.0031) |
0.029 (1.00) |
0.0938 (1.00) |
0.0442 (1.00) |
0.724 (1.00) |
||
| xq loss | 20 (12%) | 143 |
6.67e-05 (0.0337) |
0.174 (1.00) |
0.000495 (0.243) |
0.000194 (0.0965) |
0.0526 (1.00) |
0.213 (1.00) |
0.0169 (1.00) |
0.469 (1.00) |
||
| 17p gain | 99 (61%) | 64 |
0.0569 (1.00) |
0.0561 (1.00) |
1.59e-05 (0.00826) |
0.000589 (0.289) |
0.215 (1.00) |
1.07e-05 (0.00561) |
0.0546 (1.00) |
0.254 (1.00) |
0.369 (1.00) |
|
| 3p loss | 14 (9%) | 149 |
0.0103 (1.00) |
0.177 (1.00) |
1.8e-05 (0.0093) |
0.000186 (0.0926) |
0.669 (1.00) |
0.11 (1.00) |
0.761 (1.00) |
0.792 (1.00) |
0.453 (1.00) |
|
| 4q loss | 16 (10%) | 147 |
0.0112 (1.00) |
0.0535 (1.00) |
0.000432 (0.213) |
0.000146 (0.073) |
0.0698 (1.00) |
0.165 (1.00) |
0.000894 (0.435) |
0.754 (1.00) |
||
| 9p loss | 21 (13%) | 142 |
0.00952 (1.00) |
0.561 (1.00) |
1.43e-05 (0.00744) |
8.13e-05 (0.0409) |
0.119 (1.00) |
0.034 (1.00) |
0.00886 (1.00) |
0.314 (1.00) |
||
| 9q loss | 23 (14%) | 140 |
0.00179 (0.862) |
0.587 (1.00) |
5.93e-05 (0.03) |
1.49e-05 (0.00777) |
0.0607 (1.00) |
0.24 (1.00) |
0.0248 (1.00) |
0.325 (1.00) |
||
| 13q loss | 16 (10%) | 147 |
1.05e-05 (0.00549) |
0.0404 (1.00) |
0.00285 (1.00) |
0.000696 (0.34) |
0.0444 (1.00) |
0.489 (1.00) |
0.000123 (0.0618) |
0.467 (1.00) |
||
| 17p loss | 8 (5%) | 155 |
4.03e-14 (2.16e-11) |
0.753 (1.00) |
0.000306 (0.152) |
0.00691 (1.00) |
0.00807 (1.00) |
0.0499 (1.00) |
0.0538 (1.00) |
0.478 (1.00) |
||
| 22q loss | 39 (24%) | 124 |
0.0393 (1.00) |
0.395 (1.00) |
2.02e-06 (0.00107) |
3.32e-06 (0.00176) |
0.0619 (1.00) |
0.185 (1.00) |
0.00138 (0.669) |
0.447 (1.00) |
||
| 1p gain | 4 (2%) | 159 |
7.98e-06 (0.0042) |
0.444 (1.00) |
0.0212 (1.00) |
0.0129 (1.00) |
0.0803 (1.00) |
0.18 (1.00) |
0.0816 (1.00) |
|||
| 6q gain | 5 (3%) | 158 |
1.53e-09 (8.19e-07) |
0.166 (1.00) |
0.0285 (1.00) |
0.0441 (1.00) |
0.0803 (1.00) |
0.0127 (1.00) |
0.637 (1.00) |
0.548 (1.00) |
||
| 7p gain | 95 (58%) | 68 |
0.0607 (1.00) |
0.466 (1.00) |
0.000467 (0.23) |
0.0068 (1.00) |
0.662 (1.00) |
0.223 (1.00) |
0.123 (1.00) |
0.159 (1.00) |
0.354 (1.00) |
0.837 (1.00) |
| 7q gain | 96 (59%) | 67 |
0.0546 (1.00) |
0.402 (1.00) |
0.000276 (0.137) |
0.00554 (1.00) |
0.54 (1.00) |
0.314 (1.00) |
0.118 (1.00) |
0.159 (1.00) |
0.354 (1.00) |
0.837 (1.00) |
| 8q gain | 15 (9%) | 148 |
1.56e-06 (0.000828) |
0.789 (1.00) |
0.00568 (1.00) |
0.00185 (0.888) |
0.0444 (1.00) |
0.349 (1.00) |
0.0715 (1.00) |
0.566 (1.00) |
||
| 17q gain | 112 (69%) | 51 |
0.481 (1.00) |
0.124 (1.00) |
0.0431 (1.00) |
0.144 (1.00) |
0.443 (1.00) |
0.000504 (0.247) |
0.199 (1.00) |
0.667 (1.00) |
||
| 3q loss | 4 (2%) | 159 |
3.96e-11 (2.12e-08) |
0.21 (1.00) |
0.00511 (1.00) |
0.0129 (1.00) |
0.192 (1.00) |
0.18 (1.00) |
0.584 (1.00) |
|||
| 5p loss | 7 (4%) | 156 |
1.91e-10 (1.02e-07) |
0.0911 (1.00) |
0.0161 (1.00) |
0.0045 (1.00) |
0.0396 (1.00) |
0.163 (1.00) |
0.0262 (1.00) |
|||
| 5q loss | 7 (4%) | 156 |
8.61e-08 (4.58e-05) |
0.0351 (1.00) |
0.0272 (1.00) |
0.0045 (1.00) |
0.0152 (1.00) |
0.163 (1.00) |
0.0262 (1.00) |
|||
| 15q loss | 18 (11%) | 145 |
2.65e-08 (1.41e-05) |
0.119 (1.00) |
0.00732 (1.00) |
0.00478 (1.00) |
0.112 (1.00) |
0.125 (1.00) |
0.178 (1.00) |
0.666 (1.00) |
||
| 16p loss | 4 (2%) | 159 |
3.35e-05 (0.0172) |
0.648 (1.00) |
0.13 (1.00) |
0.115 (1.00) |
1 (1.00) |
0.0816 (1.00) |
||||
| 16q loss | 5 (3%) | 158 |
3.35e-05 (0.0172) |
0.316 (1.00) |
0.0748 (1.00) |
0.205 (1.00) |
0.273 (1.00) |
1 (1.00) |
0.161 (1.00) |
|||
| 2p gain | 31 (19%) | 132 |
0.259 (1.00) |
0.34 (1.00) |
0.0987 (1.00) |
0.76 (1.00) |
0.669 (1.00) |
0.00328 (1.00) |
0.516 (1.00) |
0.534 (1.00) |
0.331 (1.00) |
0.477 (1.00) |
| 2q gain | 33 (20%) | 130 |
0.392 (1.00) |
0.695 (1.00) |
0.0242 (1.00) |
0.799 (1.00) |
0.223 (1.00) |
0.00479 (1.00) |
0.4 (1.00) |
0.531 (1.00) |
0.331 (1.00) |
0.477 (1.00) |
| 3p gain | 46 (28%) | 117 |
0.415 (1.00) |
0.763 (1.00) |
0.0508 (1.00) |
0.0326 (1.00) |
1 (1.00) |
0.381 (1.00) |
0.85 (1.00) |
0.0416 (1.00) |
0.368 (1.00) |
|
| 3q gain | 55 (34%) | 108 |
0.17 (1.00) |
0.464 (1.00) |
0.161 (1.00) |
0.0885 (1.00) |
1 (1.00) |
0.169 (1.00) |
0.718 (1.00) |
0.113 (1.00) |
0.357 (1.00) |
|
| 4p gain | 6 (4%) | 157 |
0.0202 (1.00) |
0.00484 (1.00) |
0.0433 (1.00) |
0.542 (1.00) |
0.501 (1.00) |
0.18 (1.00) |
0.669 (1.00) |
|||
| 4q gain | 5 (3%) | 158 |
0.333 (1.00) |
0.0155 (1.00) |
0.259 (1.00) |
0.612 (1.00) |
0.167 (1.00) |
0.69 (1.00) |
1 (1.00) |
|||
| 5p gain | 24 (15%) | 139 |
0.679 (1.00) |
0.893 (1.00) |
0.202 (1.00) |
0.137 (1.00) |
0.558 (1.00) |
0.385 (1.00) |
0.637 (1.00) |
0.401 (1.00) |
||
| 5q gain | 24 (15%) | 139 |
0.679 (1.00) |
0.422 (1.00) |
0.202 (1.00) |
0.327 (1.00) |
1 (1.00) |
0.385 (1.00) |
0.637 (1.00) |
0.401 (1.00) |
||
| 6p gain | 7 (4%) | 156 |
0.00143 (0.691) |
0.577 (1.00) |
0.00775 (1.00) |
0.0045 (1.00) |
0.277 (1.00) |
0.0257 (1.00) |
1 (1.00) |
0.548 (1.00) |
||
| 8p gain | 11 (7%) | 152 |
0.00353 (1.00) |
0.969 (1.00) |
0.165 (1.00) |
0.0845 (1.00) |
0.296 (1.00) |
0.848 (1.00) |
0.308 (1.00) |
|||
| 9p gain | 3 (2%) | 160 |
0.107 (1.00) |
0.931 (1.00) |
0.0557 (1.00) |
0.0704 (1.00) |
0.627 (1.00) |
1 (1.00) |
||||
| 10p gain | 5 (3%) | 158 |
0.465 (1.00) |
0.927 (1.00) |
0.162 (1.00) |
0.377 (1.00) |
0.321 (1.00) |
1 (1.00) |
||||
| 10q gain | 5 (3%) | 158 |
0.465 (1.00) |
0.927 (1.00) |
0.162 (1.00) |
0.377 (1.00) |
0.321 (1.00) |
1 (1.00) |
||||
| 11p gain | 8 (5%) | 155 |
0.0524 (1.00) |
0.638 (1.00) |
0.0363 (1.00) |
0.0404 (1.00) |
0.588 (1.00) |
0.0191 (1.00) |
0.698 (1.00) |
|||
| 11q gain | 7 (4%) | 156 |
0.466 (1.00) |
0.449 (1.00) |
0.186 (1.00) |
0.0625 (1.00) |
0.738 (1.00) |
0.163 (1.00) |
0.199 (1.00) |
|||
| 12p gain | 66 (40%) | 97 |
0.804 (1.00) |
0.681 (1.00) |
0.319 (1.00) |
0.601 (1.00) |
0.818 (1.00) |
0.126 (1.00) |
0.0233 (1.00) |
0.847 (1.00) |
0.29 (1.00) |
|
| 12q gain | 66 (40%) | 97 |
0.804 (1.00) |
0.681 (1.00) |
0.319 (1.00) |
0.601 (1.00) |
0.818 (1.00) |
0.126 (1.00) |
0.0233 (1.00) |
0.847 (1.00) |
0.29 (1.00) |
|
| 13q gain | 18 (11%) | 145 |
0.906 (1.00) |
0.762 (1.00) |
0.601 (1.00) |
0.804 (1.00) |
0.738 (1.00) |
1 (1.00) |
0.788 (1.00) |
0.153 (1.00) |
||
| 14q gain | 3 (2%) | 160 |
0.069 (1.00) |
0.0281 (1.00) |
0.627 (1.00) |
0.215 (1.00) |
||||||
| 15q gain | 4 (2%) | 159 |
0.478 (1.00) |
0.588 (1.00) |
0.486 (1.00) |
0.412 (1.00) |
0.69 (1.00) |
0.584 (1.00) |
||||
| 16p gain | 86 (53%) | 77 |
0.785 (1.00) |
0.158 (1.00) |
0.792 (1.00) |
0.943 (1.00) |
1 (1.00) |
0.323 (1.00) |
0.01 (1.00) |
0.674 (1.00) |
0.369 (1.00) |
|
| 16q gain | 83 (51%) | 80 |
0.227 (1.00) |
0.353 (1.00) |
0.545 (1.00) |
0.513 (1.00) |
0.742 (1.00) |
0.081 (1.00) |
0.0597 (1.00) |
0.207 (1.00) |
0.369 (1.00) |
|
| 18p gain | 8 (5%) | 155 |
0.888 (1.00) |
0.903 (1.00) |
0.294 (1.00) |
0.545 (1.00) |
0.149 (1.00) |
1 (1.00) |
0.548 (1.00) |
|||
| 18q gain | 5 (3%) | 158 |
0.355 (1.00) |
0.962 (1.00) |
0.59 (1.00) |
0.612 (1.00) |
0.419 (1.00) |
1 (1.00) |
||||
| 19p gain | 3 (2%) | 160 |
0.626 (1.00) |
0.344 (1.00) |
0.481 (1.00) |
0.438 (1.00) |
1 (1.00) |
0.627 (1.00) |
1 (1.00) |
|||
| 19q gain | 3 (2%) | 160 |
0.626 (1.00) |
0.344 (1.00) |
0.481 (1.00) |
0.438 (1.00) |
1 (1.00) |
0.627 (1.00) |
1 (1.00) |
|||
| 20p gain | 55 (34%) | 108 |
0.635 (1.00) |
0.148 (1.00) |
0.51 (1.00) |
0.476 (1.00) |
0.787 (1.00) |
0.867 (1.00) |
0.594 (1.00) |
0.641 (1.00) |
||
| 20q gain | 57 (35%) | 106 |
0.38 (1.00) |
0.116 (1.00) |
0.224 (1.00) |
0.271 (1.00) |
0.512 (1.00) |
1 (1.00) |
0.591 (1.00) |
0.641 (1.00) |
||
| 21q gain | 9 (6%) | 154 |
0.011 (1.00) |
0.0647 (1.00) |
1 (1.00) |
1 (1.00) |
0.192 (1.00) |
1 (1.00) |
0.905 (1.00) |
|||
| xq gain | 51 (31%) | 112 |
0.577 (1.00) |
0.738 (1.00) |
0.00285 (1.00) |
0.00676 (1.00) |
0.608 (1.00) |
0.337 (1.00) |
0.065 (1.00) |
0.268 (1.00) |
0.373 (1.00) |
|
| 1p loss | 20 (12%) | 143 |
0.0379 (1.00) |
0.815 (1.00) |
0.0626 (1.00) |
0.124 (1.00) |
0.296 (1.00) |
0.915 (1.00) |
0.308 (1.00) |
0.13 (1.00) |
||
| 1q loss | 11 (7%) | 152 |
0.506 (1.00) |
0.333 (1.00) |
0.268 (1.00) |
0.577 (1.00) |
0.654 (1.00) |
0.467 (1.00) |
0.735 (1.00) |
0.314 (1.00) |
||
| 6p loss | 11 (7%) | 152 |
0.0121 (1.00) |
0.428 (1.00) |
0.0275 (1.00) |
0.0295 (1.00) |
0.0582 (1.00) |
0.833 (1.00) |
0.0886 (1.00) |
0.157 (1.00) |
||
| 6q loss | 15 (9%) | 148 |
0.206 (1.00) |
0.92 (1.00) |
0.0361 (1.00) |
0.0025 (1.00) |
0.169 (1.00) |
0.347 (1.00) |
0.015 (1.00) |
0.754 (1.00) |
||
| 8p loss | 6 (4%) | 157 |
0.00199 (0.95) |
0.534 (1.00) |
0.0505 (1.00) |
0.542 (1.00) |
0.0803 (1.00) |
0.0257 (1.00) |
0.366 (1.00) |
|||
| 8q loss | 4 (2%) | 159 |
0.0317 (1.00) |
0.3 (1.00) |
0.0791 (1.00) |
0.412 (1.00) |
0.18 (1.00) |
0.584 (1.00) |
||||
| 10p loss | 11 (7%) | 152 |
0.208 (1.00) |
0.87 (1.00) |
0.00632 (1.00) |
0.0109 (1.00) |
0.0556 (1.00) |
0.0872 (1.00) |
0.308 (1.00) |
0.44 (1.00) |
||
| 10q loss | 11 (7%) | 152 |
0.15 (1.00) |
0.442 (1.00) |
0.00231 (1.00) |
0.00535 (1.00) |
0.0248 (1.00) |
0.168 (1.00) |
0.308 (1.00) |
0.355 (1.00) |
||
| 11p loss | 10 (6%) | 153 |
0.000775 (0.378) |
0.105 (1.00) |
0.0256 (1.00) |
0.0541 (1.00) |
0.192 (1.00) |
0.467 (1.00) |
0.169 (1.00) |
|||
| 14q loss | 31 (19%) | 132 |
0.0128 (1.00) |
0.991 (1.00) |
0.00198 (0.95) |
0.00514 (1.00) |
0.0776 (1.00) |
0.108 (1.00) |
0.0511 (1.00) |
0.448 (1.00) |
||
| 19p loss | 12 (7%) | 151 |
0.744 (1.00) |
0.171 (1.00) |
0.0381 (1.00) |
0.0367 (1.00) |
0.192 (1.00) |
0.263 (1.00) |
0.348 (1.00) |
0.754 (1.00) |
0.315 (1.00) |
|
| 19q loss | 11 (7%) | 152 |
0.000889 (0.433) |
0.948 (1.00) |
0.00135 (0.655) |
0.00197 (0.945) |
0.192 (1.00) |
0.134 (1.00) |
0.0886 (1.00) |
0.754 (1.00) |
||
| 21q loss | 31 (19%) | 132 |
0.577 (1.00) |
0.661 (1.00) |
0.0139 (1.00) |
0.00747 (1.00) |
0.872 (1.00) |
0.143 (1.00) |
0.129 (1.00) |
0.711 (1.00) |
0.332 (1.00) |
P value = 7.98e-06 (logrank test), Q value = 0.0042
Table S1. Gene #1: '1p gain' versus Clinical Feature #1: 'Time to Death'
| nPatients | nDeath | Duration Range (Median), Month | |
|---|---|---|---|
| ALL | 150 | 17 | 0.0 - 194.8 (14.0) |
| 1P GAIN MUTATED | 3 | 1 | 2.0 - 7.9 (3.7) |
| 1P GAIN WILD-TYPE | 147 | 16 | 0.0 - 194.8 (14.4) |
Figure S1. Get High-res Image Gene #1: '1p gain' versus Clinical Feature #1: 'Time to Death'
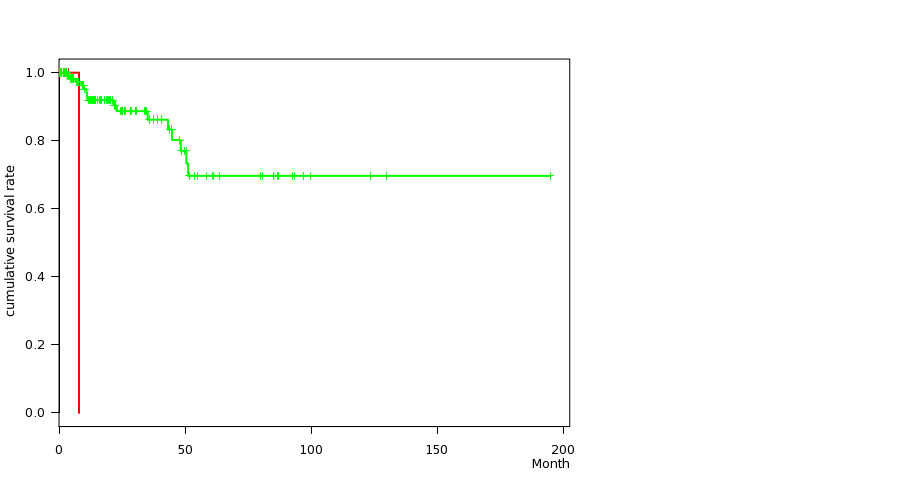
P value = 3.52e-05 (logrank test), Q value = 0.018
Table S2. Gene #2: '1q gain' versus Clinical Feature #1: 'Time to Death'
| nPatients | nDeath | Duration Range (Median), Month | |
|---|---|---|---|
| ALL | 150 | 17 | 0.0 - 194.8 (14.0) |
| 1Q GAIN MUTATED | 12 | 3 | 0.7 - 30.3 (3.8) |
| 1Q GAIN WILD-TYPE | 138 | 14 | 0.0 - 194.8 (14.9) |
Figure S2. Get High-res Image Gene #2: '1q gain' versus Clinical Feature #1: 'Time to Death'
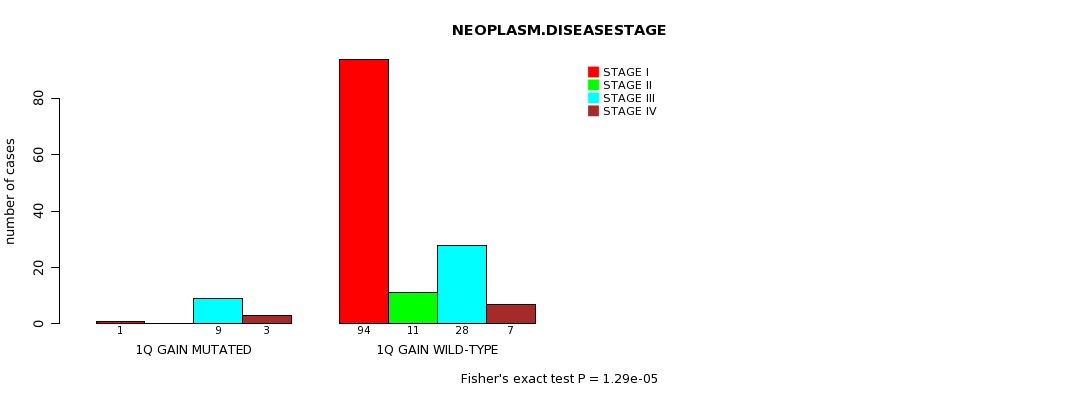
P value = 1.29e-05 (Fisher's exact test), Q value = 0.0067
Table S3. Gene #2: '1q gain' versus Clinical Feature #3: 'NEOPLASM.DISEASESTAGE'
| nPatients | STAGE I | STAGE II | STAGE III | STAGE IV |
|---|---|---|---|---|
| ALL | 95 | 11 | 37 | 10 |
| 1Q GAIN MUTATED | 1 | 0 | 9 | 3 |
| 1Q GAIN WILD-TYPE | 94 | 11 | 28 | 7 |
Figure S3. Get High-res Image Gene #2: '1q gain' versus Clinical Feature #3: 'NEOPLASM.DISEASESTAGE'
P value = 3.26e-05 (Fisher's exact test), Q value = 0.017
Table S4. Gene #2: '1q gain' versus Clinical Feature #4: 'PATHOLOGY.T.STAGE'
| nPatients | T1 | T2 | T3+T4 |
|---|---|---|---|
| ALL | 102 | 17 | 44 |
| 1Q GAIN MUTATED | 2 | 0 | 11 |
| 1Q GAIN WILD-TYPE | 100 | 17 | 33 |
Figure S4. Get High-res Image Gene #2: '1q gain' versus Clinical Feature #4: 'PATHOLOGY.T.STAGE'

P value = 1.53e-09 (logrank test), Q value = 8.2e-07
Table S5. Gene #12: '6q gain' versus Clinical Feature #1: 'Time to Death'
| nPatients | nDeath | Duration Range (Median), Month | |
|---|---|---|---|
| ALL | 150 | 17 | 0.0 - 194.8 (14.0) |
| 6Q GAIN MUTATED | 5 | 3 | 1.9 - 13.6 (7.9) |
| 6Q GAIN WILD-TYPE | 145 | 14 | 0.0 - 194.8 (14.6) |
Figure S5. Get High-res Image Gene #12: '6q gain' versus Clinical Feature #1: 'Time to Death'
P value = 0.000467 (Fisher's exact test), Q value = 0.23
Table S6. Gene #13: '7p gain' versus Clinical Feature #3: 'NEOPLASM.DISEASESTAGE'
| nPatients | STAGE I | STAGE II | STAGE III | STAGE IV |
|---|---|---|---|---|
| ALL | 95 | 11 | 37 | 10 |
| 7P GAIN MUTATED | 66 | 4 | 12 | 6 |
| 7P GAIN WILD-TYPE | 29 | 7 | 25 | 4 |
Figure S6. Get High-res Image Gene #13: '7p gain' versus Clinical Feature #3: 'NEOPLASM.DISEASESTAGE'
P value = 0.000276 (Fisher's exact test), Q value = 0.14
Table S7. Gene #14: '7q gain' versus Clinical Feature #3: 'NEOPLASM.DISEASESTAGE'
| nPatients | STAGE I | STAGE II | STAGE III | STAGE IV |
|---|---|---|---|---|
| ALL | 95 | 11 | 37 | 10 |
| 7Q GAIN MUTATED | 67 | 4 | 12 | 6 |
| 7Q GAIN WILD-TYPE | 28 | 7 | 25 | 4 |
Figure S7. Get High-res Image Gene #14: '7q gain' versus Clinical Feature #3: 'NEOPLASM.DISEASESTAGE'
P value = 1.56e-06 (logrank test), Q value = 0.00083
Table S8. Gene #16: '8q gain' versus Clinical Feature #1: 'Time to Death'
| nPatients | nDeath | Duration Range (Median), Month | |
|---|---|---|---|
| ALL | 150 | 17 | 0.0 - 194.8 (14.0) |
| 8Q GAIN MUTATED | 15 | 5 | 0.2 - 43.2 (6.6) |
| 8Q GAIN WILD-TYPE | 135 | 12 | 0.0 - 194.8 (14.7) |
Figure S8. Get High-res Image Gene #16: '8q gain' versus Clinical Feature #1: 'Time to Death'
P value = 1.59e-05 (Fisher's exact test), Q value = 0.0083
Table S9. Gene #29: '17p gain' versus Clinical Feature #3: 'NEOPLASM.DISEASESTAGE'
| nPatients | STAGE I | STAGE II | STAGE III | STAGE IV |
|---|---|---|---|---|
| ALL | 95 | 11 | 37 | 10 |
| 17P GAIN MUTATED | 70 | 6 | 13 | 2 |
| 17P GAIN WILD-TYPE | 25 | 5 | 24 | 8 |
Figure S9. Get High-res Image Gene #29: '17p gain' versus Clinical Feature #3: 'NEOPLASM.DISEASESTAGE'
P value = 1.07e-05 (Fisher's exact test), Q value = 0.0056
Table S10. Gene #29: '17p gain' versus Clinical Feature #6: 'PATHOLOGY.M.STAGE'
| nPatients | M0 | M1 | MX |
|---|---|---|---|
| ALL | 62 | 6 | 82 |
| 17P GAIN MUTATED | 26 | 1 | 62 |
| 17P GAIN WILD-TYPE | 36 | 5 | 20 |
Figure S10. Get High-res Image Gene #29: '17p gain' versus Clinical Feature #6: 'PATHOLOGY.M.STAGE'
P value = 0.000504 (Fisher's exact test), Q value = 0.25
Table S11. Gene #30: '17q gain' versus Clinical Feature #6: 'PATHOLOGY.M.STAGE'
| nPatients | M0 | M1 | MX |
|---|---|---|---|
| ALL | 62 | 6 | 82 |
| 17Q GAIN MUTATED | 32 | 3 | 66 |
| 17Q GAIN WILD-TYPE | 30 | 3 | 16 |
Figure S11. Get High-res Image Gene #30: '17q gain' versus Clinical Feature #6: 'PATHOLOGY.M.STAGE'
P value = 1.8e-05 (Fisher's exact test), Q value = 0.0093
Table S12. Gene #41: '3p loss' versus Clinical Feature #3: 'NEOPLASM.DISEASESTAGE'
| nPatients | STAGE I | STAGE II | STAGE III | STAGE IV |
|---|---|---|---|---|
| ALL | 95 | 11 | 37 | 10 |
| 3P LOSS MUTATED | 1 | 1 | 9 | 3 |
| 3P LOSS WILD-TYPE | 94 | 10 | 28 | 7 |
Figure S12. Get High-res Image Gene #41: '3p loss' versus Clinical Feature #3: 'NEOPLASM.DISEASESTAGE'
P value = 0.000186 (Fisher's exact test), Q value = 0.093
Table S13. Gene #41: '3p loss' versus Clinical Feature #4: 'PATHOLOGY.T.STAGE'
| nPatients | T1 | T2 | T3+T4 |
|---|---|---|---|
| ALL | 102 | 17 | 44 |
| 3P LOSS MUTATED | 2 | 2 | 10 |
| 3P LOSS WILD-TYPE | 100 | 15 | 34 |
Figure S13. Get High-res Image Gene #41: '3p loss' versus Clinical Feature #4: 'PATHOLOGY.T.STAGE'
P value = 3.96e-11 (logrank test), Q value = 2.1e-08
Table S14. Gene #42: '3q loss' versus Clinical Feature #1: 'Time to Death'
| nPatients | nDeath | Duration Range (Median), Month | |
|---|---|---|---|
| ALL | 150 | 17 | 0.0 - 194.8 (14.0) |
| 3Q LOSS MUTATED | 4 | 3 | 3.7 - 21.6 (6.4) |
| 3Q LOSS WILD-TYPE | 146 | 14 | 0.0 - 194.8 (14.3) |
Figure S14. Get High-res Image Gene #42: '3q loss' versus Clinical Feature #1: 'Time to Death'
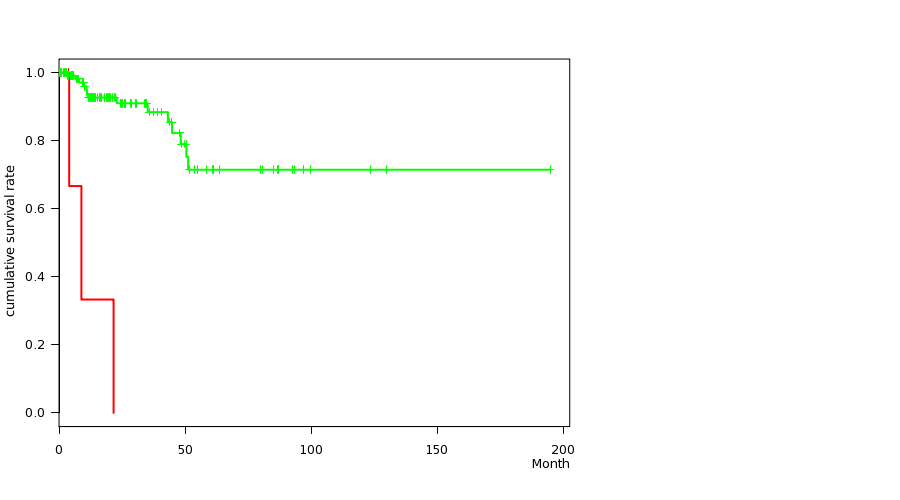
P value = 0.000358 (logrank test), Q value = 0.18
Table S15. Gene #43: '4p loss' versus Clinical Feature #1: 'Time to Death'
| nPatients | nDeath | Duration Range (Median), Month | |
|---|---|---|---|
| ALL | 150 | 17 | 0.0 - 194.8 (14.0) |
| 4P LOSS MUTATED | 14 | 4 | 0.1 - 79.9 (5.1) |
| 4P LOSS WILD-TYPE | 136 | 13 | 0.0 - 194.8 (14.9) |
Figure S15. Get High-res Image Gene #43: '4p loss' versus Clinical Feature #1: 'Time to Death'
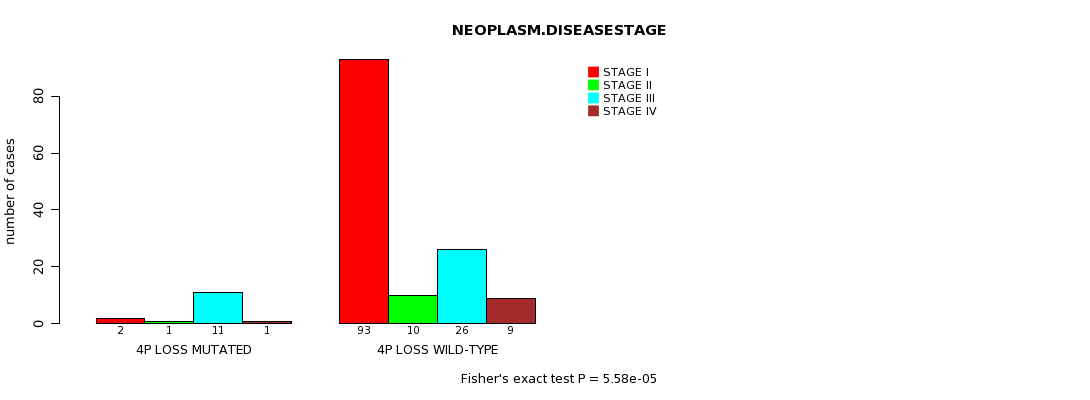
P value = 5.58e-05 (Fisher's exact test), Q value = 0.028
Table S16. Gene #43: '4p loss' versus Clinical Feature #3: 'NEOPLASM.DISEASESTAGE'
| nPatients | STAGE I | STAGE II | STAGE III | STAGE IV |
|---|---|---|---|---|
| ALL | 95 | 11 | 37 | 10 |
| 4P LOSS MUTATED | 2 | 1 | 11 | 1 |
| 4P LOSS WILD-TYPE | 93 | 10 | 26 | 9 |
Figure S16. Get High-res Image Gene #43: '4p loss' versus Clinical Feature #3: 'NEOPLASM.DISEASESTAGE'
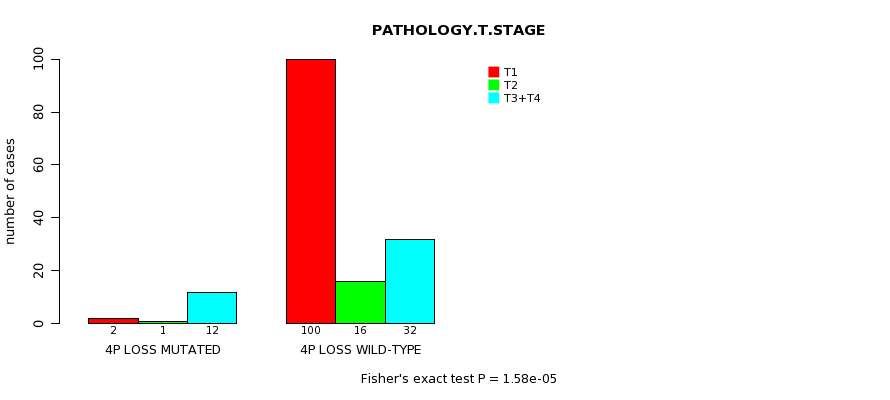
P value = 1.58e-05 (Fisher's exact test), Q value = 0.0082
Table S17. Gene #43: '4p loss' versus Clinical Feature #4: 'PATHOLOGY.T.STAGE'
| nPatients | T1 | T2 | T3+T4 |
|---|---|---|---|
| ALL | 102 | 17 | 44 |
| 4P LOSS MUTATED | 2 | 1 | 12 |
| 4P LOSS WILD-TYPE | 100 | 16 | 32 |
Figure S17. Get High-res Image Gene #43: '4p loss' versus Clinical Feature #4: 'PATHOLOGY.T.STAGE'
P value = 4e-05 (Fisher's exact test), Q value = 0.02
Table S18. Gene #43: '4p loss' versus Clinical Feature #7: 'GENDER'
| nPatients | FEMALE | MALE |
|---|---|---|
| ALL | 49 | 114 |
| 4P LOSS MUTATED | 12 | 3 |
| 4P LOSS WILD-TYPE | 37 | 111 |
Figure S18. Get High-res Image Gene #43: '4p loss' versus Clinical Feature #7: 'GENDER'
P value = 0.000432 (Fisher's exact test), Q value = 0.21
Table S19. Gene #44: '4q loss' versus Clinical Feature #3: 'NEOPLASM.DISEASESTAGE'
| nPatients | STAGE I | STAGE II | STAGE III | STAGE IV |
|---|---|---|---|---|
| ALL | 95 | 11 | 37 | 10 |
| 4Q LOSS MUTATED | 3 | 1 | 10 | 2 |
| 4Q LOSS WILD-TYPE | 92 | 10 | 27 | 8 |
Figure S19. Get High-res Image Gene #44: '4q loss' versus Clinical Feature #3: 'NEOPLASM.DISEASESTAGE'
P value = 0.000146 (Fisher's exact test), Q value = 0.073
Table S20. Gene #44: '4q loss' versus Clinical Feature #4: 'PATHOLOGY.T.STAGE'
| nPatients | T1 | T2 | T3+T4 |
|---|---|---|---|
| ALL | 102 | 17 | 44 |
| 4Q LOSS MUTATED | 3 | 2 | 11 |
| 4Q LOSS WILD-TYPE | 99 | 15 | 33 |
Figure S20. Get High-res Image Gene #44: '4q loss' versus Clinical Feature #4: 'PATHOLOGY.T.STAGE'

P value = 1.91e-10 (logrank test), Q value = 1e-07
Table S21. Gene #45: '5p loss' versus Clinical Feature #1: 'Time to Death'
| nPatients | nDeath | Duration Range (Median), Month | |
|---|---|---|---|
| ALL | 150 | 17 | 0.0 - 194.8 (14.0) |
| 5P LOSS MUTATED | 7 | 4 | 0.7 - 22.9 (6.6) |
| 5P LOSS WILD-TYPE | 143 | 13 | 0.0 - 194.8 (14.4) |
Figure S21. Get High-res Image Gene #45: '5p loss' versus Clinical Feature #1: 'Time to Death'
P value = 8.61e-08 (logrank test), Q value = 4.6e-05
Table S22. Gene #46: '5q loss' versus Clinical Feature #1: 'Time to Death'
| nPatients | nDeath | Duration Range (Median), Month | |
|---|---|---|---|
| ALL | 150 | 17 | 0.0 - 194.8 (14.0) |
| 5Q LOSS MUTATED | 7 | 3 | 0.7 - 22.9 (3.7) |
| 5Q LOSS WILD-TYPE | 143 | 14 | 0.0 - 194.8 (14.4) |
Figure S22. Get High-res Image Gene #46: '5q loss' versus Clinical Feature #1: 'Time to Death'
P value = 1.43e-05 (Fisher's exact test), Q value = 0.0074
Table S23. Gene #51: '9p loss' versus Clinical Feature #3: 'NEOPLASM.DISEASESTAGE'
| nPatients | STAGE I | STAGE II | STAGE III | STAGE IV |
|---|---|---|---|---|
| ALL | 95 | 11 | 37 | 10 |
| 9P LOSS MUTATED | 4 | 0 | 10 | 5 |
| 9P LOSS WILD-TYPE | 91 | 11 | 27 | 5 |
Figure S23. Get High-res Image Gene #51: '9p loss' versus Clinical Feature #3: 'NEOPLASM.DISEASESTAGE'
P value = 8.13e-05 (Fisher's exact test), Q value = 0.041
Table S24. Gene #51: '9p loss' versus Clinical Feature #4: 'PATHOLOGY.T.STAGE'
| nPatients | T1 | T2 | T3+T4 |
|---|---|---|---|
| ALL | 102 | 17 | 44 |
| 9P LOSS MUTATED | 5 | 2 | 14 |
| 9P LOSS WILD-TYPE | 97 | 15 | 30 |
Figure S24. Get High-res Image Gene #51: '9p loss' versus Clinical Feature #4: 'PATHOLOGY.T.STAGE'
P value = 5.93e-05 (Fisher's exact test), Q value = 0.03
Table S25. Gene #52: '9q loss' versus Clinical Feature #3: 'NEOPLASM.DISEASESTAGE'
| nPatients | STAGE I | STAGE II | STAGE III | STAGE IV |
|---|---|---|---|---|
| ALL | 95 | 11 | 37 | 10 |
| 9Q LOSS MUTATED | 5 | 1 | 12 | 4 |
| 9Q LOSS WILD-TYPE | 90 | 10 | 25 | 6 |
Figure S25. Get High-res Image Gene #52: '9q loss' versus Clinical Feature #3: 'NEOPLASM.DISEASESTAGE'

P value = 1.49e-05 (Fisher's exact test), Q value = 0.0078
Table S26. Gene #52: '9q loss' versus Clinical Feature #4: 'PATHOLOGY.T.STAGE'
| nPatients | T1 | T2 | T3+T4 |
|---|---|---|---|
| ALL | 102 | 17 | 44 |
| 9Q LOSS MUTATED | 6 | 1 | 16 |
| 9Q LOSS WILD-TYPE | 96 | 16 | 28 |
Figure S26. Get High-res Image Gene #52: '9q loss' versus Clinical Feature #4: 'PATHOLOGY.T.STAGE'
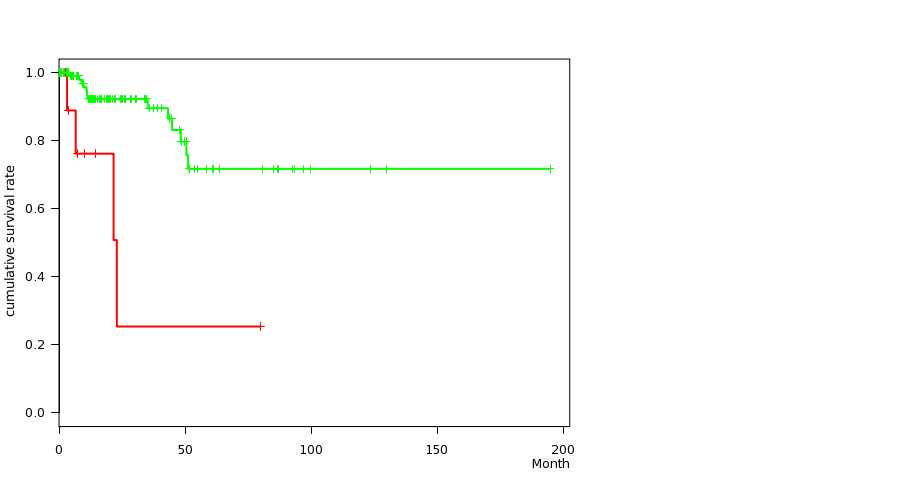
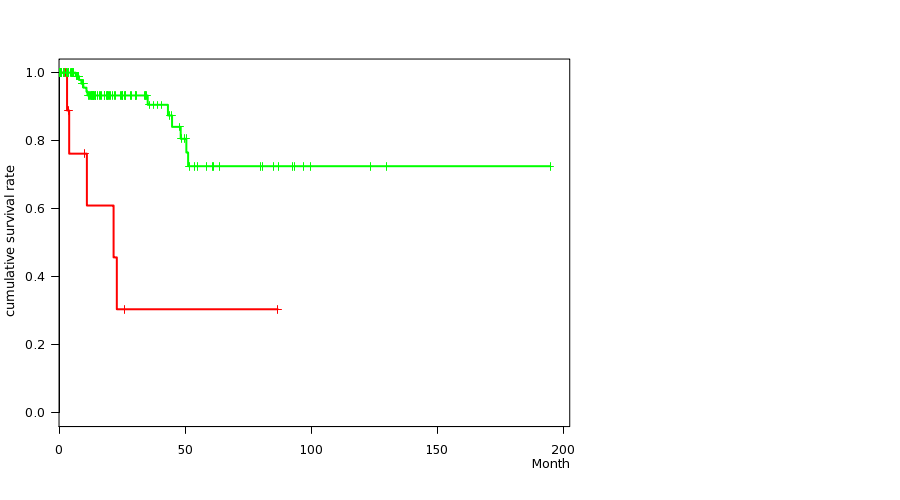
P value = 2.48e-05 (logrank test), Q value = 0.013
Table S27. Gene #56: '11q loss' versus Clinical Feature #1: 'Time to Death'
| nPatients | nDeath | Duration Range (Median), Month | |
|---|---|---|---|
| ALL | 150 | 17 | 0.0 - 194.8 (14.0) |
| 11Q LOSS MUTATED | 13 | 5 | 0.1 - 123.6 (8.9) |
| 11Q LOSS WILD-TYPE | 137 | 12 | 0.0 - 194.8 (14.6) |
Figure S27. Get High-res Image Gene #56: '11q loss' versus Clinical Feature #1: 'Time to Death'
P value = 0.000129 (Fisher's exact test), Q value = 0.064
Table S28. Gene #56: '11q loss' versus Clinical Feature #3: 'NEOPLASM.DISEASESTAGE'
| nPatients | STAGE I | STAGE II | STAGE III | STAGE IV |
|---|---|---|---|---|
| ALL | 95 | 11 | 37 | 10 |
| 11Q LOSS MUTATED | 2 | 1 | 7 | 4 |
| 11Q LOSS WILD-TYPE | 93 | 10 | 30 | 6 |
Figure S28. Get High-res Image Gene #56: '11q loss' versus Clinical Feature #3: 'NEOPLASM.DISEASESTAGE'
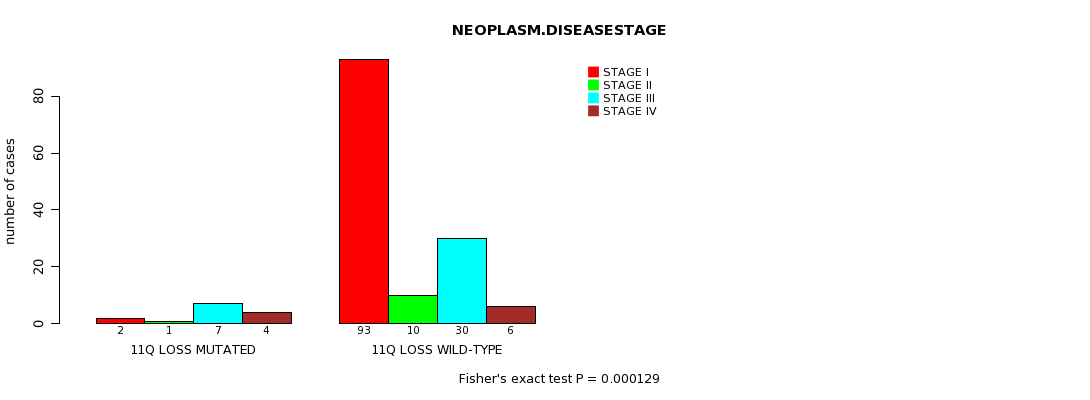
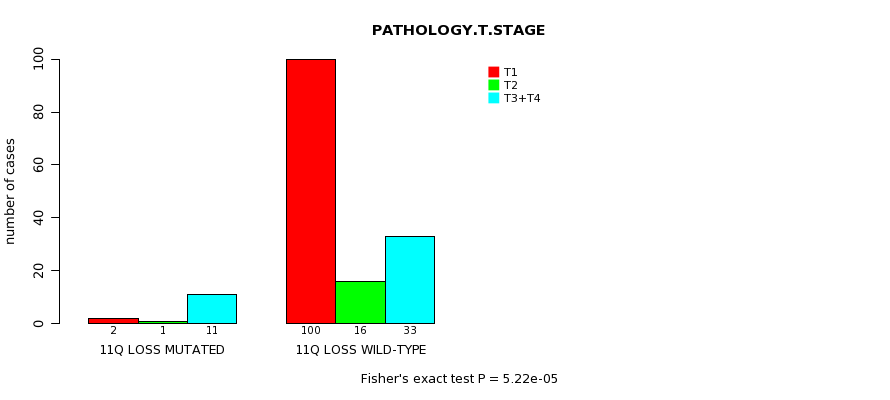
P value = 5.22e-05 (Fisher's exact test), Q value = 0.027
Table S29. Gene #56: '11q loss' versus Clinical Feature #4: 'PATHOLOGY.T.STAGE'
| nPatients | T1 | T2 | T3+T4 |
|---|---|---|---|
| ALL | 102 | 17 | 44 |
| 11Q LOSS MUTATED | 2 | 1 | 11 |
| 11Q LOSS WILD-TYPE | 100 | 16 | 33 |
Figure S29. Get High-res Image Gene #56: '11q loss' versus Clinical Feature #4: 'PATHOLOGY.T.STAGE'
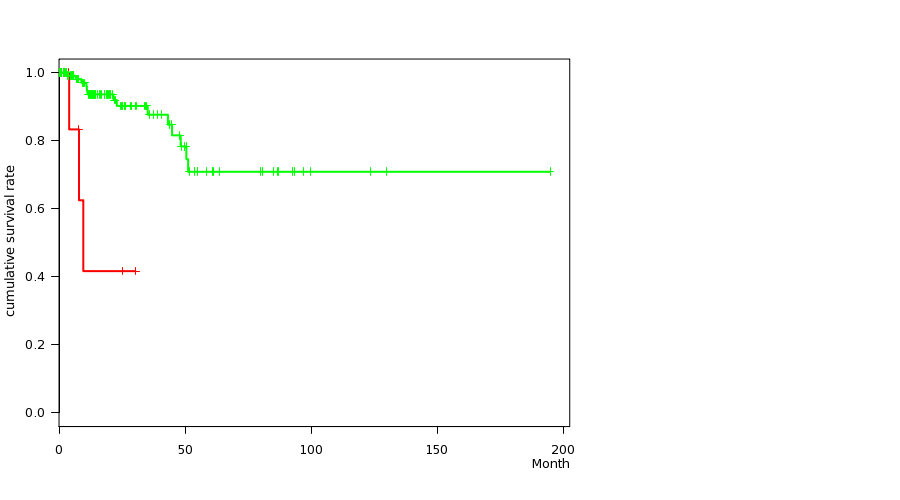
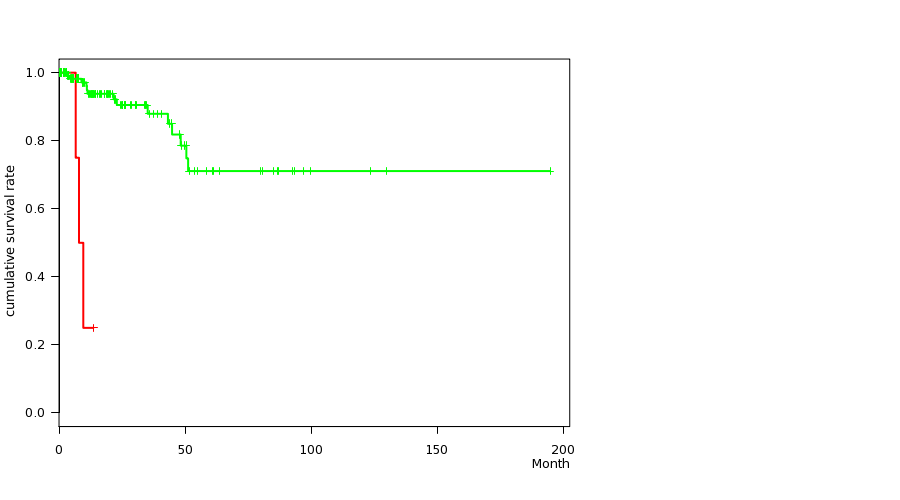
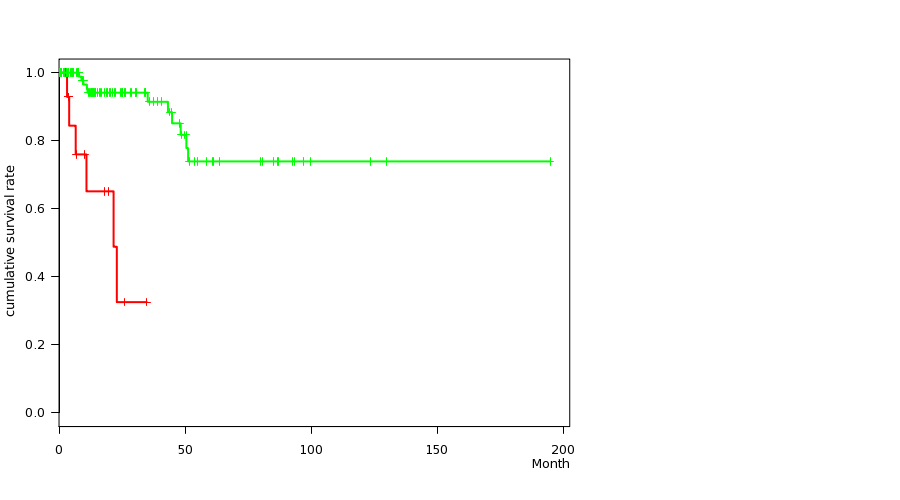
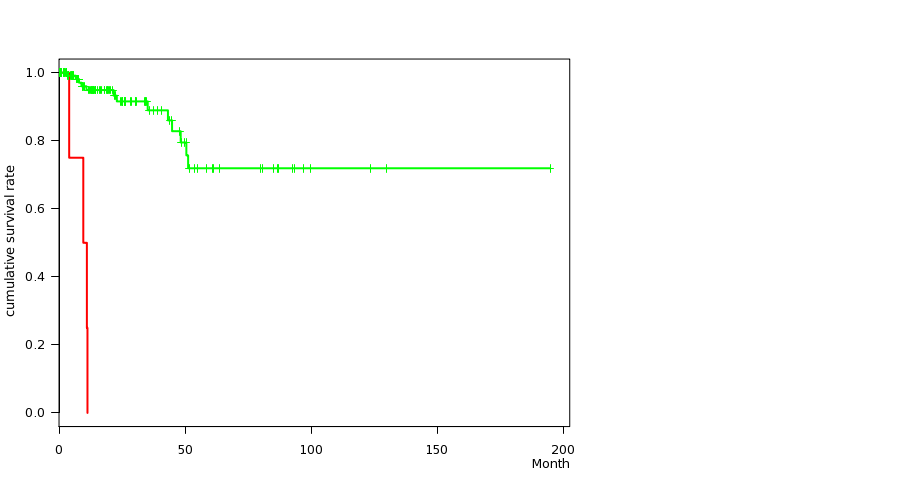
P value = 1.05e-05 (logrank test), Q value = 0.0055
Table S30. Gene #57: '13q loss' versus Clinical Feature #1: 'Time to Death'
| nPatients | nDeath | Duration Range (Median), Month | |
|---|---|---|---|
| ALL | 150 | 17 | 0.0 - 194.8 (14.0) |
| 13Q LOSS MUTATED | 16 | 5 | 0.1 - 86.8 (3.4) |
| 13Q LOSS WILD-TYPE | 134 | 12 | 0.0 - 194.8 (14.9) |
Figure S30. Get High-res Image Gene #57: '13q loss' versus Clinical Feature #1: 'Time to Death'
P value = 0.000123 (Fisher's exact test), Q value = 0.062
Table S31. Gene #57: '13q loss' versus Clinical Feature #7: 'GENDER'
| nPatients | FEMALE | MALE |
|---|---|---|
| ALL | 49 | 114 |
| 13Q LOSS MUTATED | 12 | 4 |
| 13Q LOSS WILD-TYPE | 37 | 110 |
Figure S31. Get High-res Image Gene #57: '13q loss' versus Clinical Feature #7: 'GENDER'

P value = 2.65e-08 (logrank test), Q value = 1.4e-05
Table S32. Gene #59: '15q loss' versus Clinical Feature #1: 'Time to Death'
| nPatients | nDeath | Duration Range (Median), Month | |
|---|---|---|---|
| ALL | 150 | 17 | 0.0 - 194.8 (14.0) |
| 15Q LOSS MUTATED | 17 | 6 | 0.1 - 34.8 (6.8) |
| 15Q LOSS WILD-TYPE | 133 | 11 | 0.0 - 194.8 (14.6) |
Figure S32. Get High-res Image Gene #59: '15q loss' versus Clinical Feature #1: 'Time to Death'
P value = 3.35e-05 (logrank test), Q value = 0.017
Table S33. Gene #60: '16p loss' versus Clinical Feature #1: 'Time to Death'
| nPatients | nDeath | Duration Range (Median), Month | |
|---|---|---|---|
| ALL | 150 | 17 | 0.0 - 194.8 (14.0) |
| 16P LOSS MUTATED | 3 | 2 | 0.7 - 21.6 (11.1) |
| 16P LOSS WILD-TYPE | 147 | 15 | 0.0 - 194.8 (14.1) |
Figure S33. Get High-res Image Gene #60: '16p loss' versus Clinical Feature #1: 'Time to Death'

P value = 3.35e-05 (logrank test), Q value = 0.017
Table S34. Gene #61: '16q loss' versus Clinical Feature #1: 'Time to Death'
| nPatients | nDeath | Duration Range (Median), Month | |
|---|---|---|---|
| ALL | 150 | 17 | 0.0 - 194.8 (14.0) |
| 16Q LOSS MUTATED | 4 | 2 | 0.7 - 21.6 (7.0) |
| 16Q LOSS WILD-TYPE | 146 | 15 | 0.0 - 194.8 (14.3) |
Figure S34. Get High-res Image Gene #61: '16q loss' versus Clinical Feature #1: 'Time to Death'
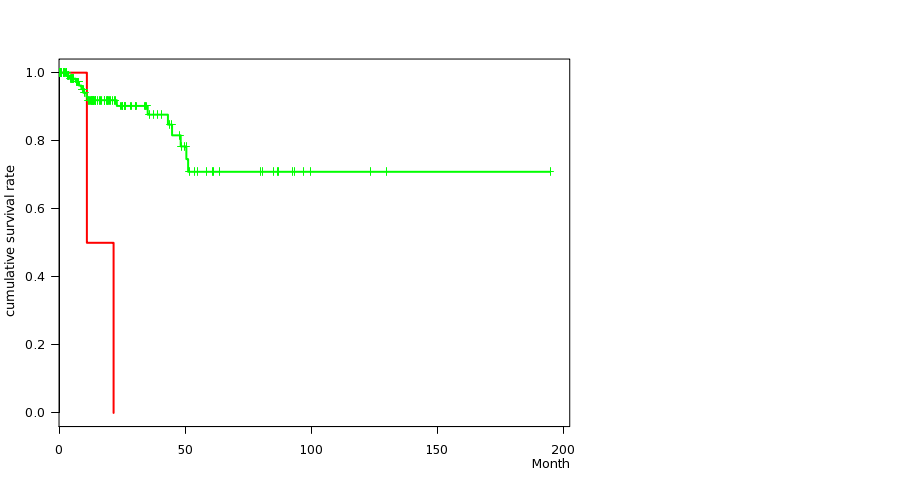
P value = 4.03e-14 (logrank test), Q value = 2.2e-11
Table S35. Gene #62: '17p loss' versus Clinical Feature #1: 'Time to Death'
| nPatients | nDeath | Duration Range (Median), Month | |
|---|---|---|---|
| ALL | 150 | 17 | 0.0 - 194.8 (14.0) |
| 17P LOSS MUTATED | 6 | 4 | 0.2 - 11.3 (6.8) |
| 17P LOSS WILD-TYPE | 144 | 13 | 0.0 - 194.8 (14.6) |
Figure S35. Get High-res Image Gene #62: '17p loss' versus Clinical Feature #1: 'Time to Death'
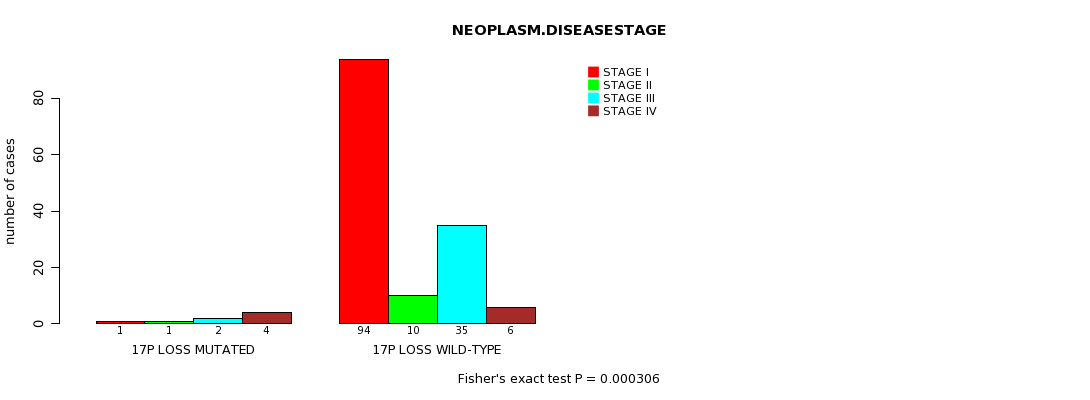
P value = 0.000306 (Fisher's exact test), Q value = 0.15
Table S36. Gene #62: '17p loss' versus Clinical Feature #3: 'NEOPLASM.DISEASESTAGE'
| nPatients | STAGE I | STAGE II | STAGE III | STAGE IV |
|---|---|---|---|---|
| ALL | 95 | 11 | 37 | 10 |
| 17P LOSS MUTATED | 1 | 1 | 2 | 4 |
| 17P LOSS WILD-TYPE | 94 | 10 | 35 | 6 |
Figure S36. Get High-res Image Gene #62: '17p loss' versus Clinical Feature #3: 'NEOPLASM.DISEASESTAGE'
P value = 5.21e-05 (logrank test), Q value = 0.027
Table S37. Gene #63: '18p loss' versus Clinical Feature #1: 'Time to Death'
| nPatients | nDeath | Duration Range (Median), Month | |
|---|---|---|---|
| ALL | 150 | 17 | 0.0 - 194.8 (14.0) |
| 18P LOSS MUTATED | 25 | 7 | 0.0 - 123.6 (7.6) |
| 18P LOSS WILD-TYPE | 125 | 10 | 0.0 - 194.8 (15.1) |
Figure S37. Get High-res Image Gene #63: '18p loss' versus Clinical Feature #1: 'Time to Death'
P value = 7.2e-05 (Fisher's exact test), Q value = 0.036
Table S38. Gene #63: '18p loss' versus Clinical Feature #3: 'NEOPLASM.DISEASESTAGE'
| nPatients | STAGE I | STAGE II | STAGE III | STAGE IV |
|---|---|---|---|---|
| ALL | 95 | 11 | 37 | 10 |
| 18P LOSS MUTATED | 6 | 1 | 13 | 4 |
| 18P LOSS WILD-TYPE | 89 | 10 | 24 | 6 |
Figure S38. Get High-res Image Gene #63: '18p loss' versus Clinical Feature #3: 'NEOPLASM.DISEASESTAGE'
P value = 5.11e-06 (Fisher's exact test), Q value = 0.0027
Table S39. Gene #63: '18p loss' versus Clinical Feature #4: 'PATHOLOGY.T.STAGE'
| nPatients | T1 | T2 | T3+T4 |
|---|---|---|---|
| ALL | 102 | 17 | 44 |
| 18P LOSS MUTATED | 6 | 3 | 17 |
| 18P LOSS WILD-TYPE | 96 | 14 | 27 |
Figure S39. Get High-res Image Gene #63: '18p loss' versus Clinical Feature #4: 'PATHOLOGY.T.STAGE'

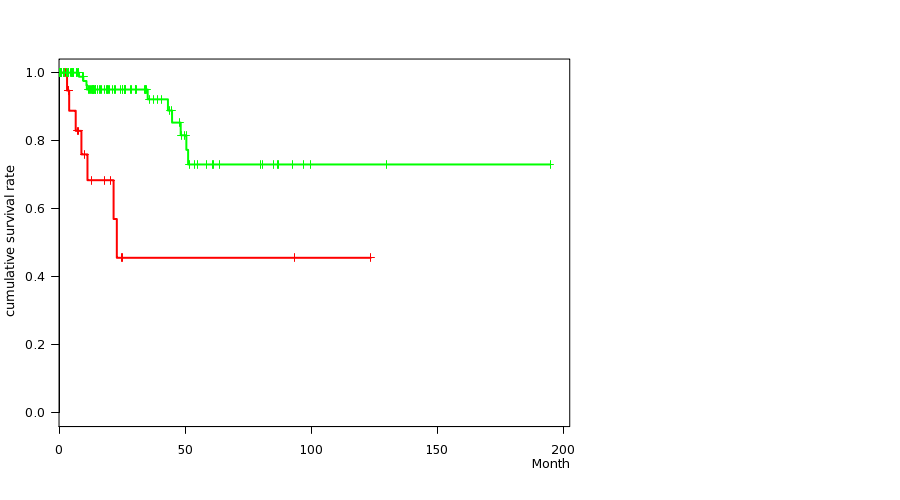
P value = 5.21e-05 (logrank test), Q value = 0.027
Table S40. Gene #64: '18q loss' versus Clinical Feature #1: 'Time to Death'
| nPatients | nDeath | Duration Range (Median), Month | |
|---|---|---|---|
| ALL | 150 | 17 | 0.0 - 194.8 (14.0) |
| 18Q LOSS MUTATED | 26 | 7 | 0.0 - 123.6 (7.5) |
| 18Q LOSS WILD-TYPE | 124 | 10 | 0.0 - 194.8 (15.7) |
Figure S40. Get High-res Image Gene #64: '18q loss' versus Clinical Feature #1: 'Time to Death'

P value = 8.45e-06 (Fisher's exact test), Q value = 0.0044
Table S41. Gene #64: '18q loss' versus Clinical Feature #3: 'NEOPLASM.DISEASESTAGE'
| nPatients | STAGE I | STAGE II | STAGE III | STAGE IV |
|---|---|---|---|---|
| ALL | 95 | 11 | 37 | 10 |
| 18Q LOSS MUTATED | 6 | 1 | 15 | 4 |
| 18Q LOSS WILD-TYPE | 89 | 10 | 22 | 6 |
Figure S41. Get High-res Image Gene #64: '18q loss' versus Clinical Feature #3: 'NEOPLASM.DISEASESTAGE'
P value = 5.88e-06 (Fisher's exact test), Q value = 0.0031
Table S42. Gene #64: '18q loss' versus Clinical Feature #4: 'PATHOLOGY.T.STAGE'
| nPatients | T1 | T2 | T3+T4 |
|---|---|---|---|
| ALL | 102 | 17 | 44 |
| 18Q LOSS MUTATED | 7 | 3 | 18 |
| 18Q LOSS WILD-TYPE | 95 | 14 | 26 |
Figure S42. Get High-res Image Gene #64: '18q loss' versus Clinical Feature #4: 'PATHOLOGY.T.STAGE'
P value = 2.02e-06 (Fisher's exact test), Q value = 0.0011
Table S43. Gene #68: '22q loss' versus Clinical Feature #3: 'NEOPLASM.DISEASESTAGE'
| nPatients | STAGE I | STAGE II | STAGE III | STAGE IV |
|---|---|---|---|---|
| ALL | 95 | 11 | 37 | 10 |
| 22Q LOSS MUTATED | 10 | 3 | 19 | 5 |
| 22Q LOSS WILD-TYPE | 85 | 8 | 18 | 5 |
Figure S43. Get High-res Image Gene #68: '22q loss' versus Clinical Feature #3: 'NEOPLASM.DISEASESTAGE'
P value = 3.32e-06 (Fisher's exact test), Q value = 0.0018
Table S44. Gene #68: '22q loss' versus Clinical Feature #4: 'PATHOLOGY.T.STAGE'
| nPatients | T1 | T2 | T3+T4 |
|---|---|---|---|
| ALL | 102 | 17 | 44 |
| 22Q LOSS MUTATED | 13 | 3 | 23 |
| 22Q LOSS WILD-TYPE | 89 | 14 | 21 |
Figure S44. Get High-res Image Gene #68: '22q loss' versus Clinical Feature #4: 'PATHOLOGY.T.STAGE'
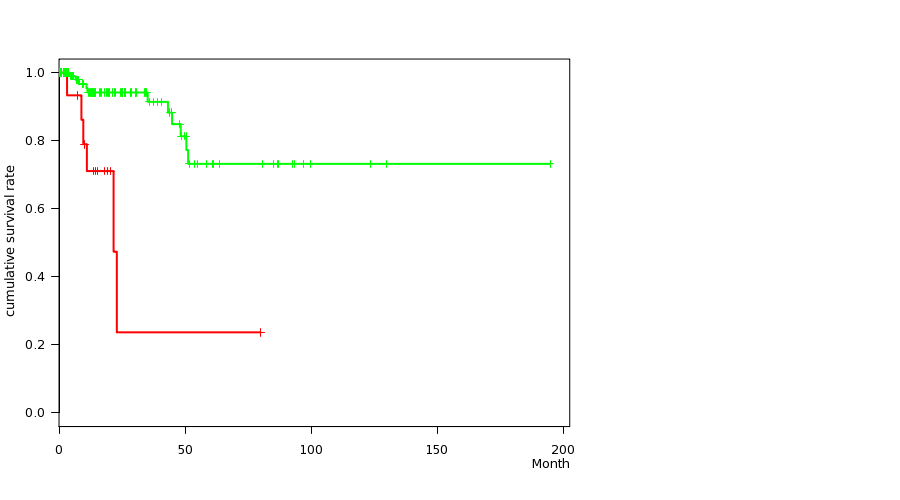
P value = 6.67e-05 (logrank test), Q value = 0.034
Table S45. Gene #69: 'xq loss' versus Clinical Feature #1: 'Time to Death'
| nPatients | nDeath | Duration Range (Median), Month | |
|---|---|---|---|
| ALL | 150 | 17 | 0.0 - 194.8 (14.0) |
| XQ LOSS MUTATED | 19 | 6 | 0.1 - 79.9 (11.1) |
| XQ LOSS WILD-TYPE | 131 | 11 | 0.0 - 194.8 (14.4) |
Figure S45. Get High-res Image Gene #69: 'xq loss' versus Clinical Feature #1: 'Time to Death'
P value = 0.000495 (Fisher's exact test), Q value = 0.24
Table S46. Gene #69: 'xq loss' versus Clinical Feature #3: 'NEOPLASM.DISEASESTAGE'
| nPatients | STAGE I | STAGE II | STAGE III | STAGE IV |
|---|---|---|---|---|
| ALL | 95 | 11 | 37 | 10 |
| XQ LOSS MUTATED | 4 | 1 | 10 | 3 |
| XQ LOSS WILD-TYPE | 91 | 10 | 27 | 7 |
Figure S46. Get High-res Image Gene #69: 'xq loss' versus Clinical Feature #3: 'NEOPLASM.DISEASESTAGE'
P value = 0.000194 (Fisher's exact test), Q value = 0.097
Table S47. Gene #69: 'xq loss' versus Clinical Feature #4: 'PATHOLOGY.T.STAGE'
| nPatients | T1 | T2 | T3+T4 |
|---|---|---|---|
| ALL | 102 | 17 | 44 |
| XQ LOSS MUTATED | 5 | 2 | 13 |
| XQ LOSS WILD-TYPE | 97 | 15 | 31 |
Figure S47. Get High-res Image Gene #69: 'xq loss' versus Clinical Feature #4: 'PATHOLOGY.T.STAGE'

-
Copy number data file = transformed.cor.cli.txt
-
Clinical data file = KIRP-TP.merged_data.txt
-
Number of patients = 163
-
Number of significantly arm-level cnvs = 69
-
Number of selected clinical features = 10
-
Exclude regions that fewer than K tumors have mutations, K = 3
For survival clinical features, the Kaplan-Meier survival curves of tumors with and without gene mutations were plotted and the statistical significance P values were estimated by logrank test (Bland and Altman 2004) using the 'survdiff' function in R
For continuous numerical clinical features, two-tailed Student's t test with unequal variance (Lehmann and Romano 2005) was applied to compare the clinical values between tumors with and without gene mutations using 't.test' function in R
For binary or multi-class clinical features (nominal or ordinal), two-tailed Fisher's exact tests (Fisher 1922) were used to estimate the P values using the 'fisher.test' function in R
For multiple hypothesis correction, Q value is the False Discovery Rate (FDR) analogue of the P value (Benjamini and Hochberg 1995), defined as the minimum FDR at which the test may be called significant. We used the 'Benjamini and Hochberg' method of 'p.adjust' function in R to convert P values into Q values.
In addition to the links below, the full results of the analysis summarized in this report can also be downloaded programmatically using firehose_get, or interactively from either the Broad GDAC website or TCGA Data Coordination Center Portal.