This pipeline computes the correlation between significant arm-level copy number variations (cnvs) and selected clinical features.
Testing the association between copy number variation 78 arm-level events and 6 clinical features across 359 patients, 25 significant findings detected with Q value < 0.25.
-
1q gain cnv correlated to 'AGE'.
-
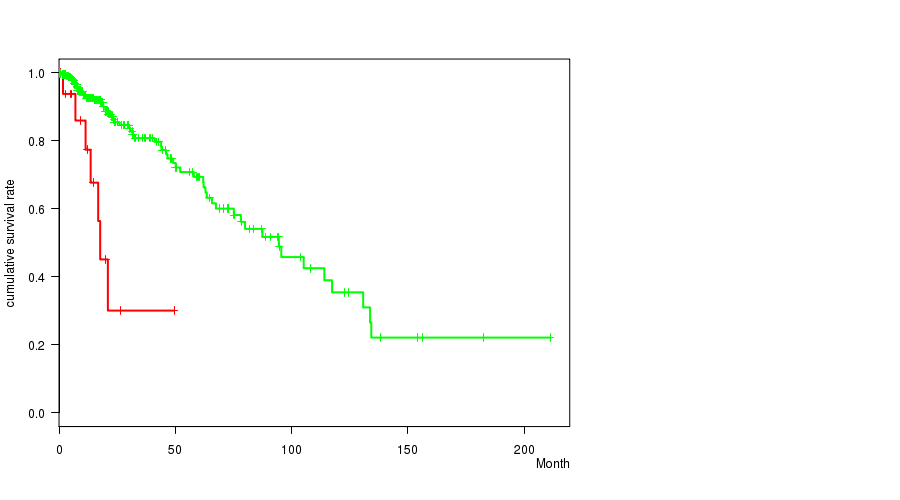
3q gain cnv correlated to 'Time to Death'.
-
7p gain cnv correlated to 'Time to Death' and 'AGE'.
-
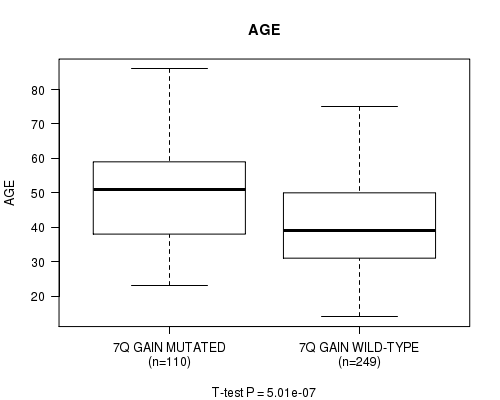
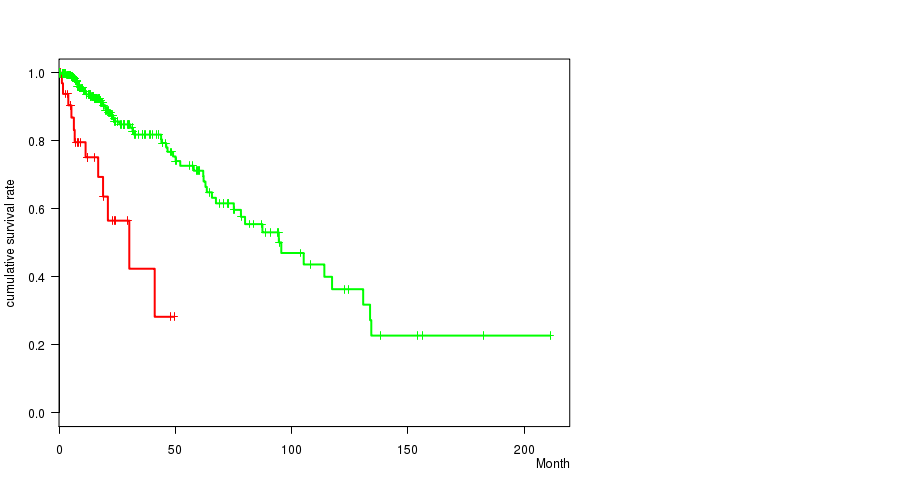
7q gain cnv correlated to 'Time to Death' and 'AGE'.
-
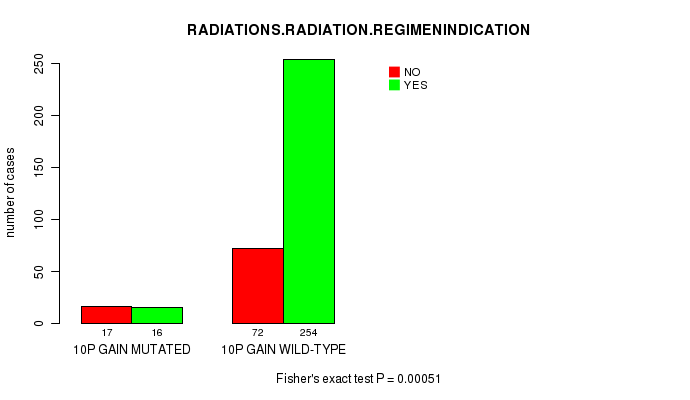
10p gain cnv correlated to 'RADIATIONS.RADIATION.REGIMENINDICATION'.
-
19p gain cnv correlated to 'HISTOLOGICAL.TYPE'.
-
19q gain cnv correlated to 'Time to Death' and 'AGE'.
-
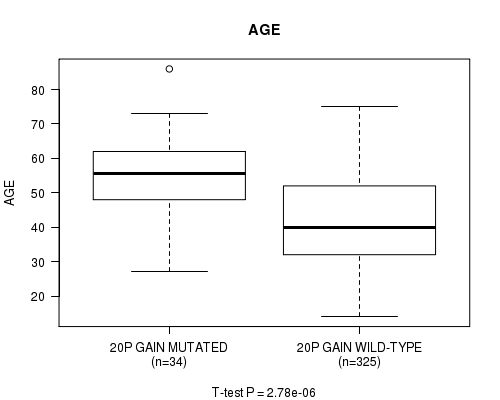
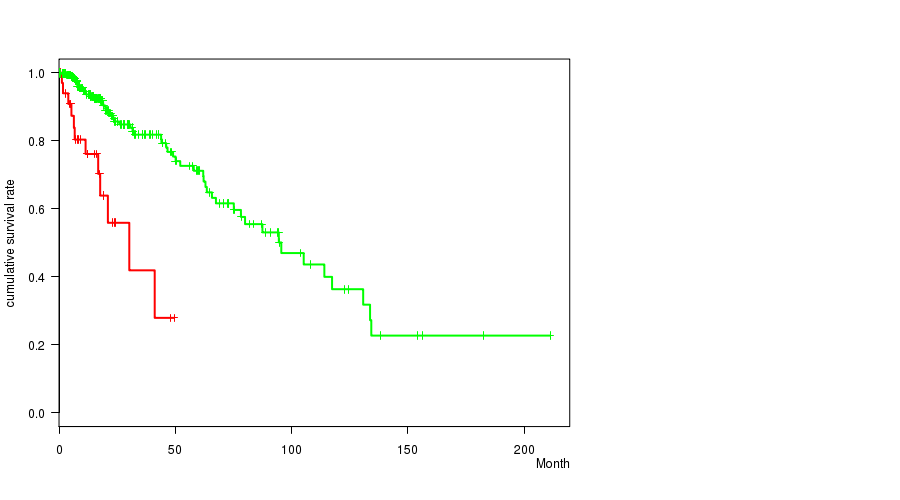
20p gain cnv correlated to 'Time to Death' and 'AGE'.
-
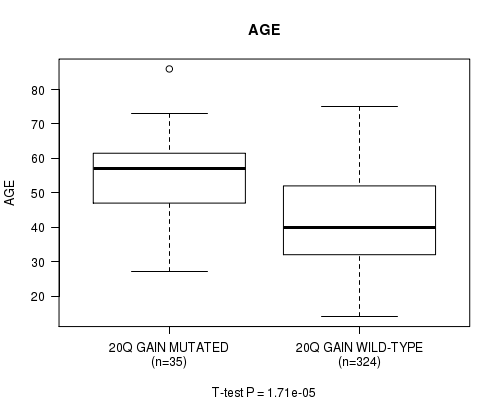
20q gain cnv correlated to 'Time to Death' and 'AGE'.
-
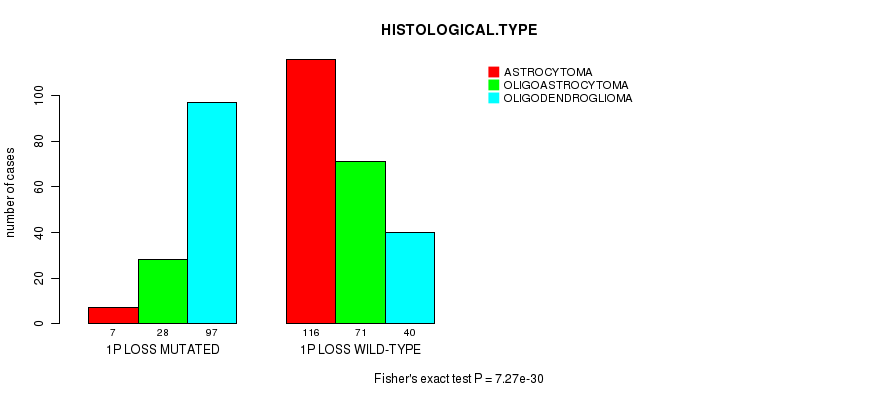
1p loss cnv correlated to 'HISTOLOGICAL.TYPE'.
-
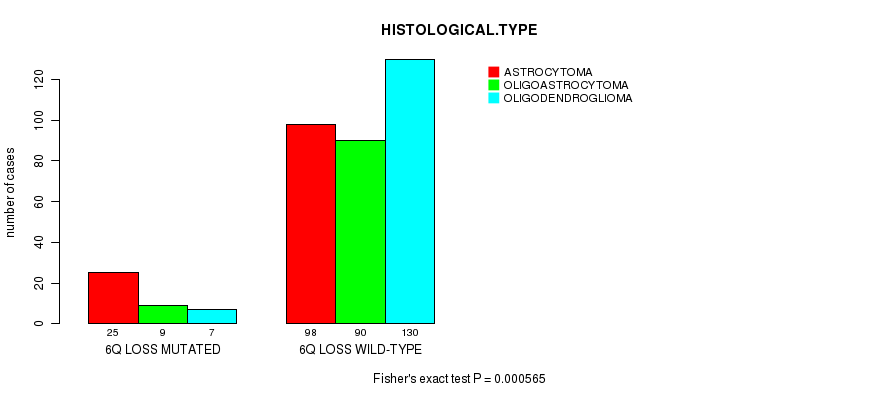
6q loss cnv correlated to 'HISTOLOGICAL.TYPE'.
-
9p loss cnv correlated to 'Time to Death'.
-
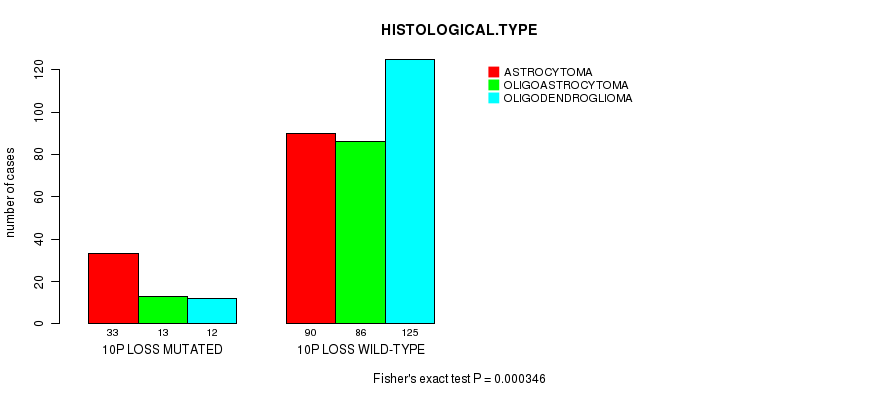
10p loss cnv correlated to 'Time to Death', 'AGE', and 'HISTOLOGICAL.TYPE'.
-
10q loss cnv correlated to 'Time to Death', 'AGE', and 'HISTOLOGICAL.TYPE'.
-
14q loss cnv correlated to 'Time to Death'.
-
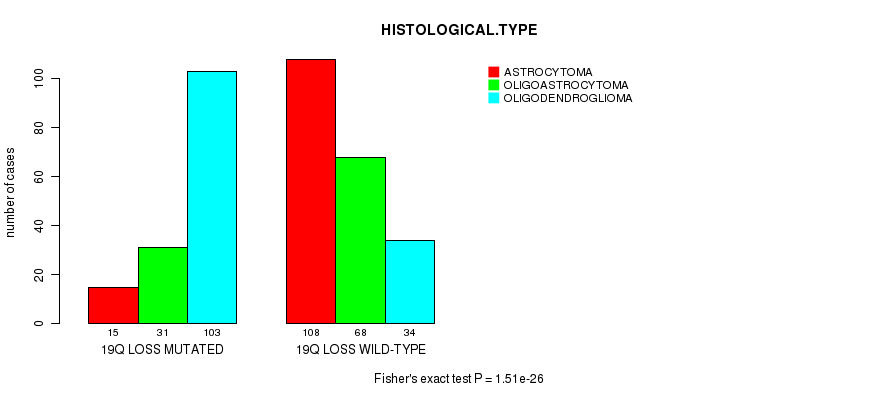
19q loss cnv correlated to 'HISTOLOGICAL.TYPE'.
Table 1. Get Full Table Overview of the association between significant copy number variation of 78 arm-level events and 6 clinical features. Shown in the table are P values (Q values). Thresholded by Q value < 0.25, 25 significant findings detected.
|
Clinical Features |
Time to Death |
AGE | GENDER |
KARNOFSKY PERFORMANCE SCORE |
HISTOLOGICAL TYPE |
RADIATIONS RADIATION REGIMENINDICATION |
||
| nCNV (%) | nWild-Type | logrank test | t-test | Fisher's exact test | t-test | Fisher's exact test | Fisher's exact test | |
| 10p loss | 58 (16%) | 301 |
0 (0) |
7.19e-13 (3.31e-10) |
0.25 (1.00) |
0.00494 (1.00) |
0.000346 (0.153) |
0.508 (1.00) |
| 10q loss | 68 (19%) | 291 |
1.25e-10 (5.71e-08) |
1.99e-11 (9.13e-09) |
0.225 (1.00) |
0.0118 (1.00) |
0.000157 (0.0699) |
0.641 (1.00) |
| 7p gain | 85 (24%) | 274 |
8.75e-05 (0.0392) |
3.04e-06 (0.00138) |
0.262 (1.00) |
0.0209 (1.00) |
0.107 (1.00) |
0.393 (1.00) |
| 7q gain | 110 (31%) | 249 |
0.000146 (0.0653) |
5.01e-07 (0.000229) |
0.358 (1.00) |
0.138 (1.00) |
0.0897 (1.00) |
0.691 (1.00) |
| 19q gain | 18 (5%) | 341 |
8.46e-06 (0.00383) |
7.23e-05 (0.0325) |
0.631 (1.00) |
0.493 (1.00) |
0.314 (1.00) |
0.781 (1.00) |
| 20p gain | 34 (9%) | 325 |
7.49e-07 (0.000341) |
2.78e-06 (0.00126) |
0.47 (1.00) |
0.145 (1.00) |
0.125 (1.00) |
0.678 (1.00) |
| 20q gain | 35 (10%) | 324 |
6.88e-07 (0.000314) |
1.71e-05 (0.0077) |
0.211 (1.00) |
0.216 (1.00) |
0.183 (1.00) |
0.68 (1.00) |
| 1q gain | 15 (4%) | 344 |
0.352 (1.00) |
0.000432 (0.191) |
0.117 (1.00) |
0.263 (1.00) |
0.266 (1.00) |
0.54 (1.00) |
| 3q gain | 8 (2%) | 351 |
0.000463 (0.204) |
0.0543 (1.00) |
0.478 (1.00) |
0.383 (1.00) |
0.0436 (1.00) |
0.415 (1.00) |
| 10p gain | 33 (9%) | 326 |
0.67 (1.00) |
0.00479 (1.00) |
0.0675 (1.00) |
0.105 (1.00) |
0.0111 (1.00) |
0.00051 (0.224) |
| 19p gain | 69 (19%) | 290 |
0.385 (1.00) |
0.00588 (1.00) |
0.503 (1.00) |
0.111 (1.00) |
6.21e-05 (0.0279) |
0.877 (1.00) |
| 1p loss | 132 (37%) | 227 |
0.00981 (1.00) |
0.002 (0.856) |
1 (1.00) |
0.891 (1.00) |
7.27e-30 (3.36e-27) |
0.0158 (1.00) |
| 6q loss | 41 (11%) | 318 |
0.000846 (0.37) |
0.058 (1.00) |
0.741 (1.00) |
0.15 (1.00) |
0.000565 (0.248) |
0.0823 (1.00) |
| 9p loss | 78 (22%) | 281 |
9.13e-05 (0.0408) |
0.144 (1.00) |
0.369 (1.00) |
0.531 (1.00) |
0.0434 (1.00) |
0.0267 (1.00) |
| 14q loss | 55 (15%) | 304 |
0.0002 (0.0888) |
0.000788 (0.345) |
0.66 (1.00) |
0.102 (1.00) |
0.221 (1.00) |
0.403 (1.00) |
| 19q loss | 149 (42%) | 210 |
0.136 (1.00) |
0.0548 (1.00) |
1 (1.00) |
0.813 (1.00) |
1.51e-26 (6.98e-24) |
0.172 (1.00) |
| 1p gain | 10 (3%) | 349 |
0.00287 (1.00) |
0.0273 (1.00) |
0.197 (1.00) |
0.0205 (1.00) |
0.00501 (1.00) |
0.714 (1.00) |
| 2p gain | 7 (2%) | 352 |
0.556 (1.00) |
0.0732 (1.00) |
0.707 (1.00) |
0.479 (1.00) |
0.504 (1.00) |
0.685 (1.00) |
| 2q gain | 6 (2%) | 353 |
0.909 (1.00) |
0.155 (1.00) |
0.42 (1.00) |
0.479 (1.00) |
0.292 (1.00) |
0.64 (1.00) |
| 3p gain | 10 (3%) | 349 |
0.00132 (0.575) |
0.102 (1.00) |
0.523 (1.00) |
0.903 (1.00) |
0.0312 (1.00) |
0.714 (1.00) |
| 4p gain | 8 (2%) | 351 |
0.289 (1.00) |
0.953 (1.00) |
0.297 (1.00) |
0.709 (1.00) |
0.0436 (1.00) |
0.685 (1.00) |
| 4q gain | 3 (1%) | 356 |
0.648 (1.00) |
0.612 (1.00) |
1 (1.00) |
0.632 (1.00) |
1 (1.00) |
|
| 5p gain | 7 (2%) | 352 |
0.502 (1.00) |
0.249 (1.00) |
1 (1.00) |
0.466 (1.00) |
0.345 (1.00) |
1 (1.00) |
| 5q gain | 5 (1%) | 354 |
0.831 (1.00) |
0.446 (1.00) |
0.665 (1.00) |
0.158 (1.00) |
0.636 (1.00) |
0.338 (1.00) |
| 6p gain | 6 (2%) | 353 |
0.755 (1.00) |
0.167 (1.00) |
0.0982 (1.00) |
0.0205 (1.00) |
0.292 (1.00) |
0.64 (1.00) |
| 8p gain | 31 (9%) | 328 |
0.549 (1.00) |
0.88 (1.00) |
0.454 (1.00) |
0.198 (1.00) |
0.0812 (1.00) |
1 (1.00) |
| 8q gain | 38 (11%) | 321 |
0.509 (1.00) |
0.326 (1.00) |
0.492 (1.00) |
0.0658 (1.00) |
0.00344 (1.00) |
0.843 (1.00) |
| 9p gain | 14 (4%) | 345 |
0.0537 (1.00) |
0.0291 (1.00) |
0.0592 (1.00) |
0.727 (1.00) |
0.332 (1.00) |
1 (1.00) |
| 9q gain | 19 (5%) | 340 |
0.0356 (1.00) |
0.0227 (1.00) |
0.0168 (1.00) |
0.725 (1.00) |
0.0986 (1.00) |
0.426 (1.00) |
| 10q gain | 5 (1%) | 354 |
0.712 (1.00) |
0.339 (1.00) |
0.0648 (1.00) |
0.103 (1.00) |
0.0998 (1.00) |
|
| 11p gain | 25 (7%) | 334 |
0.555 (1.00) |
0.064 (1.00) |
0.152 (1.00) |
0.565 (1.00) |
0.114 (1.00) |
1 (1.00) |
| 11q gain | 41 (11%) | 318 |
0.745 (1.00) |
0.0668 (1.00) |
0.0462 (1.00) |
0.839 (1.00) |
0.541 (1.00) |
1 (1.00) |
| 12p gain | 26 (7%) | 333 |
0.819 (1.00) |
0.734 (1.00) |
0.152 (1.00) |
0.589 (1.00) |
0.714 (1.00) |
1 (1.00) |
| 12q gain | 12 (3%) | 347 |
0.00159 (0.684) |
0.248 (1.00) |
0.155 (1.00) |
0.514 (1.00) |
1 (1.00) |
0.737 (1.00) |
| 13q gain | 3 (1%) | 356 |
0.529 (1.00) |
0.818 (1.00) |
0.596 (1.00) |
0.468 (1.00) |
0.28 (1.00) |
1 (1.00) |
| 14q gain | 3 (1%) | 356 |
0.469 (1.00) |
0.391 (1.00) |
1 (1.00) |
1 (1.00) |
0.153 (1.00) |
|
| 15q gain | 7 (2%) | 352 |
0.103 (1.00) |
0.00588 (1.00) |
0.459 (1.00) |
0.681 (1.00) |
0.345 (1.00) |
0.685 (1.00) |
| 16p gain | 13 (4%) | 346 |
0.314 (1.00) |
0.064 (1.00) |
0.272 (1.00) |
0.858 (1.00) |
0.131 (1.00) |
0.743 (1.00) |
| 16q gain | 13 (4%) | 346 |
0.113 (1.00) |
0.327 (1.00) |
0.272 (1.00) |
0.389 (1.00) |
0.0351 (1.00) |
0.323 (1.00) |
| 17p gain | 15 (4%) | 344 |
0.041 (1.00) |
0.284 (1.00) |
0.429 (1.00) |
0.169 (1.00) |
0.0625 (1.00) |
0.77 (1.00) |
| 17q gain | 16 (4%) | 343 |
0.00554 (1.00) |
0.318 (1.00) |
0.307 (1.00) |
0.86 (1.00) |
0.181 (1.00) |
1 (1.00) |
| 18p gain | 11 (3%) | 348 |
0.0638 (1.00) |
0.696 (1.00) |
1 (1.00) |
0.615 (1.00) |
0.435 (1.00) |
1 (1.00) |
| 18q gain | 8 (2%) | 351 |
0.142 (1.00) |
0.719 (1.00) |
0.731 (1.00) |
0.158 (1.00) |
0.608 (1.00) |
0.685 (1.00) |
| 21q gain | 20 (6%) | 339 |
0.175 (1.00) |
0.0168 (1.00) |
0.819 (1.00) |
0.276 (1.00) |
0.476 (1.00) |
1 (1.00) |
| 22q gain | 11 (3%) | 348 |
0.949 (1.00) |
0.115 (1.00) |
0.76 (1.00) |
0.978 (1.00) |
0.0822 (1.00) |
0.737 (1.00) |
| xq gain | 27 (8%) | 332 |
0.905 (1.00) |
0.507 (1.00) |
0.00911 (1.00) |
0.666 (1.00) |
0.187 (1.00) |
0.643 (1.00) |
| 1q loss | 19 (5%) | 340 |
0.92 (1.00) |
0.0388 (1.00) |
0.639 (1.00) |
0.1 (1.00) |
0.239 (1.00) |
0.584 (1.00) |
| 2p loss | 13 (4%) | 346 |
0.178 (1.00) |
0.758 (1.00) |
0.154 (1.00) |
0.765 (1.00) |
0.458 (1.00) |
1 (1.00) |
| 2q loss | 13 (4%) | 346 |
0.848 (1.00) |
0.111 (1.00) |
0.396 (1.00) |
0.727 (1.00) |
0.105 (1.00) |
1 (1.00) |
| 3p loss | 15 (4%) | 344 |
0.00894 (1.00) |
0.659 (1.00) |
0.429 (1.00) |
0.0227 (1.00) |
0.635 (1.00) |
0.77 (1.00) |
| 3q loss | 20 (6%) | 339 |
0.0139 (1.00) |
0.87 (1.00) |
0.065 (1.00) |
0.241 (1.00) |
0.878 (1.00) |
0.597 (1.00) |
| 4p loss | 52 (14%) | 307 |
0.891 (1.00) |
0.00148 (0.641) |
0.176 (1.00) |
0.559 (1.00) |
0.00169 (0.728) |
0.489 (1.00) |
| 4q loss | 67 (19%) | 292 |
0.882 (1.00) |
0.174 (1.00) |
0.222 (1.00) |
0.631 (1.00) |
0.0123 (1.00) |
0.438 (1.00) |
| 5p loss | 27 (8%) | 332 |
0.388 (1.00) |
0.0887 (1.00) |
1 (1.00) |
0.238 (1.00) |
0.0228 (1.00) |
0.0199 (1.00) |
| 5q loss | 26 (7%) | 333 |
0.0835 (1.00) |
0.341 (1.00) |
0.421 (1.00) |
0.719 (1.00) |
0.0901 (1.00) |
0.0557 (1.00) |
| 6p loss | 22 (6%) | 337 |
0.00091 (0.397) |
0.388 (1.00) |
0.665 (1.00) |
0.344 (1.00) |
0.0506 (1.00) |
1 (1.00) |
| 7p loss | 3 (1%) | 356 |
0.486 (1.00) |
0.528 (1.00) |
0.596 (1.00) |
0.632 (1.00) |
1 (1.00) |
|
| 7q loss | 3 (1%) | 356 |
0.655 (1.00) |
0.86 (1.00) |
1 (1.00) |
0.897 (1.00) |
0.632 (1.00) |
1 (1.00) |
| 8p loss | 12 (3%) | 347 |
0.0444 (1.00) |
0.151 (1.00) |
1 (1.00) |
0.543 (1.00) |
0.262 (1.00) |
0.501 (1.00) |
| 8q loss | 9 (3%) | 350 |
0.0123 (1.00) |
0.223 (1.00) |
0.738 (1.00) |
0.482 (1.00) |
0.398 (1.00) |
1 (1.00) |
| 9q loss | 31 (9%) | 328 |
0.00515 (1.00) |
0.234 (1.00) |
0.708 (1.00) |
0.0545 (1.00) |
0.794 (1.00) |
0.831 (1.00) |
| 11p loss | 45 (13%) | 314 |
0.313 (1.00) |
0.214 (1.00) |
0.201 (1.00) |
0.995 (1.00) |
0.0578 (1.00) |
0.467 (1.00) |
| 11q loss | 16 (4%) | 343 |
0.0113 (1.00) |
0.073 (1.00) |
0.801 (1.00) |
0.135 (1.00) |
0.0803 (1.00) |
0.376 (1.00) |
| 12p loss | 15 (4%) | 344 |
0.8 (1.00) |
0.229 (1.00) |
0.604 (1.00) |
0.941 (1.00) |
0.334 (1.00) |
0.54 (1.00) |
| 12q loss | 31 (9%) | 328 |
0.921 (1.00) |
0.362 (1.00) |
0.574 (1.00) |
0.564 (1.00) |
0.0679 (1.00) |
0.383 (1.00) |
| 13q loss | 84 (23%) | 275 |
0.251 (1.00) |
0.685 (1.00) |
0.171 (1.00) |
0.293 (1.00) |
0.687 (1.00) |
0.0213 (1.00) |
| 15q loss | 32 (9%) | 327 |
0.2 (1.00) |
0.474 (1.00) |
0.854 (1.00) |
0.714 (1.00) |
0.466 (1.00) |
1 (1.00) |
| 16p loss | 9 (3%) | 350 |
0.21 (1.00) |
0.00397 (1.00) |
0.515 (1.00) |
0.0772 (1.00) |
0.836 (1.00) |
1 (1.00) |
| 16q loss | 16 (4%) | 343 |
0.148 (1.00) |
0.00486 (1.00) |
0.801 (1.00) |
0.892 (1.00) |
0.769 (1.00) |
0.557 (1.00) |
| 17p loss | 12 (3%) | 347 |
0.0163 (1.00) |
0.0357 (1.00) |
0.238 (1.00) |
0.025 (1.00) |
0.534 (1.00) |
0.307 (1.00) |
| 17q loss | 8 (2%) | 351 |
0.415 (1.00) |
0.11 (1.00) |
0.478 (1.00) |
0.156 (1.00) |
0.674 (1.00) |
0.685 (1.00) |
| 18p loss | 51 (14%) | 308 |
0.704 (1.00) |
0.0313 (1.00) |
0.033 (1.00) |
0.666 (1.00) |
0.402 (1.00) |
0.726 (1.00) |
| 18q loss | 47 (13%) | 312 |
0.797 (1.00) |
0.0788 (1.00) |
0.161 (1.00) |
0.74 (1.00) |
0.312 (1.00) |
1 (1.00) |
| 19p loss | 18 (5%) | 341 |
0.341 (1.00) |
0.62 (1.00) |
0.81 (1.00) |
0.561 (1.00) |
0.911 (1.00) |
0.166 (1.00) |
| 20p loss | 3 (1%) | 356 |
0.511 (1.00) |
0.486 (1.00) |
0.596 (1.00) |
1 (1.00) |
0.576 (1.00) |
|
| 21q loss | 20 (6%) | 339 |
0.662 (1.00) |
0.61 (1.00) |
0.249 (1.00) |
0.0804 (1.00) |
0.101 (1.00) |
0.792 (1.00) |
| 22q loss | 39 (11%) | 320 |
0.00136 (0.59) |
0.00142 (0.614) |
0.5 (1.00) |
0.00792 (1.00) |
0.168 (1.00) |
1 (1.00) |
| xq loss | 47 (13%) | 312 |
0.0451 (1.00) |
0.23 (1.00) |
0.641 (1.00) |
0.487 (1.00) |
0.461 (1.00) |
0.858 (1.00) |
P value = 0.000432 (t-test), Q value = 0.19
Table S1. Gene #2: '1q gain' versus Clinical Feature #2: 'AGE'
| nPatients | Mean (Std.Dev) | |
|---|---|---|
| ALL | 359 | 43.6 (13.5) |
| 1Q GAIN MUTATED | 15 | 55.8 (10.8) |
| 1Q GAIN WILD-TYPE | 344 | 43.1 (13.4) |
Figure S1. Get High-res Image Gene #2: '1q gain' versus Clinical Feature #2: 'AGE'

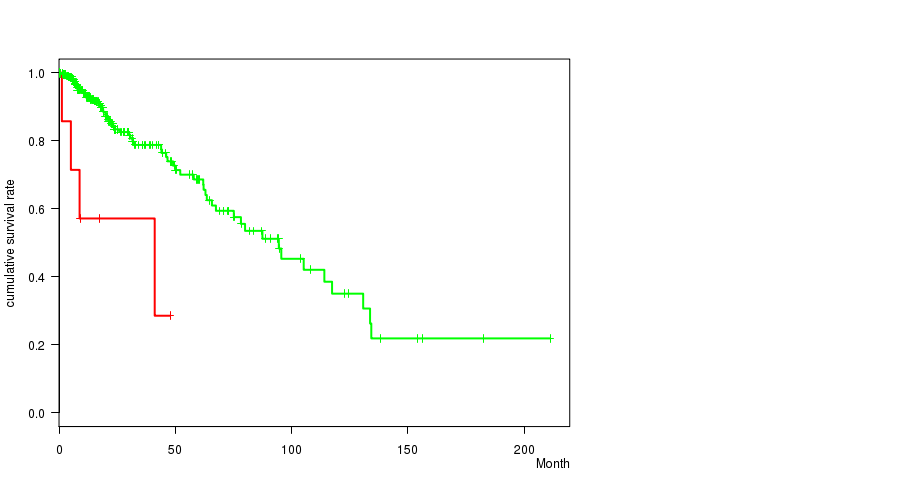
P value = 0.000463 (logrank test), Q value = 0.2
Table S2. Gene #6: '3q gain' versus Clinical Feature #1: 'Time to Death'
| nPatients | nDeath | Duration Range (Median), Month | |
|---|---|---|---|
| ALL | 356 | 68 | 0.0 - 211.2 (14.8) |
| 3Q GAIN MUTATED | 8 | 4 | 0.2 - 47.8 (9.1) |
| 3Q GAIN WILD-TYPE | 348 | 64 | 0.0 - 211.2 (14.9) |
Figure S2. Get High-res Image Gene #6: '3q gain' versus Clinical Feature #1: 'Time to Death'
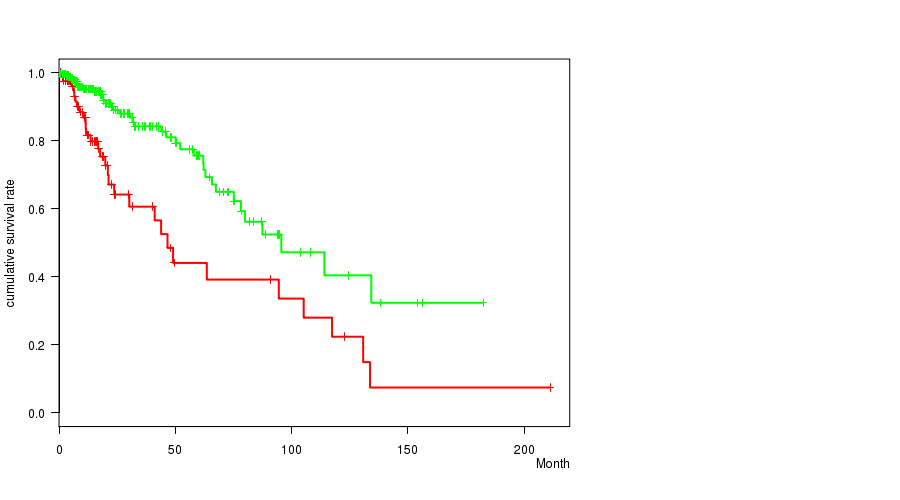
P value = 8.75e-05 (logrank test), Q value = 0.039
Table S3. Gene #12: '7p gain' versus Clinical Feature #1: 'Time to Death'
| nPatients | nDeath | Duration Range (Median), Month | |
|---|---|---|---|
| ALL | 356 | 68 | 0.0 - 211.2 (14.8) |
| 7P GAIN MUTATED | 85 | 30 | 0.1 - 211.2 (13.7) |
| 7P GAIN WILD-TYPE | 271 | 38 | 0.0 - 182.3 (15.0) |
Figure S3. Get High-res Image Gene #12: '7p gain' versus Clinical Feature #1: 'Time to Death'
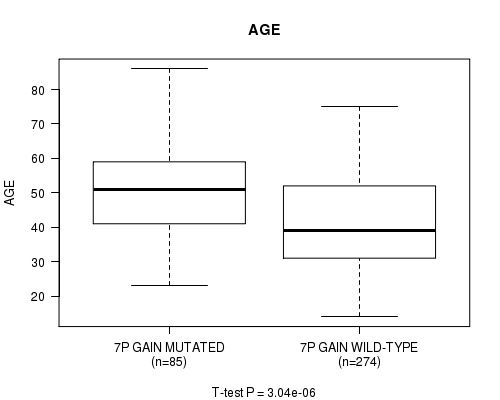
P value = 3.04e-06 (t-test), Q value = 0.0014
Table S4. Gene #12: '7p gain' versus Clinical Feature #2: 'AGE'
| nPatients | Mean (Std.Dev) | |
|---|---|---|
| ALL | 359 | 43.6 (13.5) |
| 7P GAIN MUTATED | 85 | 49.7 (13.3) |
| 7P GAIN WILD-TYPE | 274 | 41.7 (13.0) |
Figure S4. Get High-res Image Gene #12: '7p gain' versus Clinical Feature #2: 'AGE'
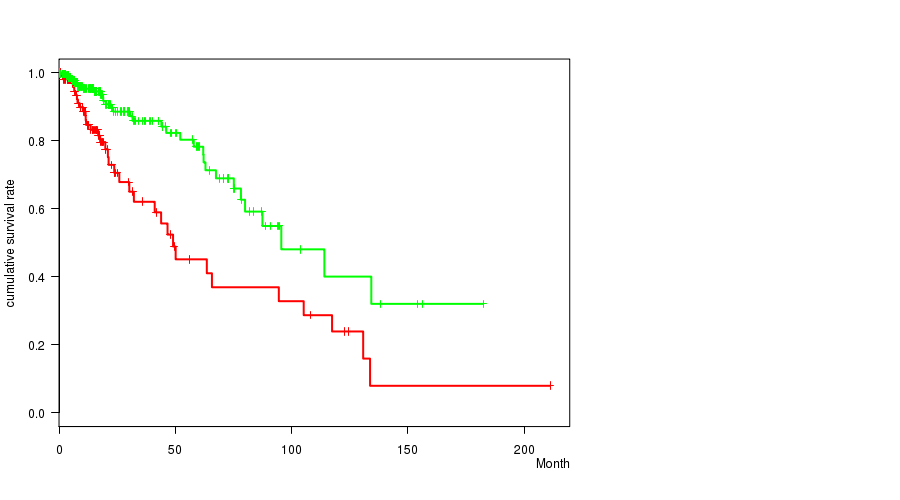
P value = 0.000146 (logrank test), Q value = 0.065
Table S5. Gene #13: '7q gain' versus Clinical Feature #1: 'Time to Death'
| nPatients | nDeath | Duration Range (Median), Month | |
|---|---|---|---|
| ALL | 356 | 68 | 0.0 - 211.2 (14.8) |
| 7Q GAIN MUTATED | 108 | 35 | 0.1 - 211.2 (15.0) |
| 7Q GAIN WILD-TYPE | 248 | 33 | 0.0 - 182.3 (14.8) |
Figure S5. Get High-res Image Gene #13: '7q gain' versus Clinical Feature #1: 'Time to Death'
P value = 5.01e-07 (t-test), Q value = 0.00023
Table S6. Gene #13: '7q gain' versus Clinical Feature #2: 'AGE'
| nPatients | Mean (Std.Dev) | |
|---|---|---|
| ALL | 359 | 43.6 (13.5) |
| 7Q GAIN MUTATED | 110 | 49.1 (13.5) |
| 7Q GAIN WILD-TYPE | 249 | 41.2 (12.8) |
Figure S6. Get High-res Image Gene #13: '7q gain' versus Clinical Feature #2: 'AGE'
P value = 0.00051 (Fisher's exact test), Q value = 0.22
Table S7. Gene #18: '10p gain' versus Clinical Feature #6: 'RADIATIONS.RADIATION.REGIMENINDICATION'
| nPatients | NO | YES |
|---|---|---|
| ALL | 89 | 270 |
| 10P GAIN MUTATED | 17 | 16 |
| 10P GAIN WILD-TYPE | 72 | 254 |
Figure S7. Get High-res Image Gene #18: '10p gain' versus Clinical Feature #6: 'RADIATIONS.RADIATION.REGIMENINDICATION'
P value = 6.21e-05 (Fisher's exact test), Q value = 0.028
Table S8. Gene #33: '19p gain' versus Clinical Feature #5: 'HISTOLOGICAL.TYPE'
| nPatients | ASTROCYTOMA | OLIGOASTROCYTOMA | OLIGODENDROGLIOMA |
|---|---|---|---|
| ALL | 123 | 99 | 137 |
| 19P GAIN MUTATED | 12 | 15 | 42 |
| 19P GAIN WILD-TYPE | 111 | 84 | 95 |
Figure S8. Get High-res Image Gene #33: '19p gain' versus Clinical Feature #5: 'HISTOLOGICAL.TYPE'

P value = 8.46e-06 (logrank test), Q value = 0.0038
Table S9. Gene #34: '19q gain' versus Clinical Feature #1: 'Time to Death'
| nPatients | nDeath | Duration Range (Median), Month | |
|---|---|---|---|
| ALL | 356 | 68 | 0.0 - 211.2 (14.8) |
| 19Q GAIN MUTATED | 18 | 7 | 0.5 - 49.5 (11.8) |
| 19Q GAIN WILD-TYPE | 338 | 61 | 0.0 - 211.2 (15.0) |
Figure S9. Get High-res Image Gene #34: '19q gain' versus Clinical Feature #1: 'Time to Death'
P value = 7.23e-05 (t-test), Q value = 0.032
Table S10. Gene #34: '19q gain' versus Clinical Feature #2: 'AGE'
| nPatients | Mean (Std.Dev) | |
|---|---|---|
| ALL | 359 | 43.6 (13.5) |
| 19Q GAIN MUTATED | 18 | 56.3 (10.9) |
| 19Q GAIN WILD-TYPE | 341 | 42.9 (13.3) |
Figure S10. Get High-res Image Gene #34: '19q gain' versus Clinical Feature #2: 'AGE'

P value = 7.49e-07 (logrank test), Q value = 0.00034
Table S11. Gene #35: '20p gain' versus Clinical Feature #1: 'Time to Death'
| nPatients | nDeath | Duration Range (Median), Month | |
|---|---|---|---|
| ALL | 356 | 68 | 0.0 - 211.2 (14.8) |
| 20P GAIN MUTATED | 34 | 12 | 0.5 - 49.5 (11.8) |
| 20P GAIN WILD-TYPE | 322 | 56 | 0.0 - 211.2 (15.0) |
Figure S11. Get High-res Image Gene #35: '20p gain' versus Clinical Feature #1: 'Time to Death'
P value = 2.78e-06 (t-test), Q value = 0.0013
Table S12. Gene #35: '20p gain' versus Clinical Feature #2: 'AGE'
| nPatients | Mean (Std.Dev) | |
|---|---|---|
| ALL | 359 | 43.6 (13.5) |
| 20P GAIN MUTATED | 34 | 54.9 (12.7) |
| 20P GAIN WILD-TYPE | 325 | 42.4 (13.0) |
Figure S12. Get High-res Image Gene #35: '20p gain' versus Clinical Feature #2: 'AGE'
P value = 6.88e-07 (logrank test), Q value = 0.00031
Table S13. Gene #36: '20q gain' versus Clinical Feature #1: 'Time to Death'
| nPatients | nDeath | Duration Range (Median), Month | |
|---|---|---|---|
| ALL | 356 | 68 | 0.0 - 211.2 (14.8) |
| 20Q GAIN MUTATED | 35 | 12 | 0.5 - 49.5 (12.2) |
| 20Q GAIN WILD-TYPE | 321 | 56 | 0.0 - 211.2 (15.0) |
Figure S13. Get High-res Image Gene #36: '20q gain' versus Clinical Feature #1: 'Time to Death'
P value = 1.71e-05 (t-test), Q value = 0.0077
Table S14. Gene #36: '20q gain' versus Clinical Feature #2: 'AGE'
| nPatients | Mean (Std.Dev) | |
|---|---|---|
| ALL | 359 | 43.6 (13.5) |
| 20Q GAIN MUTATED | 35 | 54.1 (13.5) |
| 20Q GAIN WILD-TYPE | 324 | 42.5 (13.0) |
Figure S14. Get High-res Image Gene #36: '20q gain' versus Clinical Feature #2: 'AGE'
P value = 7.27e-30 (Fisher's exact test), Q value = 3.4e-27
Table S15. Gene #40: '1p loss' versus Clinical Feature #5: 'HISTOLOGICAL.TYPE'
| nPatients | ASTROCYTOMA | OLIGOASTROCYTOMA | OLIGODENDROGLIOMA |
|---|---|---|---|
| ALL | 123 | 99 | 137 |
| 1P LOSS MUTATED | 7 | 28 | 97 |
| 1P LOSS WILD-TYPE | 116 | 71 | 40 |
Figure S15. Get High-res Image Gene #40: '1p loss' versus Clinical Feature #5: 'HISTOLOGICAL.TYPE'
P value = 0.000565 (Fisher's exact test), Q value = 0.25
Table S16. Gene #51: '6q loss' versus Clinical Feature #5: 'HISTOLOGICAL.TYPE'
| nPatients | ASTROCYTOMA | OLIGOASTROCYTOMA | OLIGODENDROGLIOMA |
|---|---|---|---|
| ALL | 123 | 99 | 137 |
| 6Q LOSS MUTATED | 25 | 9 | 7 |
| 6Q LOSS WILD-TYPE | 98 | 90 | 130 |
Figure S16. Get High-res Image Gene #51: '6q loss' versus Clinical Feature #5: 'HISTOLOGICAL.TYPE'
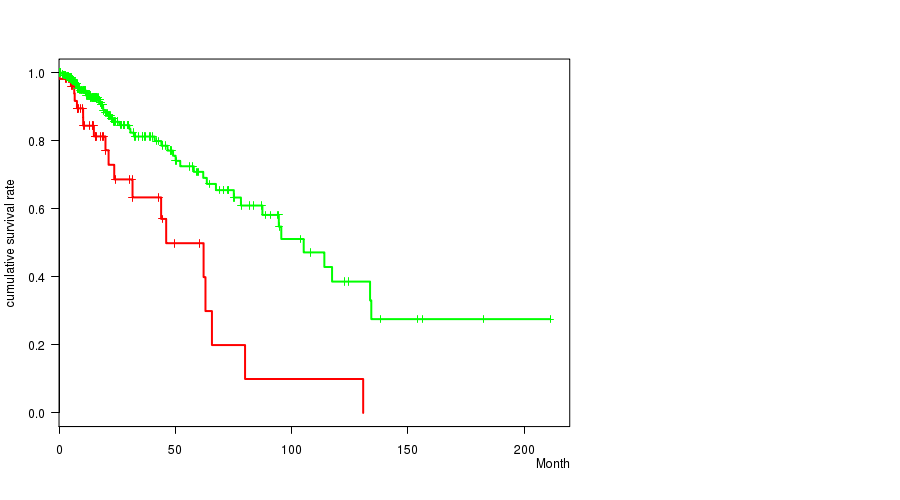
P value = 9.13e-05 (logrank test), Q value = 0.041
Table S17. Gene #56: '9p loss' versus Clinical Feature #1: 'Time to Death'
| nPatients | nDeath | Duration Range (Median), Month | |
|---|---|---|---|
| ALL | 356 | 68 | 0.0 - 211.2 (14.8) |
| 9P LOSS MUTATED | 78 | 25 | 0.1 - 117.4 (16.1) |
| 9P LOSS WILD-TYPE | 278 | 43 | 0.0 - 211.2 (14.5) |
Figure S17. Get High-res Image Gene #56: '9p loss' versus Clinical Feature #1: 'Time to Death'
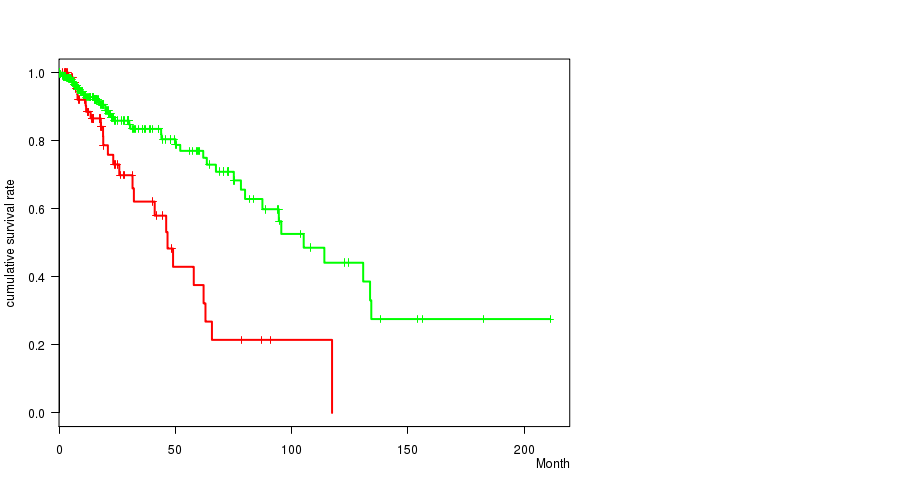
P value = 0 (logrank test), Q value = 0
Table S18. Gene #58: '10p loss' versus Clinical Feature #1: 'Time to Death'
| nPatients | nDeath | Duration Range (Median), Month | |
|---|---|---|---|
| ALL | 356 | 68 | 0.0 - 211.2 (14.8) |
| 10P LOSS MUTATED | 58 | 28 | 0.1 - 134.3 (11.4) |
| 10P LOSS WILD-TYPE | 298 | 40 | 0.0 - 211.2 (15.3) |
Figure S18. Get High-res Image Gene #58: '10p loss' versus Clinical Feature #1: 'Time to Death'
P value = 7.19e-13 (t-test), Q value = 3.3e-10
Table S19. Gene #58: '10p loss' versus Clinical Feature #2: 'AGE'
| nPatients | Mean (Std.Dev) | |
|---|---|---|
| ALL | 359 | 43.6 (13.5) |
| 10P LOSS MUTATED | 58 | 55.4 (11.4) |
| 10P LOSS WILD-TYPE | 301 | 41.3 (12.7) |
Figure S19. Get High-res Image Gene #58: '10p loss' versus Clinical Feature #2: 'AGE'

P value = 0.000346 (Fisher's exact test), Q value = 0.15
Table S20. Gene #58: '10p loss' versus Clinical Feature #5: 'HISTOLOGICAL.TYPE'
| nPatients | ASTROCYTOMA | OLIGOASTROCYTOMA | OLIGODENDROGLIOMA |
|---|---|---|---|
| ALL | 123 | 99 | 137 |
| 10P LOSS MUTATED | 33 | 13 | 12 |
| 10P LOSS WILD-TYPE | 90 | 86 | 125 |
Figure S20. Get High-res Image Gene #58: '10p loss' versus Clinical Feature #5: 'HISTOLOGICAL.TYPE'
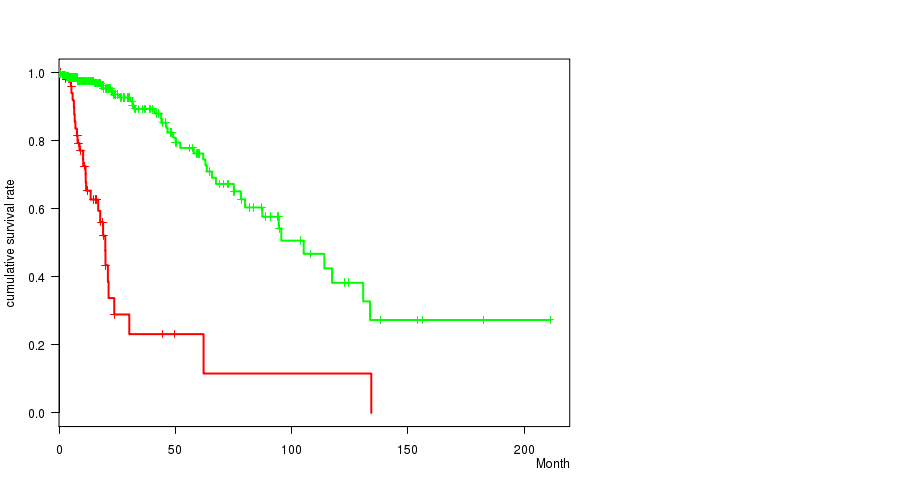
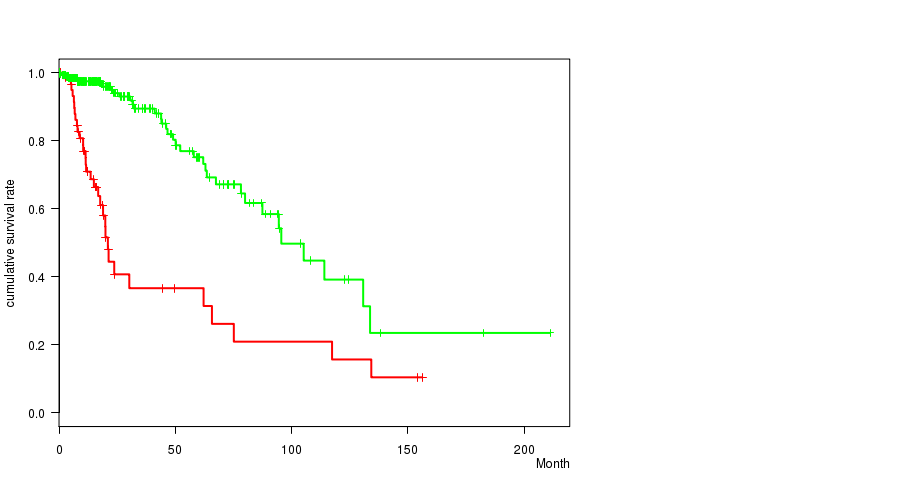
P value = 1.25e-10 (logrank test), Q value = 5.7e-08
Table S21. Gene #59: '10q loss' versus Clinical Feature #1: 'Time to Death'
| nPatients | nDeath | Duration Range (Median), Month | |
|---|---|---|---|
| ALL | 356 | 68 | 0.0 - 211.2 (14.8) |
| 10Q LOSS MUTATED | 67 | 32 | 0.1 - 156.2 (12.2) |
| 10Q LOSS WILD-TYPE | 289 | 36 | 0.0 - 211.2 (15.1) |
Figure S21. Get High-res Image Gene #59: '10q loss' versus Clinical Feature #1: 'Time to Death'
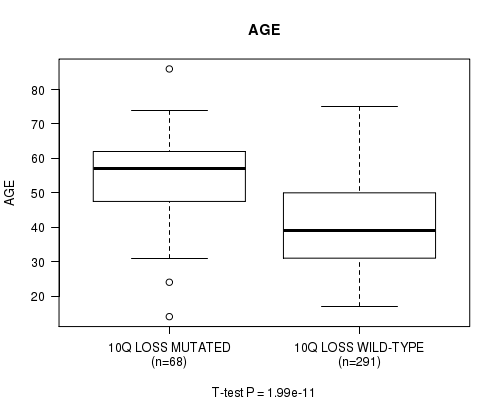
P value = 1.99e-11 (t-test), Q value = 9.1e-09
Table S22. Gene #59: '10q loss' versus Clinical Feature #2: 'AGE'
| nPatients | Mean (Std.Dev) | |
|---|---|---|
| ALL | 359 | 43.6 (13.5) |
| 10Q LOSS MUTATED | 68 | 54.0 (12.6) |
| 10Q LOSS WILD-TYPE | 291 | 41.2 (12.5) |
Figure S22. Get High-res Image Gene #59: '10q loss' versus Clinical Feature #2: 'AGE'
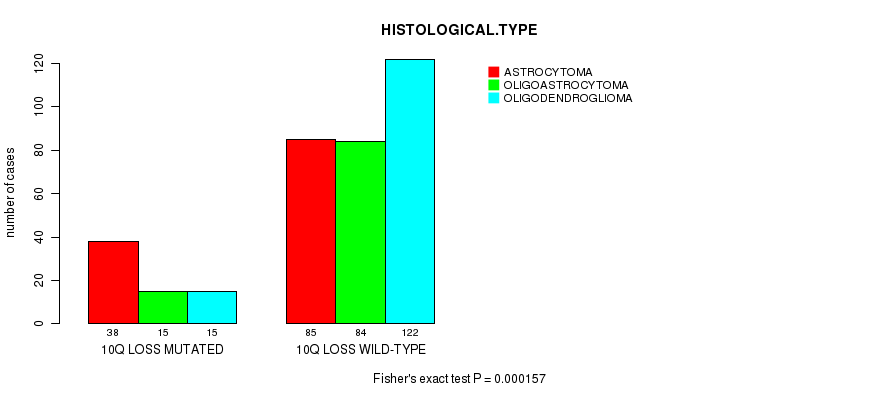
P value = 0.000157 (Fisher's exact test), Q value = 0.07
Table S23. Gene #59: '10q loss' versus Clinical Feature #5: 'HISTOLOGICAL.TYPE'
| nPatients | ASTROCYTOMA | OLIGOASTROCYTOMA | OLIGODENDROGLIOMA |
|---|---|---|---|
| ALL | 123 | 99 | 137 |
| 10Q LOSS MUTATED | 38 | 15 | 15 |
| 10Q LOSS WILD-TYPE | 85 | 84 | 122 |
Figure S23. Get High-res Image Gene #59: '10q loss' versus Clinical Feature #5: 'HISTOLOGICAL.TYPE'
P value = 2e-04 (logrank test), Q value = 0.089
Table S24. Gene #65: '14q loss' versus Clinical Feature #1: 'Time to Death'
| nPatients | nDeath | Duration Range (Median), Month | |
|---|---|---|---|
| ALL | 356 | 68 | 0.0 - 211.2 (14.8) |
| 14Q LOSS MUTATED | 54 | 19 | 0.2 - 130.8 (15.0) |
| 14Q LOSS WILD-TYPE | 302 | 49 | 0.0 - 211.2 (14.7) |
Figure S24. Get High-res Image Gene #65: '14q loss' versus Clinical Feature #1: 'Time to Death'
P value = 1.51e-26 (Fisher's exact test), Q value = 7e-24
Table S25. Gene #74: '19q loss' versus Clinical Feature #5: 'HISTOLOGICAL.TYPE'
| nPatients | ASTROCYTOMA | OLIGOASTROCYTOMA | OLIGODENDROGLIOMA |
|---|---|---|---|
| ALL | 123 | 99 | 137 |
| 19Q LOSS MUTATED | 15 | 31 | 103 |
| 19Q LOSS WILD-TYPE | 108 | 68 | 34 |
Figure S25. Get High-res Image Gene #74: '19q loss' versus Clinical Feature #5: 'HISTOLOGICAL.TYPE'
-
Copy number data file = transformed.cor.cli.txt
-
Clinical data file = LGG-TP.merged_data.txt
-
Number of patients = 359
-
Number of significantly arm-level cnvs = 78
-
Number of selected clinical features = 6
-
Exclude regions that fewer than K tumors have mutations, K = 3
For survival clinical features, the Kaplan-Meier survival curves of tumors with and without gene mutations were plotted and the statistical significance P values were estimated by logrank test (Bland and Altman 2004) using the 'survdiff' function in R
For continuous numerical clinical features, two-tailed Student's t test with unequal variance (Lehmann and Romano 2005) was applied to compare the clinical values between tumors with and without gene mutations using 't.test' function in R
For binary or multi-class clinical features (nominal or ordinal), two-tailed Fisher's exact tests (Fisher 1922) were used to estimate the P values using the 'fisher.test' function in R
For multiple hypothesis correction, Q value is the False Discovery Rate (FDR) analogue of the P value (Benjamini and Hochberg 1995), defined as the minimum FDR at which the test may be called significant. We used the 'Benjamini and Hochberg' method of 'p.adjust' function in R to convert P values into Q values.
In addition to the links below, the full results of the analysis summarized in this report can also be downloaded programmatically using firehose_get, or interactively from either the Broad GDAC website or TCGA Data Coordination Center Portal.