This pipeline computes the correlation between significant copy number variation (cnv focal) genes and molecular subtypes.
Testing the association between copy number variation 23 focal events and 6 molecular subtypes across 37 patients, 4 significant findings detected with P value < 0.05 and Q value < 0.25.
-
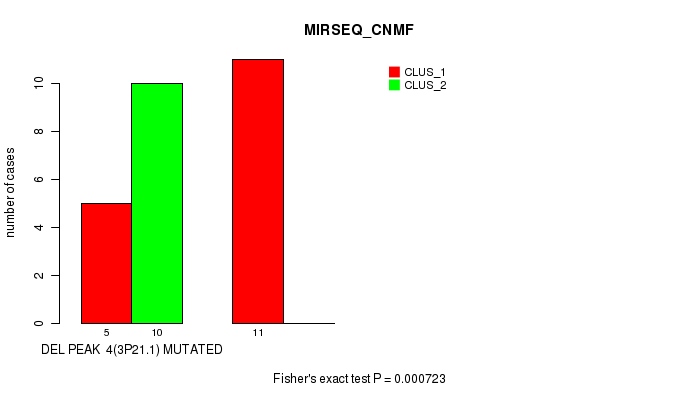
del_3p21.1 cnv correlated to 'MIRSEQ_CNMF' and 'MIRSEQ_MATURE_CNMF'.
-
del_9p21.3 cnv correlated to 'CN_CNMF'.
-
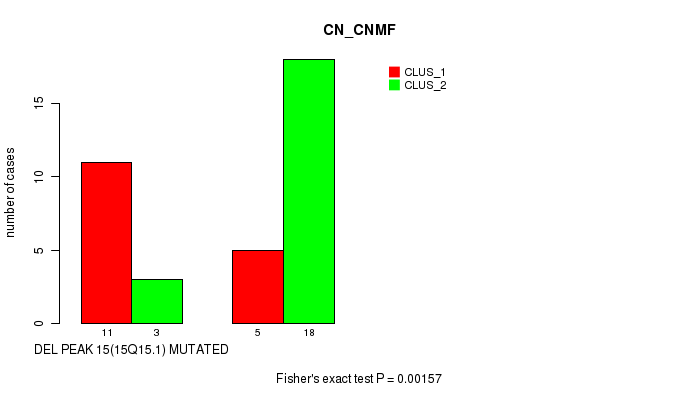
del_15q15.1 cnv correlated to 'CN_CNMF'.
Table 1. Get Full Table Overview of the association between significant copy number variation of 23 focal events and 6 molecular subtypes. Shown in the table are P values (Q values). Thresholded by P value < 0.05 and Q value < 0.25, 4 significant findings detected.
|
Clinical Features |
CN CNMF |
METHLYATION CNMF |
MIRSEQ CNMF |
MIRSEQ CHIERARCHICAL |
MIRSEQ MATURE CNMF |
MIRSEQ MATURE CHIERARCHICAL |
||
| nCNV (%) | nWild-Type | Fisher's exact test | Fisher's exact test | Fisher's exact test | Fisher's exact test | Fisher's exact test | Fisher's exact test | |
| del 3p21 1 | 21 (57%) | 16 |
0.519 (1.00) |
0.746 (1.00) |
0.000723 (0.0976) |
0.00824 (1.00) |
0.00172 (0.229) |
0.00522 (0.674) |
| del 9p21 3 | 23 (62%) | 14 |
2.1e-05 (0.00285) |
1 (1.00) |
1 (1.00) |
0.351 (1.00) |
1 (1.00) |
0.683 (1.00) |
| del 15q15 1 | 14 (38%) | 23 |
0.00157 (0.21) |
1 (1.00) |
1 (1.00) |
1 (1.00) |
1 (1.00) |
0.689 (1.00) |
| amp 12p11 21 | 10 (27%) | 27 |
0.00948 (1.00) |
0.46 (1.00) |
1 (1.00) |
0.228 (1.00) |
0.665 (1.00) |
1 (1.00) |
| amp 17q24 3 | 12 (32%) | 25 |
0.0768 (1.00) |
1 (1.00) |
1 (1.00) |
0.452 (1.00) |
0.665 (1.00) |
0.407 (1.00) |
| amp 19q13 43 | 4 (11%) | 33 |
0.296 (1.00) |
1 (1.00) |
1 (1.00) |
0.398 (1.00) |
1 (1.00) |
1 (1.00) |
| amp 20p12 1 | 4 (11%) | 33 |
0.618 (1.00) |
1 (1.00) |
1 (1.00) |
1 (1.00) |
1 (1.00) |
|
| del 1p36 23 | 17 (46%) | 20 |
0.00298 (0.39) |
1 (1.00) |
0.688 (1.00) |
0.112 (1.00) |
0.695 (1.00) |
0.428 (1.00) |
| del 1p22 1 | 17 (46%) | 20 |
0.104 (1.00) |
0.0994 (1.00) |
1 (1.00) |
0.0357 (1.00) |
1 (1.00) |
0.692 (1.00) |
| del 2q35 | 8 (22%) | 29 |
0.0554 (1.00) |
0.428 (1.00) |
1 (1.00) |
0.801 (1.00) |
0.598 (1.00) |
0.113 (1.00) |
| del 4q26 | 18 (49%) | 19 |
0.00814 (1.00) |
0.103 (1.00) |
1 (1.00) |
0.114 (1.00) |
1 (1.00) |
0.689 (1.00) |
| del 5q23 2 | 7 (19%) | 30 |
0.202 (1.00) |
0.416 (1.00) |
1 (1.00) |
0.508 (1.00) |
1 (1.00) |
1 (1.00) |
| del 6q22 31 | 20 (54%) | 17 |
0.508 (1.00) |
0.517 (1.00) |
1 (1.00) |
0.879 (1.00) |
1 (1.00) |
0.692 (1.00) |
| del 10p15 1 | 13 (35%) | 24 |
0.0357 (1.00) |
0.512 (1.00) |
1 (1.00) |
0.523 (1.00) |
0.692 (1.00) |
0.426 (1.00) |
| del 10q22 3 | 7 (19%) | 30 |
0.437 (1.00) |
0.68 (1.00) |
1 (1.00) |
0.604 (1.00) |
0.365 (1.00) |
0.348 (1.00) |
| del 10q24 1 | 13 (35%) | 24 |
0.489 (1.00) |
0.731 (1.00) |
0.228 (1.00) |
0.146 (1.00) |
0.0447 (1.00) |
0.0149 (1.00) |
| del 13q13 3 | 21 (57%) | 16 |
0.0178 (1.00) |
0.508 (1.00) |
1 (1.00) |
0.512 (1.00) |
1 (1.00) |
0.689 (1.00) |
| del 14q11 2 | 16 (43%) | 21 |
0.00896 (1.00) |
0.746 (1.00) |
0.105 (1.00) |
0.235 (1.00) |
0.431 (1.00) |
0.233 (1.00) |
| del 14q32 31 | 19 (51%) | 18 |
0.00255 (0.337) |
1 (1.00) |
0.105 (1.00) |
0.235 (1.00) |
0.431 (1.00) |
0.233 (1.00) |
| del 16p13 3 | 3 (8%) | 34 |
1 (1.00) |
0.0875 (1.00) |
1 (1.00) |
1 (1.00) |
1 (1.00) |
|
| del 16q21 | 9 (24%) | 28 |
0.0239 (1.00) |
1 (1.00) |
0.664 (1.00) |
1 (1.00) |
0.401 (1.00) |
0.218 (1.00) |
| del 16q24 1 | 11 (30%) | 26 |
0.00342 (0.445) |
0.495 (1.00) |
1 (1.00) |
0.635 (1.00) |
1 (1.00) |
0.683 (1.00) |
| del 22q12 2 | 29 (78%) | 8 |
0.104 (1.00) |
0.109 (1.00) |
0.0532 (1.00) |
0.151 (1.00) |
0.0171 (1.00) |
0.0237 (1.00) |
P value = 0.000723 (Fisher's exact test), Q value = 0.098
Table S1. Gene #8: 'del_3p21.1' versus Molecular Subtype #3: 'MIRSEQ_CNMF'
| nPatients | CLUS_1 | CLUS_2 |
|---|---|---|
| ALL | 16 | 10 |
| DEL PEAK 4(3P21.1) MUTATED | 5 | 10 |
| DEL PEAK 4(3P21.1) WILD-TYPE | 11 | 0 |
Figure S1. Get High-res Image Gene #8: 'del_3p21.1' versus Molecular Subtype #3: 'MIRSEQ_CNMF'
P value = 0.00172 (Fisher's exact test), Q value = 0.23
Table S2. Gene #8: 'del_3p21.1' versus Molecular Subtype #5: 'MIRSEQ_MATURE_CNMF'
| nPatients | CLUS_1 | CLUS_2 |
|---|---|---|
| ALL | 14 | 12 |
| DEL PEAK 4(3P21.1) MUTATED | 4 | 11 |
| DEL PEAK 4(3P21.1) WILD-TYPE | 10 | 1 |
Figure S2. Get High-res Image Gene #8: 'del_3p21.1' versus Molecular Subtype #5: 'MIRSEQ_MATURE_CNMF'

P value = 2.1e-05 (Fisher's exact test), Q value = 0.0029
Table S3. Gene #12: 'del_9p21.3' versus Molecular Subtype #1: 'CN_CNMF'
| nPatients | CLUS_1 | CLUS_2 |
|---|---|---|
| ALL | 16 | 21 |
| DEL PEAK 8(9P21.3) MUTATED | 16 | 7 |
| DEL PEAK 8(9P21.3) WILD-TYPE | 0 | 14 |
Figure S3. Get High-res Image Gene #12: 'del_9p21.3' versus Molecular Subtype #1: 'CN_CNMF'

P value = 0.00157 (Fisher's exact test), Q value = 0.21
Table S4. Gene #19: 'del_15q15.1' versus Molecular Subtype #1: 'CN_CNMF'
| nPatients | CLUS_1 | CLUS_2 |
|---|---|---|
| ALL | 16 | 21 |
| DEL PEAK 15(15Q15.1) MUTATED | 11 | 3 |
| DEL PEAK 15(15Q15.1) WILD-TYPE | 5 | 18 |
Figure S4. Get High-res Image Gene #19: 'del_15q15.1' versus Molecular Subtype #1: 'CN_CNMF'
-
Copy number data file = transformed.cor.cli.txt
-
Molecular subtype file = MESO-TP.transferedmergedcluster.txt
-
Number of patients = 37
-
Number of significantly focal cnvs = 23
-
Number of molecular subtypes = 6
-
Exclude genes that fewer than K tumors have alterations, K = 3
For binary or multi-class clinical features (nominal or ordinal), two-tailed Fisher's exact tests (Fisher 1922) were used to estimate the P values using the 'fisher.test' function in R
For multiple hypothesis correction, Q value is the False Discovery Rate (FDR) analogue of the P value (Benjamini and Hochberg 1995), defined as the minimum FDR at which the test may be called significant. We used the 'Benjamini and Hochberg' method of 'p.adjust' function in R to convert P values into Q values.
In addition to the links below, the full results of the analysis summarized in this report can also be downloaded programmatically using firehose_get, or interactively from either the Broad GDAC website or TCGA Data Coordination Center Portal.