This pipeline uses various statistical tests to identify mRNAs whose expression levels correlated to selected clinical features.
Testing the association between 18258 genes and 13 clinical features across 206 samples, statistically thresholded by Q value < 0.05, 11 clinical features related to at least one genes.
-
1 gene correlated to 'AGE'.
-
ADAP2|55803
-
19 genes correlated to 'PATHOLOGY.T.STAGE'.
-
MT1H|4496 , GMDS|2762 , FAM189A2|9413 , OSGIN2|734 , CHRNA2|1135 , ...
-
6 genes correlated to 'PATHOLOGY.N.STAGE'.
-
NKX6-2|84504 , PRTN3|5657 , CRHR2|1395 , SLMO2|51012 , LCNL1|401562 , ...
-
1 gene correlated to 'COMPLETENESS.OF.RESECTION'.
-
GLP2R|9340
-
60 genes correlated to 'GLEASON_SCORE_COMBINED'.
-
ZNF250|58500 , FAM72B|653820 , FA2H|79152 , SH3RF2|153769 , C12ORF48|55010 , ...
-
67 genes correlated to 'GLEASON_SCORE_PRIMARY'.
-
KANK4|163782 , METTL6|131965 , SH3RF2|153769 , C2|717 , CD38|952 , ...
-
105 genes correlated to 'GLEASON_SCORE'.
-
FA2H|79152 , FAM72A|729533 , C12ORF48|55010 , FMOD|2331 , CCNE2|9134 , ...
-
30 genes correlated to 'PSA_RESULT_PREOP'.
-
DDX19B|11269 , KANK4|163782 , SH2D3A|10045 , CA11|770 , COL23A1|91522 , ...
-
774 genes correlated to 'DAYS_TO_PREOP_PSA'.
-
CCDC124|115098 , ZNF808|388558 , ARFRP1|10139 , MYPOP|339344 , HSD11B1L|374875 , ...
-
1 gene correlated to 'PSA_VALUE'.
-
C9ORF85|138241
-
4 genes correlated to 'DAYS_TO_PSA'.
-
HOOK2|29911 , PAN2|9924 , LOC100128842|100128842 , GTF2IRD2B|389524
-
No genes correlated to 'NUMBER.OF.LYMPH.NODES', and 'GLEASON_SCORE_SECONDARY'.
Complete statistical result table is provided in Supplement Table 1
Table 1. Get Full Table This table shows the clinical features, statistical methods used, and the number of genes that are significantly associated with each clinical feature at Q value < 0.05.
| Clinical feature | Statistical test | Significant genes | Associated with | Associated with | ||
|---|---|---|---|---|---|---|
| AGE | Spearman correlation test | N=1 | older | N=1 | younger | N=0 |
| PATHOLOGY T STAGE | Spearman correlation test | N=19 | higher stage | N=5 | lower stage | N=14 |
| PATHOLOGY N STAGE | t test | N=6 | class1 | N=1 | class0 | N=5 |
| COMPLETENESS OF RESECTION | ANOVA test | N=1 | ||||
| NUMBER OF LYMPH NODES | Spearman correlation test | N=0 | ||||
| GLEASON_SCORE_COMBINED | Spearman correlation test | N=60 | higher score | N=46 | lower score | N=14 |
| GLEASON_SCORE_PRIMARY | Spearman correlation test | N=67 | higher score | N=18 | lower score | N=49 |
| GLEASON_SCORE_SECONDARY | Spearman correlation test | N=0 | ||||
| GLEASON_SCORE | Spearman correlation test | N=105 | higher score | N=80 | lower score | N=25 |
| PSA_RESULT_PREOP | Spearman correlation test | N=30 | higher psa_result_preop | N=2 | lower psa_result_preop | N=28 |
| DAYS_TO_PREOP_PSA | Spearman correlation test | N=774 | higher days_to_preop_psa | N=353 | lower days_to_preop_psa | N=421 |
| PSA_VALUE | Spearman correlation test | N=1 | higher psa_value | N=1 | lower psa_value | N=0 |
| DAYS_TO_PSA | Spearman correlation test | N=4 | higher days_to_psa | N=0 | lower days_to_psa | N=4 |
Table S1. Basic characteristics of clinical feature: 'AGE'
| AGE | Mean (SD) | 60.28 (6.9) |
| Significant markers | N = 1 | |
| pos. correlated | 1 | |
| neg. correlated | 0 |
Table S2. Get Full Table List of one gene significantly correlated to 'AGE' by Spearman correlation test
| SpearmanCorr | corrP | Q | |
|---|---|---|---|
| ADAP2|55803 | 0.3771 | 2.708e-08 | 0.000494 |
Figure S1. Get High-res Image As an example, this figure shows the association of ADAP2|55803 to 'AGE'. P value = 2.71e-08 with Spearman correlation analysis. The straight line presents the best linear regression.
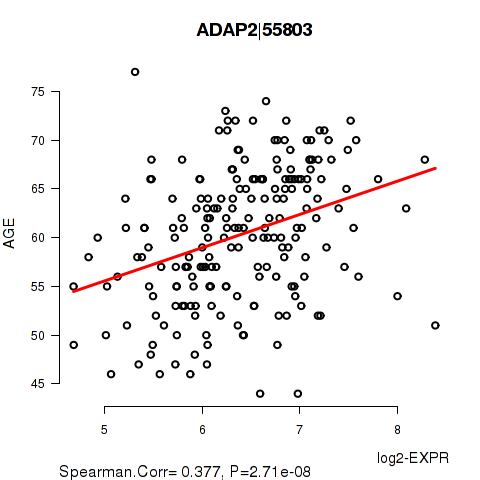
Table S3. Basic characteristics of clinical feature: 'PATHOLOGY.T.STAGE'
| PATHOLOGY.T.STAGE | Mean (SD) | 2.57 (0.54) |
| N | ||
| 2 | 92 | |
| 3 | 107 | |
| 4 | 5 | |
| Significant markers | N = 19 | |
| pos. correlated | 5 | |
| neg. correlated | 14 |
Table S4. Get Full Table List of top 10 genes significantly correlated to 'PATHOLOGY.T.STAGE' by Spearman correlation test
| SpearmanCorr | corrP | Q | |
|---|---|---|---|
| MT1H|4496 | -0.3663 | 7.683e-08 | 0.0014 |
| GMDS|2762 | -0.36 | 1.23e-07 | 0.00225 |
| FAM189A2|9413 | -0.3592 | 1.32e-07 | 0.00241 |
| OSGIN2|734 | 0.3567 | 1.635e-07 | 0.00299 |
| CHRNA2|1135 | -0.3518 | 2.466e-07 | 0.0045 |
| FA2H|79152 | -0.3501 | 2.861e-07 | 0.00522 |
| KCNK6|9424 | -0.3488 | 3.183e-07 | 0.00581 |
| EPHX2|2053 | -0.3435 | 4.896e-07 | 0.00894 |
| GPR108|56927 | -0.3361 | 8.926e-07 | 0.0163 |
| PLA2G4F|255189 | -0.3354 | 9.365e-07 | 0.0171 |
Figure S2. Get High-res Image As an example, this figure shows the association of MT1H|4496 to 'PATHOLOGY.T.STAGE'. P value = 7.68e-08 with Spearman correlation analysis.
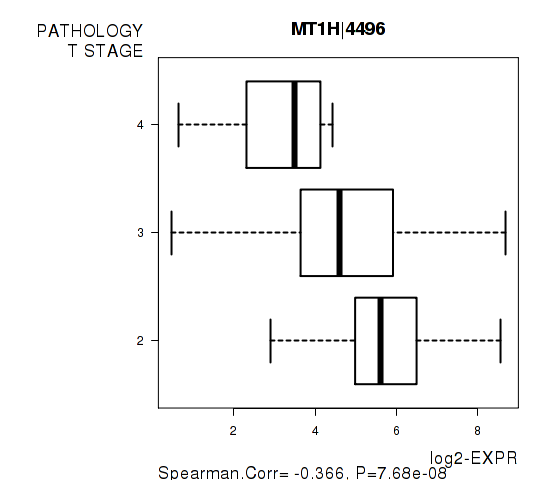
Table S5. Basic characteristics of clinical feature: 'PATHOLOGY.N.STAGE'
| PATHOLOGY.N.STAGE | Labels | N |
| class0 | 156 | |
| class1 | 17 | |
| Significant markers | N = 6 | |
| Higher in class1 | 1 | |
| Higher in class0 | 5 |
Table S6. Get Full Table List of 6 genes differentially expressed by 'PATHOLOGY.N.STAGE'
| T(pos if higher in 'class1') | ttestP | Q | AUC | |
|---|---|---|---|---|
| NKX6-2|84504 | -7.62 | 1.14e-09 | 2.08e-05 | 0.8951 |
| PRTN3|5657 | -7.96 | 1.471e-09 | 2.68e-05 | 0.814 |
| CRHR2|1395 | -9.24 | 8.274e-08 | 0.00151 | 0.9494 |
| SLMO2|51012 | 5.64 | 1.003e-06 | 0.0183 | 0.759 |
| LCNL1|401562 | -5.75 | 2.191e-06 | 0.04 | 0.7526 |
| FABP7|2173 | -6.42 | 2.355e-06 | 0.043 | 0.7979 |
Figure S3. Get High-res Image As an example, this figure shows the association of NKX6-2|84504 to 'PATHOLOGY.N.STAGE'. P value = 1.14e-09 with T-test analysis.
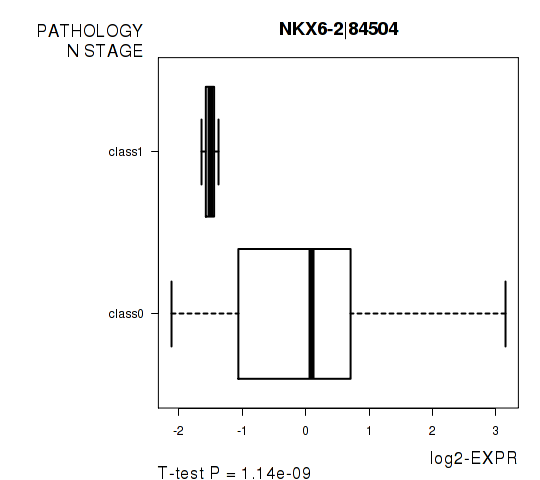
Table S7. Basic characteristics of clinical feature: 'COMPLETENESS.OF.RESECTION'
| COMPLETENESS.OF.RESECTION | Labels | N |
| R0 | 153 | |
| R1 | 38 | |
| RX | 5 | |
| Significant markers | N = 1 |
Table S8. Get Full Table List of one gene differentially expressed by 'COMPLETENESS.OF.RESECTION'
| ANOVA_P | Q | |
|---|---|---|
| GLP2R|9340 | 8.781e-11 | 1.6e-06 |
Figure S4. Get High-res Image As an example, this figure shows the association of GLP2R|9340 to 'COMPLETENESS.OF.RESECTION'. P value = 8.78e-11 with ANOVA analysis.
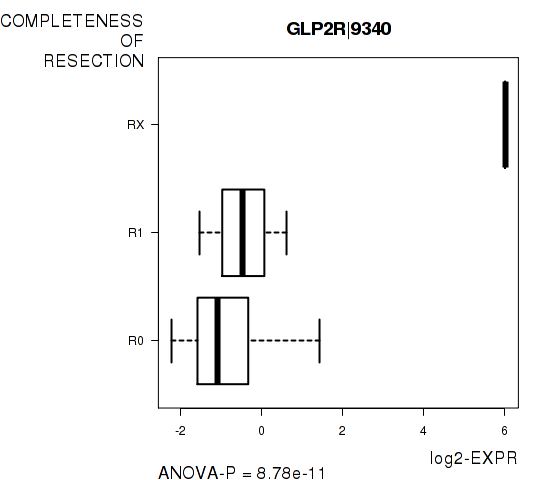
Table S9. Basic characteristics of clinical feature: 'NUMBER.OF.LYMPH.NODES'
| NUMBER.OF.LYMPH.NODES | Mean (SD) | 0.18 (0.67) |
| Value | N | |
| 0 | 154 | |
| 1 | 11 | |
| 2 | 2 | |
| 3 | 3 | |
| 6 | 1 | |
| Significant markers | N = 0 |
Table S10. Basic characteristics of clinical feature: 'GLEASON_SCORE_COMBINED'
| GLEASON_SCORE_COMBINED | Mean (SD) | 7.23 (0.77) |
| Significant markers | N = 60 | |
| pos. correlated | 46 | |
| neg. correlated | 14 |
Table S11. Get Full Table List of top 10 genes significantly correlated to 'GLEASON_SCORE_COMBINED' by Spearman correlation test
| SpearmanCorr | corrP | Q | |
|---|---|---|---|
| ZNF250|58500 | 0.3925 | 5.396e-09 | 9.85e-05 |
| FAM72B|653820 | 0.3839 | 1.224e-08 | 0.000223 |
| FA2H|79152 | -0.3818 | 1.495e-08 | 0.000273 |
| SH3RF2|153769 | -0.3799 | 1.782e-08 | 0.000325 |
| C12ORF48|55010 | 0.3782 | 2.093e-08 | 0.000382 |
| FAM72A|729533 | 0.3858 | 2.998e-08 | 0.000547 |
| CBX1|10951 | 0.3683 | 5.124e-08 | 0.000935 |
| ARL6IP1|23204 | 0.3651 | 6.806e-08 | 0.00124 |
| CCNE2|9134 | 0.3641 | 7.436e-08 | 0.00136 |
| FMOD|2331 | -0.3604 | 1.035e-07 | 0.00189 |
Figure S5. Get High-res Image As an example, this figure shows the association of ZNF250|58500 to 'GLEASON_SCORE_COMBINED'. P value = 5.4e-09 with Spearman correlation analysis. The straight line presents the best linear regression.
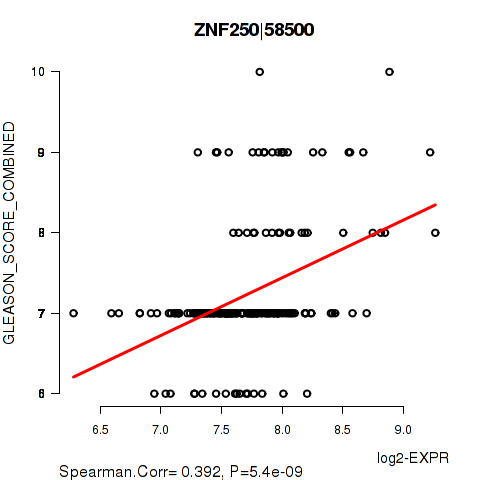
Table S12. Basic characteristics of clinical feature: 'GLEASON_SCORE_PRIMARY'
| GLEASON_SCORE_PRIMARY | Mean (SD) | 3.47 (0.57) |
| Score | N | |
| 2 | 1 | |
| 3 | 115 | |
| 4 | 83 | |
| 5 | 7 | |
| Significant markers | N = 67 | |
| pos. correlated | 18 | |
| neg. correlated | 49 |
Table S13. Get Full Table List of top 10 genes significantly correlated to 'GLEASON_SCORE_PRIMARY' by Spearman correlation test
| SpearmanCorr | corrP | Q | |
|---|---|---|---|
| KANK4|163782 | -0.4278 | 1.421e-10 | 2.6e-06 |
| METTL6|131965 | 0.4221 | 2.628e-10 | 4.8e-06 |
| SH3RF2|153769 | -0.4202 | 3.235e-10 | 5.9e-06 |
| C2|717 | -0.3839 | 1.224e-08 | 0.000223 |
| CD38|952 | -0.3821 | 1.449e-08 | 0.000264 |
| PIPOX|51268 | -0.369 | 4.807e-08 | 0.000877 |
| DPT|1805 | -0.3673 | 5.638e-08 | 0.00103 |
| FERMT1|55612 | -0.3672 | 5.675e-08 | 0.00104 |
| EDN3|1908 | -0.3682 | 6.006e-08 | 0.0011 |
| SGEF|26084 | 0.364 | 7.53e-08 | 0.00137 |
Figure S6. Get High-res Image As an example, this figure shows the association of KANK4|163782 to 'GLEASON_SCORE_PRIMARY'. P value = 1.42e-10 with Spearman correlation analysis.
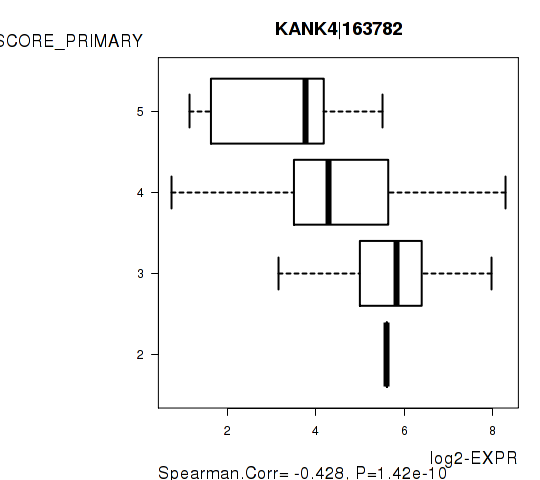
Table S14. Basic characteristics of clinical feature: 'GLEASON_SCORE_SECONDARY'
| GLEASON_SCORE_SECONDARY | Mean (SD) | 3.77 (0.61) |
| Score | N | |
| 3 | 68 | |
| 4 | 118 | |
| 5 | 20 | |
| Significant markers | N = 0 |
Table S15. Basic characteristics of clinical feature: 'GLEASON_SCORE'
| GLEASON_SCORE | Mean (SD) | 7.28 (0.8) |
| Score | N | |
| 6 | 16 | |
| 7 | 143 | |
| 8 | 22 | |
| 9 | 23 | |
| 10 | 2 | |
| Significant markers | N = 105 | |
| pos. correlated | 80 | |
| neg. correlated | 25 |
Table S16. Get Full Table List of top 10 genes significantly correlated to 'GLEASON_SCORE' by Spearman correlation test
| SpearmanCorr | corrP | Q | |
|---|---|---|---|
| FA2H|79152 | -0.4187 | 3.773e-10 | 6.89e-06 |
| FAM72A|729533 | 0.412 | 2.634e-09 | 4.81e-05 |
| C12ORF48|55010 | 0.3964 | 3.671e-09 | 6.7e-05 |
| FMOD|2331 | -0.3942 | 4.555e-09 | 8.32e-05 |
| CCNE2|9134 | 0.3903 | 6.645e-09 | 0.000121 |
| SH3RF2|153769 | -0.3891 | 7.449e-09 | 0.000136 |
| FAM72B|653820 | 0.3822 | 1.438e-08 | 0.000262 |
| HMGB2|3148 | 0.3802 | 1.73e-08 | 0.000316 |
| NUF2|83540 | 0.3747 | 2.885e-08 | 0.000526 |
| CBX1|10951 | 0.3737 | 3.162e-08 | 0.000577 |
Figure S7. Get High-res Image As an example, this figure shows the association of FA2H|79152 to 'GLEASON_SCORE'. P value = 3.77e-10 with Spearman correlation analysis.
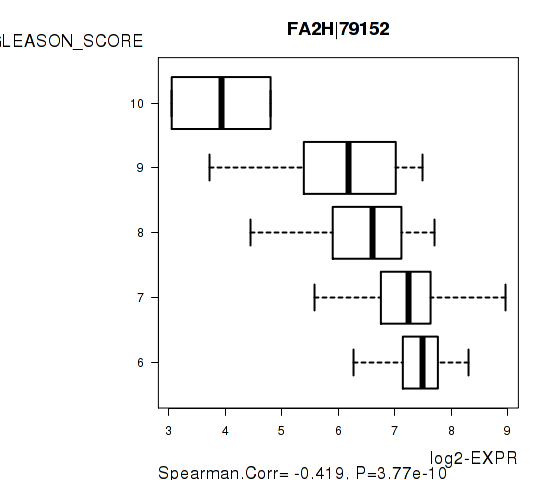
Table S17. Basic characteristics of clinical feature: 'PSA_RESULT_PREOP'
| PSA_RESULT_PREOP | Mean (SD) | 10.26 (10) |
| Significant markers | N = 30 | |
| pos. correlated | 2 | |
| neg. correlated | 28 |
Table S18. Get Full Table List of top 10 genes significantly correlated to 'PSA_RESULT_PREOP' by Spearman correlation test
| SpearmanCorr | corrP | Q | |
|---|---|---|---|
| DDX19B|11269 | -0.3945 | 5.283e-09 | 9.65e-05 |
| KANK4|163782 | -0.3939 | 5.601e-09 | 0.000102 |
| SH2D3A|10045 | -0.3666 | 6.914e-08 | 0.00126 |
| CA11|770 | -0.3663 | 7.137e-08 | 0.0013 |
| COL23A1|91522 | -0.364 | 8.708e-08 | 0.00159 |
| SOX15|6665 | -0.3605 | 1.183e-07 | 0.00216 |
| ATCAY|85300 | -0.3568 | 1.736e-07 | 0.00317 |
| RAB6A|5870 | 0.3458 | 4.073e-07 | 0.00743 |
| CDC42EP4|23580 | -0.3416 | 5.743e-07 | 0.0105 |
| PTPLA|9200 | -0.3406 | 6.194e-07 | 0.0113 |
Figure S8. Get High-res Image As an example, this figure shows the association of DDX19B|11269 to 'PSA_RESULT_PREOP'. P value = 5.28e-09 with Spearman correlation analysis. The straight line presents the best linear regression.
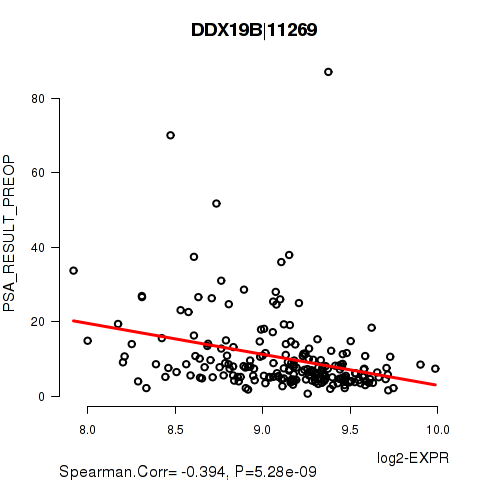
Table S19. Basic characteristics of clinical feature: 'DAYS_TO_PREOP_PSA'
| DAYS_TO_PREOP_PSA | Mean (SD) | -3.45 (96) |
| Significant markers | N = 774 | |
| pos. correlated | 353 | |
| neg. correlated | 421 |
Table S20. Get Full Table List of top 10 genes significantly correlated to 'DAYS_TO_PREOP_PSA' by Spearman correlation test
| SpearmanCorr | corrP | Q | |
|---|---|---|---|
| CCDC124|115098 | -0.4177 | 7.531e-10 | 1.37e-05 |
| ZNF808|388558 | 0.4157 | 9.298e-10 | 1.7e-05 |
| ARFRP1|10139 | -0.4151 | 9.895e-10 | 1.81e-05 |
| MYPOP|339344 | -0.412 | 1.348e-09 | 2.46e-05 |
| HSD11B1L|374875 | -0.4108 | 1.526e-09 | 2.79e-05 |
| RGPD4|285190 | 0.4081 | 1.994e-09 | 3.64e-05 |
| ALKBH7|84266 | -0.4068 | 2.276e-09 | 4.15e-05 |
| JOSD2|126119 | -0.4067 | 2.282e-09 | 4.17e-05 |
| MARCH7|64844 | 0.4062 | 2.393e-09 | 4.37e-05 |
| ATP5D|513 | -0.4052 | 2.662e-09 | 4.86e-05 |
Figure S9. Get High-res Image As an example, this figure shows the association of CCDC124|115098 to 'DAYS_TO_PREOP_PSA'. P value = 7.53e-10 with Spearman correlation analysis. The straight line presents the best linear regression.
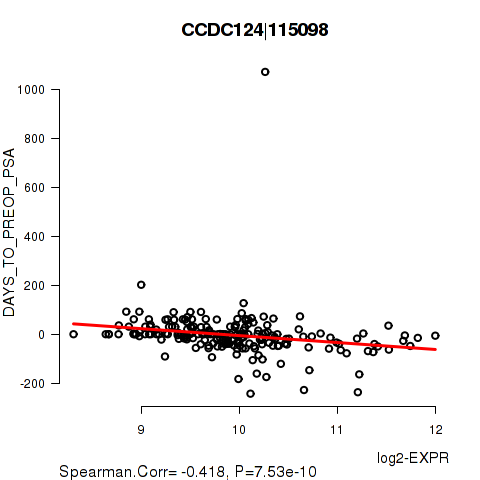
Table S21. Basic characteristics of clinical feature: 'PSA_VALUE'
| PSA_VALUE | Mean (SD) | 1.35 (4.3) |
| Significant markers | N = 1 | |
| pos. correlated | 1 | |
| neg. correlated | 0 |
Table S22. Get Full Table List of one gene significantly correlated to 'PSA_VALUE' by Spearman correlation test
| SpearmanCorr | corrP | Q | |
|---|---|---|---|
| C9ORF85|138241 | 0.3454 | 2.498e-06 | 0.0456 |
Figure S10. Get High-res Image As an example, this figure shows the association of C9ORF85|138241 to 'PSA_VALUE'. P value = 2.5e-06 with Spearman correlation analysis. The straight line presents the best linear regression.
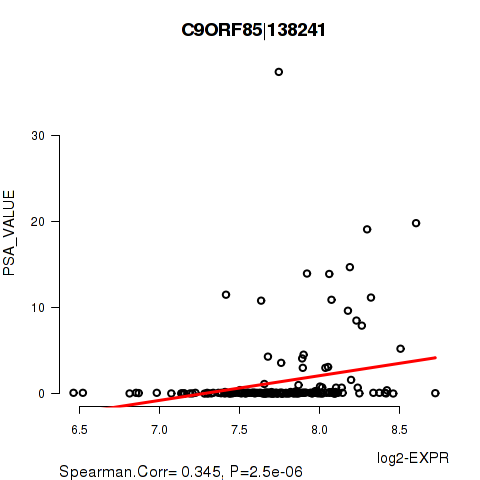
Table S23. Basic characteristics of clinical feature: 'DAYS_TO_PSA'
| DAYS_TO_PSA | Mean (SD) | 574.9 (550) |
| Significant markers | N = 4 | |
| pos. correlated | 0 | |
| neg. correlated | 4 |
Table S24. Get Full Table List of 4 genes significantly correlated to 'DAYS_TO_PSA' by Spearman correlation test
| SpearmanCorr | corrP | Q | |
|---|---|---|---|
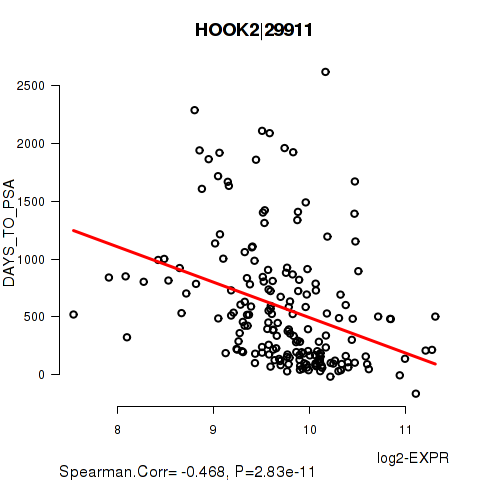
| HOOK2|29911 | -0.4676 | 2.835e-11 | 5.18e-07 |
| PAN2|9924 | -0.383 | 9.522e-08 | 0.00174 |
| LOC100128842|100128842 | -0.3563 | 7.945e-07 | 0.0145 |
| GTF2IRD2B|389524 | -0.3435 | 2.067e-06 | 0.0377 |
Figure S11. Get High-res Image As an example, this figure shows the association of HOOK2|29911 to 'DAYS_TO_PSA'. P value = 2.83e-11 with Spearman correlation analysis. The straight line presents the best linear regression.
-
Expresson data file = PRAD-TP.uncv2.mRNAseq_RSEM_normalized_log2.txt
-
Clinical data file = PRAD-TP.merged_data.txt
-
Number of patients = 206
-
Number of genes = 18258
-
Number of clinical features = 13
For continuous numerical clinical features, Spearman's rank correlation coefficients (Spearman 1904) and two-tailed P values were estimated using 'cor.test' function in R
For two-class clinical features, two-tailed Student's t test with unequal variance (Lehmann and Romano 2005) was applied to compare the log2-expression levels between the two clinical classes using 't.test' function in R
For multi-class clinical features (ordinal or nominal), one-way analysis of variance (Howell 2002) was applied to compare the log2-expression levels between different clinical classes using 'anova' function in R
For multiple hypothesis correction, Q value is the False Discovery Rate (FDR) analogue of the P value (Benjamini and Hochberg 1995), defined as the minimum FDR at which the test may be called significant. We used the 'Benjamini and Hochberg' method of 'p.adjust' function in R to convert P values into Q values.
In addition to the links below, the full results of the analysis summarized in this report can also be downloaded programmatically using firehose_get, or interactively from either the Broad GDAC website or TCGA Data Coordination Center Portal.