This pipeline computes the correlation between significantly recurrent gene mutations and selected clinical features.
Testing the association between mutation status of 125 genes and 7 clinical features across 56 patients, 2 significant findings detected with Q value < 0.25.
-
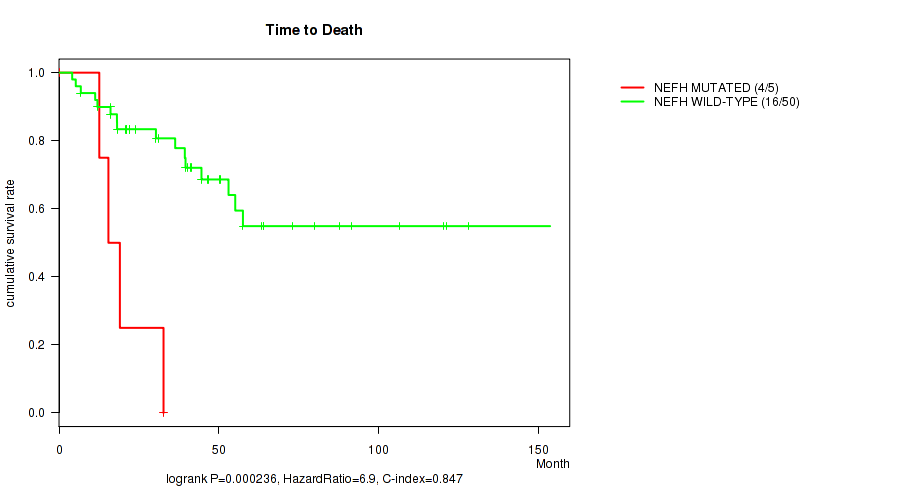
NEFH mutation correlated to 'Time to Death'.
-
PTX4 mutation correlated to 'Time to Death'.
Table 1. Get Full Table Overview of the association between mutation status of 125 genes and 7 clinical features. Shown in the table are P values (Q values). Thresholded by Q value < 0.25, 2 significant findings detected.
|
Clinical Features |
Time to Death |
AGE |
NEOPLASM DISEASESTAGE |
PATHOLOGY T STAGE |
PATHOLOGY N STAGE |
GENDER | ETHNICITY | ||
| nMutated (%) | nWild-Type | logrank test | Wilcoxon-test | Fisher's exact test | Fisher's exact test | Fisher's exact test | Fisher's exact test | Fisher's exact test | |
| NEFH | 5 (9%) | 51 |
0.000236 (0.2) |
0.307 (1.00) |
0.652 (1.00) |
0.2 (1.00) |
0.465 (1.00) |
1 (1.00) |
0.145 (1.00) |
| PTX4 | 3 (5%) | 53 |
0.000239 (0.203) |
0.267 (1.00) |
0.0263 (1.00) |
0.0725 (1.00) |
1 (1.00) |
1 (1.00) |
1 (1.00) |
| ZFPM1 | 23 (41%) | 33 |
0.175 (1.00) |
0.434 (1.00) |
0.256 (1.00) |
0.949 (1.00) |
0.683 (1.00) |
0.777 (1.00) |
1 (1.00) |
| LACTB | 17 (30%) | 39 |
0.651 (1.00) |
0.695 (1.00) |
0.176 (1.00) |
0.0765 (1.00) |
1 (1.00) |
0.543 (1.00) |
0.646 (1.00) |
| CCDC102A | 16 (29%) | 40 |
0.193 (1.00) |
0.31 (1.00) |
0.138 (1.00) |
0.249 (1.00) |
0.161 (1.00) |
1 (1.00) |
0.639 (1.00) |
| ZNF517 | 11 (20%) | 45 |
0.621 (1.00) |
0.117 (1.00) |
0.766 (1.00) |
0.736 (1.00) |
1 (1.00) |
0.732 (1.00) |
0.545 (1.00) |
| TOR3A | 11 (20%) | 45 |
0.575 (1.00) |
0.613 (1.00) |
0.192 (1.00) |
0.182 (1.00) |
0.581 (1.00) |
0.481 (1.00) |
1 (1.00) |
| USP42 | 13 (23%) | 43 |
0.355 (1.00) |
0.281 (1.00) |
0.554 (1.00) |
0.811 (1.00) |
0.627 (1.00) |
1 (1.00) |
1 (1.00) |
| CLDN23 | 10 (18%) | 46 |
0.992 (1.00) |
0.814 (1.00) |
0.588 (1.00) |
0.656 (1.00) |
0.315 (1.00) |
0.467 (1.00) |
0.545 (1.00) |
| TP53 | 11 (20%) | 45 |
0.0356 (1.00) |
0.628 (1.00) |
0.159 (1.00) |
0.406 (1.00) |
1 (1.00) |
0.481 (1.00) |
0.574 (1.00) |
| KCNK17 | 8 (14%) | 48 |
0.293 (1.00) |
0.888 (1.00) |
0.892 (1.00) |
0.416 (1.00) |
0.582 (1.00) |
0.423 (1.00) |
0.145 (1.00) |
| LZTR1 | 4 (7%) | 52 |
0.159 (1.00) |
0.484 (1.00) |
0.878 (1.00) |
0.882 (1.00) |
0.391 (1.00) |
0.598 (1.00) |
1 (1.00) |
| APOE | 5 (9%) | 51 |
0.676 (1.00) |
0.139 (1.00) |
1 (1.00) |
0.883 (1.00) |
1 (1.00) |
0.324 (1.00) |
|
| CCDC105 | 6 (11%) | 50 |
0.499 (1.00) |
0.361 (1.00) |
0.437 (1.00) |
0.13 (1.00) |
0.532 (1.00) |
0.0857 (1.00) |
1 (1.00) |
| RINL | 7 (12%) | 49 |
0.373 (1.00) |
0.766 (1.00) |
0.602 (1.00) |
0.537 (1.00) |
1 (1.00) |
1 (1.00) |
0.253 (1.00) |
| MAL2 | 9 (16%) | 47 |
0.342 (1.00) |
0.215 (1.00) |
0.771 (1.00) |
0.289 (1.00) |
0.267 (1.00) |
0.0212 (1.00) |
0.29 (1.00) |
| LRIG1 | 14 (25%) | 42 |
0.566 (1.00) |
0.712 (1.00) |
0.723 (1.00) |
0.898 (1.00) |
0.15 (1.00) |
0.338 (1.00) |
0.639 (1.00) |
| C19ORF10 | 6 (11%) | 50 |
0.236 (1.00) |
0.194 (1.00) |
0.111 (1.00) |
0.42 (1.00) |
0.532 (1.00) |
0.652 (1.00) |
1 (1.00) |
| C10ORF95 | 6 (11%) | 50 |
0.559 (1.00) |
0.842 (1.00) |
0.382 (1.00) |
1 (1.00) |
1 (1.00) |
1 (1.00) |
0.551 (1.00) |
| SYT8 | 5 (9%) | 51 |
0.394 (1.00) |
0.537 (1.00) |
0.382 (1.00) |
1 (1.00) |
1 (1.00) |
0.652 (1.00) |
1 (1.00) |
| IDUA | 8 (14%) | 48 |
0.424 (1.00) |
0.153 (1.00) |
0.207 (1.00) |
0.502 (1.00) |
0.582 (1.00) |
1 (1.00) |
0.551 (1.00) |
| HHIPL1 | 6 (11%) | 50 |
0.291 (1.00) |
0.333 (1.00) |
0.576 (1.00) |
0.681 (1.00) |
0.532 (1.00) |
0.397 (1.00) |
1 (1.00) |
| ASPDH | 8 (14%) | 48 |
0.803 (1.00) |
0.861 (1.00) |
0.00714 (1.00) |
0.532 (1.00) |
0.131 (1.00) |
0.703 (1.00) |
1 (1.00) |
| C1ORF106 | 8 (14%) | 48 |
0.222 (1.00) |
0.504 (1.00) |
0.389 (1.00) |
0.249 (1.00) |
0.219 (1.00) |
0.243 (1.00) |
0.545 (1.00) |
| THEM4 | 4 (7%) | 52 |
0.342 (1.00) |
0.445 (1.00) |
0.459 (1.00) |
0.299 (1.00) |
0.308 (1.00) |
1 (1.00) |
1 (1.00) |
| CTNNB1 | 6 (11%) | 50 |
0.468 (1.00) |
0.0803 (1.00) |
0.71 (1.00) |
0.926 (1.00) |
0.131 (1.00) |
0.0857 (1.00) |
0.551 (1.00) |
| GDF1 | 4 (7%) | 52 |
0.136 (1.00) |
0.874 (1.00) |
0.333 (1.00) |
0.585 (1.00) |
1 (1.00) |
0.598 (1.00) |
1 (1.00) |
| TSC22D2 | 8 (14%) | 48 |
0.115 (1.00) |
0.504 (1.00) |
0.573 (1.00) |
0.3 (1.00) |
0.582 (1.00) |
0.703 (1.00) |
1 (1.00) |
| ZAR1 | 11 (20%) | 45 |
0.528 (1.00) |
0.543 (1.00) |
0.531 (1.00) |
0.248 (1.00) |
0.592 (1.00) |
0.0769 (1.00) |
0.545 (1.00) |
| RGS9BP | 7 (12%) | 49 |
0.849 (1.00) |
0.664 (1.00) |
0.936 (1.00) |
0.0312 (1.00) |
0.532 (1.00) |
0.679 (1.00) |
0.444 (1.00) |
| OPRD1 | 11 (20%) | 45 |
0.767 (1.00) |
0.265 (1.00) |
1 (1.00) |
1 (1.00) |
1 (1.00) |
0.299 (1.00) |
1 (1.00) |
| C16ORF3 | 5 (9%) | 51 |
0.329 (1.00) |
0.829 (1.00) |
0.569 (1.00) |
0.615 (1.00) |
0.465 (1.00) |
0.155 (1.00) |
1 (1.00) |
| FPGS | 5 (9%) | 51 |
0.786 (1.00) |
0.256 (1.00) |
0.567 (1.00) |
0.618 (1.00) |
0.465 (1.00) |
1 (1.00) |
0.551 (1.00) |
| PLIN5 | 5 (9%) | 51 |
0.39 (1.00) |
0.509 (1.00) |
0.92 (1.00) |
1 (1.00) |
0.465 (1.00) |
0.652 (1.00) |
0.444 (1.00) |
| IRX3 | 4 (7%) | 52 |
0.874 (1.00) |
0.166 (1.00) |
0.281 (1.00) |
0.457 (1.00) |
1 (1.00) |
1 (1.00) |
1 (1.00) |
| TRIOBP | 10 (18%) | 46 |
0.431 (1.00) |
0.856 (1.00) |
0.881 (1.00) |
1 (1.00) |
0.0732 (1.00) |
0.139 (1.00) |
0.639 (1.00) |
| KRTAP4-5 | 4 (7%) | 52 |
0.185 (1.00) |
0.787 (1.00) |
0.534 (1.00) |
0.261 (1.00) |
1 (1.00) |
1 (1.00) |
1 (1.00) |
| ATXN1 | 9 (16%) | 47 |
0.822 (1.00) |
0.299 (1.00) |
0.908 (1.00) |
0.507 (1.00) |
1 (1.00) |
0.146 (1.00) |
1 (1.00) |
| ZNF628 | 6 (11%) | 50 |
0.241 (1.00) |
0.404 (1.00) |
0.51 (1.00) |
0.391 (1.00) |
1 (1.00) |
1 (1.00) |
0.444 (1.00) |
| WDR34 | 5 (9%) | 51 |
0.497 (1.00) |
0.625 (1.00) |
1 (1.00) |
0.883 (1.00) |
1 (1.00) |
0.0406 (1.00) |
1 (1.00) |
| BTBD11 | 5 (9%) | 51 |
0.539 (1.00) |
0.635 (1.00) |
0.0108 (1.00) |
0.13 (1.00) |
0.465 (1.00) |
0.652 (1.00) |
1 (1.00) |
| GARS | 17 (30%) | 39 |
0.1 (1.00) |
0.196 (1.00) |
0.0174 (1.00) |
0.0161 (1.00) |
0.655 (1.00) |
0.763 (1.00) |
0.639 (1.00) |
| ZNF598 | 10 (18%) | 46 |
0.3 (1.00) |
0.0689 (1.00) |
0.55 (1.00) |
0.893 (1.00) |
0.574 (1.00) |
0.0223 (1.00) |
0.253 (1.00) |
| BHLHE22 | 5 (9%) | 51 |
0.259 (1.00) |
0.852 (1.00) |
0.655 (1.00) |
1 (1.00) |
0.0925 (1.00) |
0.652 (1.00) |
0.253 (1.00) |
| PTPLA | 3 (5%) | 53 |
0.7 (1.00) |
1 (1.00) |
0.533 (1.00) |
0.486 (1.00) |
1 (1.00) |
0.263 (1.00) |
0.444 (1.00) |
| CD320 | 4 (7%) | 52 |
0.951 (1.00) |
0.332 (1.00) |
0.225 (1.00) |
0.574 (1.00) |
1 (1.00) |
1 (1.00) |
0.145 (1.00) |
| KIAA1984 | 3 (5%) | 53 |
0.919 (1.00) |
0.308 (1.00) |
1 (1.00) |
0.263 (1.00) |
0.444 (1.00) |
||
| TPO | 10 (18%) | 46 |
0.416 (1.00) |
0.889 (1.00) |
0.794 (1.00) |
0.946 (1.00) |
0.0732 (1.00) |
0.72 (1.00) |
1 (1.00) |
| AATK | 5 (9%) | 51 |
0.502 (1.00) |
0.0771 (1.00) |
0.608 (1.00) |
0.682 (1.00) |
0.465 (1.00) |
0.652 (1.00) |
1 (1.00) |
| PANK2 | 4 (7%) | 52 |
0.00214 (1.00) |
0.408 (1.00) |
0.879 (1.00) |
0.576 (1.00) |
1 (1.00) |
0.108 (1.00) |
1 (1.00) |
| SNED1 | 6 (11%) | 50 |
0.716 (1.00) |
0.771 (1.00) |
0.208 (1.00) |
0.267 (1.00) |
0.131 (1.00) |
0.652 (1.00) |
0.551 (1.00) |
| CCDC150 | 4 (7%) | 52 |
0.135 (1.00) |
0.504 (1.00) |
0.0857 (1.00) |
0.179 (1.00) |
0.391 (1.00) |
1 (1.00) |
0.145 (1.00) |
| ERCC2 | 10 (18%) | 46 |
0.596 (1.00) |
0.949 (1.00) |
0.69 (1.00) |
0.492 (1.00) |
0.315 (1.00) |
1 (1.00) |
1 (1.00) |
| RREB1 | 4 (7%) | 52 |
0.354 (1.00) |
0.874 (1.00) |
0.73 (1.00) |
0.175 (1.00) |
0.0586 (1.00) |
0.598 (1.00) |
0.25 (1.00) |
| RNF39 | 5 (9%) | 51 |
0.842 (1.00) |
0.73 (1.00) |
0.73 (1.00) |
0.882 (1.00) |
0.391 (1.00) |
1 (1.00) |
0.444 (1.00) |
| SEMA5B | 6 (11%) | 50 |
0.915 (1.00) |
0.624 (1.00) |
0.575 (1.00) |
0.685 (1.00) |
0.532 (1.00) |
0.165 (1.00) |
1 (1.00) |
| TAF5 | 3 (5%) | 53 |
0.333 (1.00) |
0.927 (1.00) |
0.394 (1.00) |
0.808 (1.00) |
0.308 (1.00) |
0.544 (1.00) |
0.25 (1.00) |
| SARM1 | 6 (11%) | 50 |
0.101 (1.00) |
0.937 (1.00) |
0.242 (1.00) |
0.2 (1.00) |
1 (1.00) |
0.397 (1.00) |
0.145 (1.00) |
| PRSS27 | 3 (5%) | 53 |
0.134 (1.00) |
0.344 (1.00) |
0.617 (1.00) |
0.809 (1.00) |
1 (1.00) |
0.263 (1.00) |
0.0556 (1.00) |
| TMEM189 | 3 (5%) | 53 |
0.392 (1.00) |
1 (1.00) |
1 (1.00) |
0.444 (1.00) |
|||
| NOXA1 | 4 (7%) | 52 |
0.803 (1.00) |
0.714 (1.00) |
0.878 (1.00) |
0.884 (1.00) |
0.391 (1.00) |
0.288 (1.00) |
1 (1.00) |
| LRP11 | 4 (7%) | 52 |
0.154 (1.00) |
0.0747 (1.00) |
0.849 (1.00) |
1 (1.00) |
1 (1.00) |
0.598 (1.00) |
1 (1.00) |
| RNF149 | 3 (5%) | 53 |
0.226 (1.00) |
0.126 (1.00) |
0.279 (1.00) |
0.299 (1.00) |
1 (1.00) |
0.544 (1.00) |
1 (1.00) |
| DMKN | 3 (5%) | 53 |
0.163 (1.00) |
0.326 (1.00) |
1 (1.00) |
1 (1.00) |
1 (1.00) |
||
| FANK1 | 3 (5%) | 53 |
0.822 (1.00) |
0.353 (1.00) |
0.00829 (1.00) |
0.0514 (1.00) |
0.308 (1.00) |
0.544 (1.00) |
0.551 (1.00) |
| MUC5B | 19 (34%) | 37 |
0.991 (1.00) |
0.924 (1.00) |
0.862 (1.00) |
0.919 (1.00) |
0.651 (1.00) |
0.772 (1.00) |
0.674 (1.00) |
| GLTPD2 | 6 (11%) | 50 |
0.494 (1.00) |
0.0736 (1.00) |
0.769 (1.00) |
0.832 (1.00) |
1 (1.00) |
0.397 (1.00) |
0.25 (1.00) |
| MEN1 | 5 (9%) | 51 |
0.116 (1.00) |
0.615 (1.00) |
0.0859 (1.00) |
0.217 (1.00) |
0.391 (1.00) |
1 (1.00) |
1 (1.00) |
| SRPX | 3 (5%) | 53 |
0.792 (1.00) |
0.884 (1.00) |
1 (1.00) |
0.39 (1.00) |
0.308 (1.00) |
0.544 (1.00) |
1 (1.00) |
| MAP1S | 5 (9%) | 51 |
0.724 (1.00) |
0.35 (1.00) |
0.381 (1.00) |
0.684 (1.00) |
0.465 (1.00) |
0.324 (1.00) |
1 (1.00) |
| SCRT1 | 3 (5%) | 53 |
0.0355 (1.00) |
0.184 (1.00) |
1 (1.00) |
0.807 (1.00) |
0.308 (1.00) |
0.544 (1.00) |
1 (1.00) |
| OBSCN | 18 (32%) | 38 |
0.64 (1.00) |
0.118 (1.00) |
0.314 (1.00) |
0.893 (1.00) |
0.0756 (1.00) |
0.56 (1.00) |
1 (1.00) |
| IER5 | 3 (5%) | 53 |
0.501 (1.00) |
0.135 (1.00) |
0.0723 (1.00) |
0.308 (1.00) |
0.544 (1.00) |
1 (1.00) |
|
| TNIP2 | 5 (9%) | 51 |
0.134 (1.00) |
0.666 (1.00) |
0.2 (1.00) |
0.669 (1.00) |
0.0586 (1.00) |
1 (1.00) |
0.551 (1.00) |
| NOTCH2 | 5 (9%) | 51 |
0.937 (1.00) |
0.874 (1.00) |
0.881 (1.00) |
0.883 (1.00) |
0.391 (1.00) |
1 (1.00) |
1 (1.00) |
| RASIP1 | 7 (12%) | 49 |
0.0225 (1.00) |
1 (1.00) |
0.573 (1.00) |
0.321 (1.00) |
1 (1.00) |
0.403 (1.00) |
1 (1.00) |
| NMU | 4 (7%) | 52 |
0.134 (1.00) |
0.39 (1.00) |
1 (1.00) |
0.884 (1.00) |
0.391 (1.00) |
0.288 (1.00) |
0.444 (1.00) |
| VARS | 6 (11%) | 50 |
0.821 (1.00) |
0.926 (1.00) |
0.292 (1.00) |
0.365 (1.00) |
1 (1.00) |
0.165 (1.00) |
0.0376 (1.00) |
| HSD17B1 | 4 (7%) | 52 |
0.657 (1.00) |
0.524 (1.00) |
0.322 (1.00) |
0.458 (1.00) |
1 (1.00) |
1 (1.00) |
0.444 (1.00) |
| COQ2 | 4 (7%) | 52 |
0.628 (1.00) |
0.34 (1.00) |
0.417 (1.00) |
0.667 (1.00) |
1 (1.00) |
1 (1.00) |
|
| KNDC1 | 9 (16%) | 47 |
0.628 (1.00) |
0.982 (1.00) |
0.136 (1.00) |
0.196 (1.00) |
1 (1.00) |
0.146 (1.00) |
0.551 (1.00) |
| AR | 4 (7%) | 52 |
0.105 (1.00) |
0.714 (1.00) |
0.728 (1.00) |
0.215 (1.00) |
0.391 (1.00) |
1 (1.00) |
1 (1.00) |
| KCTD3 | 3 (5%) | 53 |
0.536 (1.00) |
1 (1.00) |
1 (1.00) |
1 (1.00) |
|||
| KRTAP5-5 | 3 (5%) | 53 |
0.00164 (1.00) |
0.402 (1.00) |
0.394 (1.00) |
0.809 (1.00) |
1 (1.00) |
1 (1.00) |
1 (1.00) |
| AKAP2 | 4 (7%) | 52 |
0.874 (1.00) |
0.545 (1.00) |
0.368 (1.00) |
0.882 (1.00) |
1 (1.00) |
0.108 (1.00) |
|
| KBTBD13 | 9 (16%) | 47 |
0.423 (1.00) |
0.569 (1.00) |
0.165 (1.00) |
0.132 (1.00) |
0.267 (1.00) |
0.146 (1.00) |
1 (1.00) |
| SPIRE2 | 3 (5%) | 53 |
0.871 (1.00) |
0.0806 (1.00) |
0.533 (1.00) |
0.223 (1.00) |
1 (1.00) |
0.544 (1.00) |
0.25 (1.00) |
| NPTX1 | 3 (5%) | 53 |
0.961 (1.00) |
0.827 (1.00) |
0.459 (1.00) |
0.486 (1.00) |
1 (1.00) |
0.263 (1.00) |
1 (1.00) |
| ADAD2 | 3 (5%) | 53 |
0.848 (1.00) |
0.942 (1.00) |
1 (1.00) |
0.263 (1.00) |
|||
| SEZ6L2 | 5 (9%) | 51 |
0.815 (1.00) |
0.537 (1.00) |
0.14 (1.00) |
0.249 (1.00) |
0.465 (1.00) |
0.652 (1.00) |
0.551 (1.00) |
| AMDHD1 | 10 (18%) | 46 |
0.935 (1.00) |
0.0239 (1.00) |
0.694 (1.00) |
0.946 (1.00) |
0.574 (1.00) |
0.281 (1.00) |
1 (1.00) |
| GLTSCR2 | 4 (7%) | 52 |
0.644 (1.00) |
0.209 (1.00) |
1 (1.00) |
1 (1.00) |
0.391 (1.00) |
0.108 (1.00) |
1 (1.00) |
| PLEC | 10 (18%) | 46 |
0.332 (1.00) |
0.386 (1.00) |
0.451 (1.00) |
0.585 (1.00) |
1 (1.00) |
0.139 (1.00) |
1 (1.00) |
| MAP7 | 3 (5%) | 53 |
0.91 (1.00) |
0.785 (1.00) |
0.851 (1.00) |
1 (1.00) |
1 (1.00) |
1 (1.00) |
1 (1.00) |
| DSPP | 9 (16%) | 47 |
0.793 (1.00) |
0.337 (1.00) |
0.952 (1.00) |
0.945 (1.00) |
0.267 (1.00) |
0.703 (1.00) |
0.639 (1.00) |
| CRIPAK | 8 (14%) | 48 |
0.905 (1.00) |
0.325 (1.00) |
0.101 (1.00) |
0.299 (1.00) |
0.574 (1.00) |
0.703 (1.00) |
1 (1.00) |
| PRKAR1A | 6 (11%) | 50 |
0.633 (1.00) |
0.926 (1.00) |
0.206 (1.00) |
0.153 (1.00) |
0.532 (1.00) |
0.0857 (1.00) |
0.444 (1.00) |
| CYP4A22 | 3 (5%) | 53 |
0.0575 (1.00) |
0.445 (1.00) |
0.392 (1.00) |
0.806 (1.00) |
1 (1.00) |
1 (1.00) |
0.444 (1.00) |
| NOM1 | 5 (9%) | 51 |
0.657 (1.00) |
0.829 (1.00) |
0.167 (1.00) |
0.222 (1.00) |
1 (1.00) |
1 (1.00) |
1 (1.00) |
| C12ORF65 | 3 (5%) | 53 |
0.000684 (0.58) |
0.251 (1.00) |
0.135 (1.00) |
0.0701 (1.00) |
0.308 (1.00) |
0.544 (1.00) |
1 (1.00) |
| HLA-B | 6 (11%) | 50 |
0.11 (1.00) |
0.947 (1.00) |
0.92 (1.00) |
1 (1.00) |
0.465 (1.00) |
0.165 (1.00) |
1 (1.00) |
| CSGALNACT2 | 3 (5%) | 53 |
0.746 (1.00) |
0.799 (1.00) |
0.726 (1.00) |
1 (1.00) |
1 (1.00) |
0.544 (1.00) |
1 (1.00) |
| UQCRFS1 | 5 (9%) | 51 |
0.296 (1.00) |
0.0541 (1.00) |
0.0979 (1.00) |
0.0473 (1.00) |
0.465 (1.00) |
1 (1.00) |
0.253 (1.00) |
| PDCD6 | 3 (5%) | 53 |
0.963 (1.00) |
0.101 (1.00) |
0.00862 (1.00) |
0.00676 (1.00) |
0.308 (1.00) |
1 (1.00) |
0.25 (1.00) |
| POLRMT | 4 (7%) | 52 |
0.156 (1.00) |
0.911 (1.00) |
0.252 (1.00) |
0.35 (1.00) |
1 (1.00) |
0.598 (1.00) |
|
| NF1 | 7 (12%) | 49 |
0.286 (1.00) |
0.629 (1.00) |
0.658 (1.00) |
0.801 (1.00) |
1 (1.00) |
0.00455 (1.00) |
1 (1.00) |
| ADAMTS7 | 4 (7%) | 52 |
0.168 (1.00) |
0.101 (1.00) |
0.254 (1.00) |
0.351 (1.00) |
1 (1.00) |
1 (1.00) |
1 (1.00) |
| CLIC6 | 4 (7%) | 52 |
0.43 (1.00) |
0.691 (1.00) |
0.421 (1.00) |
0.667 (1.00) |
1 (1.00) |
0.288 (1.00) |
1 (1.00) |
| EMR2 | 4 (7%) | 52 |
0.853 (1.00) |
0.0371 (1.00) |
0.723 (1.00) |
1 (1.00) |
1 (1.00) |
0.108 (1.00) |
1 (1.00) |
| PCDHB13 | 4 (7%) | 52 |
0.667 (1.00) |
0.0343 (1.00) |
0.199 (1.00) |
0.0959 (1.00) |
1 (1.00) |
0.598 (1.00) |
0.0556 (1.00) |
| HLA-A | 3 (5%) | 53 |
0.315 (1.00) |
0.244 (1.00) |
0.851 (1.00) |
0.392 (1.00) |
1 (1.00) |
0.263 (1.00) |
0.25 (1.00) |
| ASB16 | 4 (7%) | 52 |
0.612 (1.00) |
0.436 (1.00) |
1 (1.00) |
0.883 (1.00) |
1 (1.00) |
1 (1.00) |
|
| GPRIN2 | 7 (12%) | 49 |
0.988 (1.00) |
0.647 (1.00) |
0.795 (1.00) |
0.684 (1.00) |
0.582 (1.00) |
1 (1.00) |
1 (1.00) |
| HNRNPCL1 | 3 (5%) | 53 |
0.649 (1.00) |
1 (1.00) |
0.81 (1.00) |
1 (1.00) |
1 (1.00) |
1 (1.00) |
|
| BTNL9 | 3 (5%) | 53 |
0.755 (1.00) |
0.757 (1.00) |
1 (1.00) |
1 (1.00) |
1 (1.00) |
||
| KCNJ11 | 4 (7%) | 52 |
0.496 (1.00) |
0.474 (1.00) |
0.0851 (1.00) |
0.882 (1.00) |
0.0586 (1.00) |
0.598 (1.00) |
1 (1.00) |
| LRRC4B | 6 (11%) | 50 |
0.263 (1.00) |
0.701 (1.00) |
0.39 (1.00) |
1 (1.00) |
0.131 (1.00) |
0.652 (1.00) |
0.545 (1.00) |
| OPLAH | 3 (5%) | 53 |
0.174 (1.00) |
0.308 (1.00) |
0.178 (1.00) |
0.148 (1.00) |
1 (1.00) |
1 (1.00) |
1 (1.00) |
| MADCAM1 | 3 (5%) | 53 |
0.514 (1.00) |
0.434 (1.00) |
0.179 (1.00) |
0.145 (1.00) |
0.308 (1.00) |
0.544 (1.00) |
0.444 (1.00) |
| MSH3 | 3 (5%) | 53 |
0.0412 (1.00) |
0.623 (1.00) |
0.0729 (1.00) |
0.148 (1.00) |
1 (1.00) |
0.544 (1.00) |
1 (1.00) |
| UTS2R | 3 (5%) | 53 |
0.453 (1.00) |
0.326 (1.00) |
0.337 (1.00) |
0.584 (1.00) |
1 (1.00) |
1 (1.00) |
1 (1.00) |
| SMG1 | 3 (5%) | 53 |
0.767 (1.00) |
0.771 (1.00) |
0.136 (1.00) |
0.807 (1.00) |
0.308 (1.00) |
1 (1.00) |
0.551 (1.00) |
| FEZ2 | 3 (5%) | 53 |
0.722 (1.00) |
0.445 (1.00) |
0.722 (1.00) |
0.582 (1.00) |
0.308 (1.00) |
1 (1.00) |
0.551 (1.00) |
| GLI3 | 5 (9%) | 51 |
0.288 (1.00) |
0.92 (1.00) |
0.0416 (1.00) |
0.0233 (1.00) |
1 (1.00) |
0.652 (1.00) |
1 (1.00) |
| NOL9 | 3 (5%) | 53 |
0.878 (1.00) |
0.0608 (1.00) |
1 (1.00) |
0.263 (1.00) |
P value = 0.000236 (logrank test), Q value = 0.2
Table S1. Gene #89: 'NEFH MUTATION STATUS' versus Clinical Feature #1: 'Time to Death'
| nPatients | nDeath | Duration Range (Median), Month | |
|---|---|---|---|
| ALL | 55 | 20 | 4.1 - 153.6 (36.3) |
| NEFH MUTATED | 5 | 4 | 4.9 - 32.7 (15.4) |
| NEFH WILD-TYPE | 50 | 16 | 4.1 - 153.6 (40.0) |
Figure S1. Get High-res Image Gene #89: 'NEFH MUTATION STATUS' versus Clinical Feature #1: 'Time to Death'
P value = 0.000239 (logrank test), Q value = 0.2
Table S2. Gene #104: 'PTX4 MUTATION STATUS' versus Clinical Feature #1: 'Time to Death'
| nPatients | nDeath | Duration Range (Median), Month | |
|---|---|---|---|
| ALL | 55 | 20 | 4.1 - 153.6 (36.3) |
| PTX4 MUTATED | 3 | 3 | 5.2 - 30.3 (18.1) |
| PTX4 WILD-TYPE | 52 | 17 | 4.1 - 153.6 (39.5) |
Figure S2. Get High-res Image Gene #104: 'PTX4 MUTATION STATUS' versus Clinical Feature #1: 'Time to Death'

-
Mutation data file = transformed.cor.cli.txt
-
Clinical data file = ACC-TP.merged_data.txt
-
Number of patients = 56
-
Number of significantly mutated genes = 125
-
Number of selected clinical features = 7
-
Exclude genes that fewer than K tumors have mutations, K = 3
For survival clinical features, the Kaplan-Meier survival curves of tumors with and without gene mutations were plotted and the statistical significance P values were estimated by logrank test (Bland and Altman 2004) using the 'survdiff' function in R
For binary or multi-class clinical features (nominal or ordinal), two-tailed Fisher's exact tests (Fisher 1922) were used to estimate the P values using the 'fisher.test' function in R
For multiple hypothesis correction, Q value is the False Discovery Rate (FDR) analogue of the P value (Benjamini and Hochberg 1995), defined as the minimum FDR at which the test may be called significant. We used the 'Benjamini and Hochberg' method of 'p.adjust' function in R to convert P values into Q values.
In addition to the links below, the full results of the analysis summarized in this report can also be downloaded programmatically using firehose_get, or interactively from either the Broad GDAC website or TCGA Data Coordination Center Portal.