This pipeline computes the correlation between significant arm-level copy number variations (cnvs) and selected clinical features.
Testing the association between copy number variation 79 arm-level events and 11 clinical features across 505 patients, 21 significant findings detected with Q value < 0.25.
-
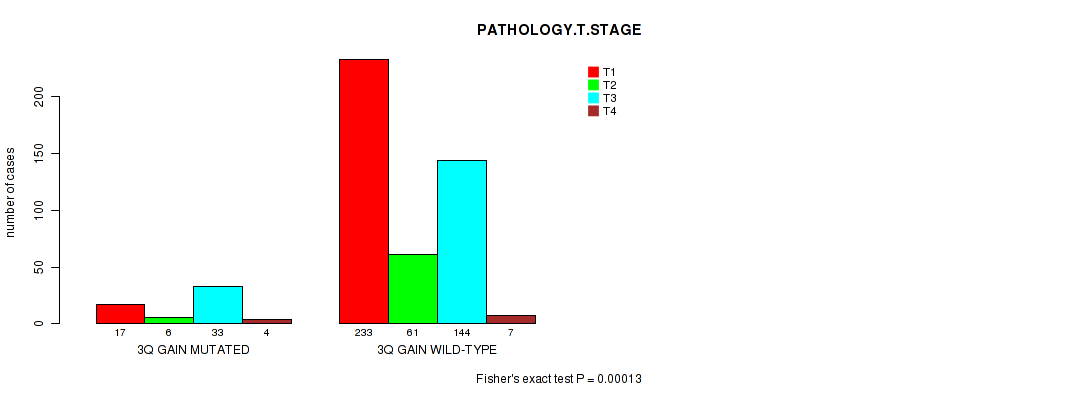
3q gain cnv correlated to 'PATHOLOGY.T.STAGE'.
-
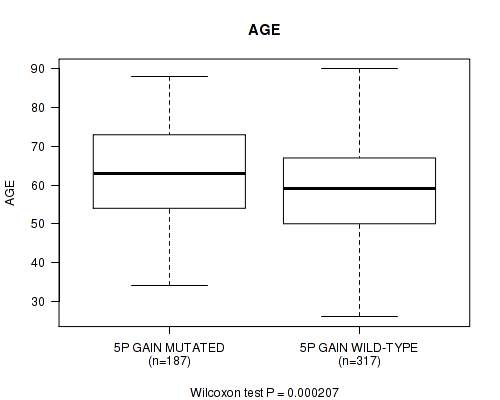
5p gain cnv correlated to 'AGE'.
-
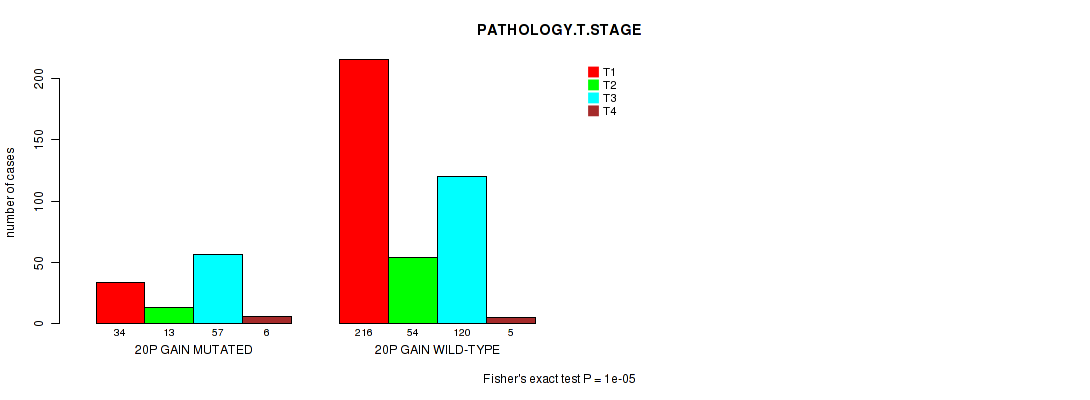
20p gain cnv correlated to 'NEOPLASM.DISEASESTAGE' and 'PATHOLOGY.T.STAGE'.
-
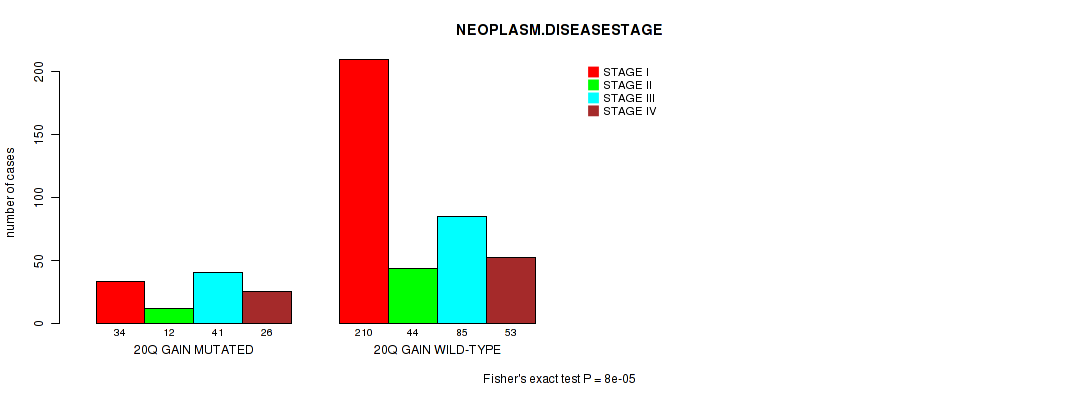
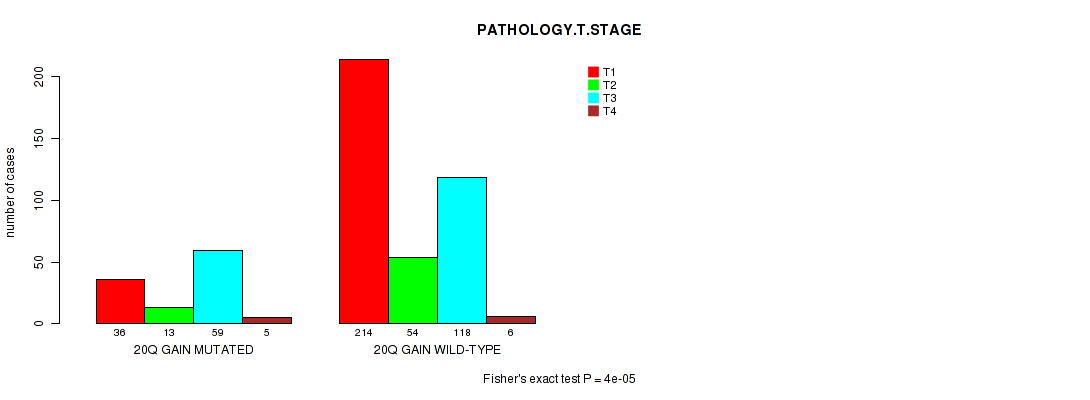
20q gain cnv correlated to 'NEOPLASM.DISEASESTAGE' and 'PATHOLOGY.T.STAGE'.
-
4p loss cnv correlated to 'NEOPLASM.DISEASESTAGE' and 'PATHOLOGY.T.STAGE'.
-
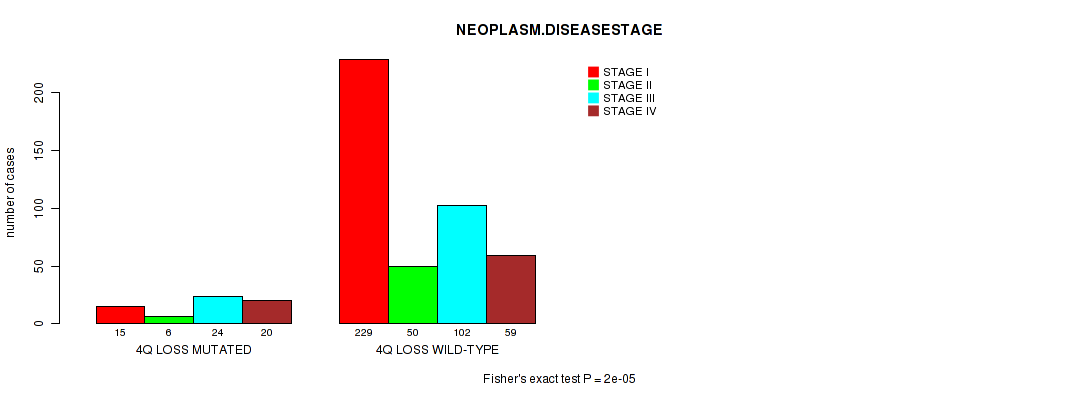
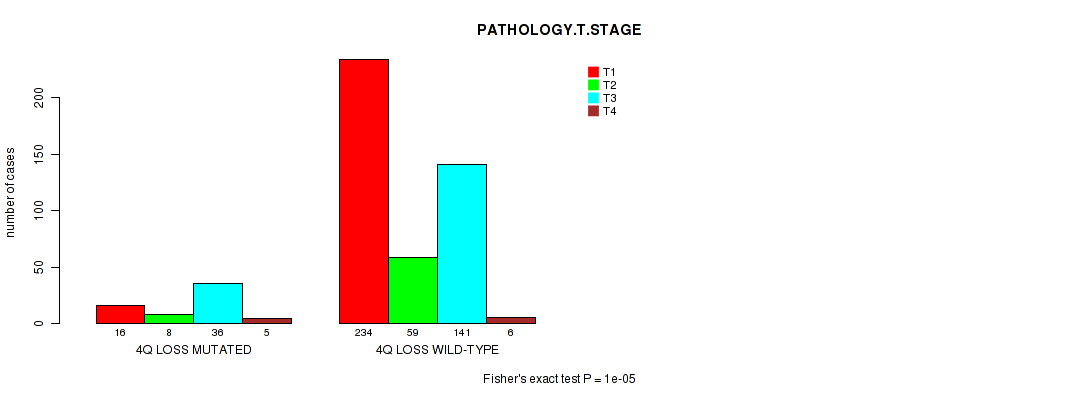
4q loss cnv correlated to 'NEOPLASM.DISEASESTAGE' and 'PATHOLOGY.T.STAGE'.
-
5p loss cnv correlated to 'PATHOLOGY.T.STAGE'.
-
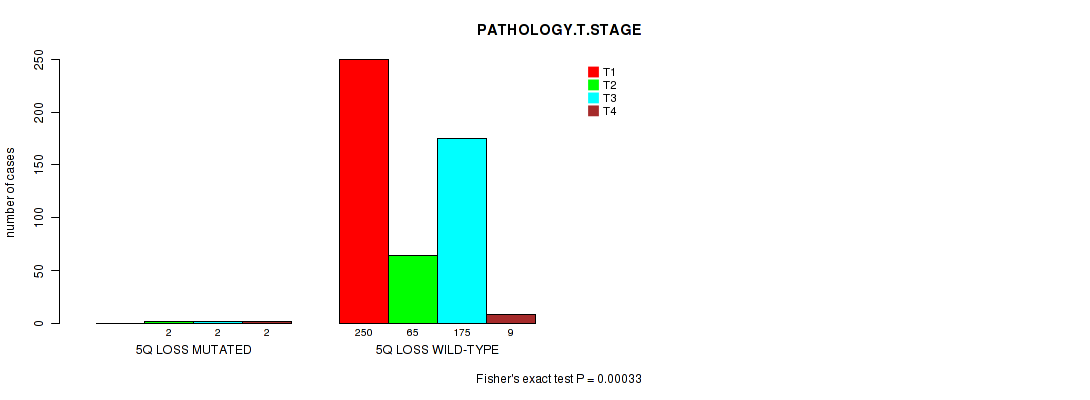
5q loss cnv correlated to 'PATHOLOGY.T.STAGE'.
-
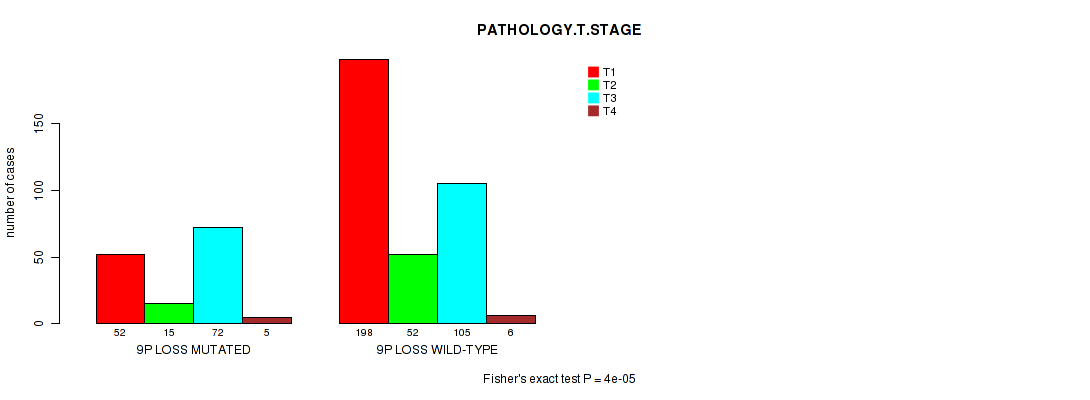
9p loss cnv correlated to 'NEOPLASM.DISEASESTAGE' and 'PATHOLOGY.T.STAGE'.
-
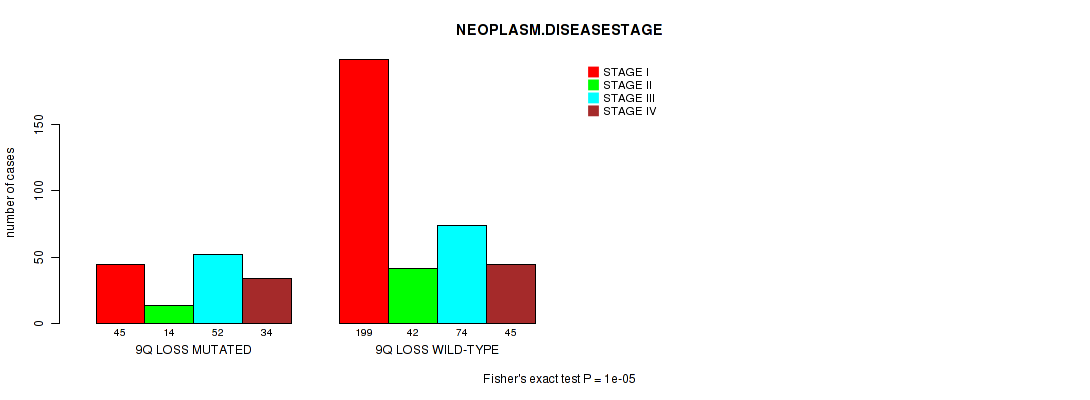
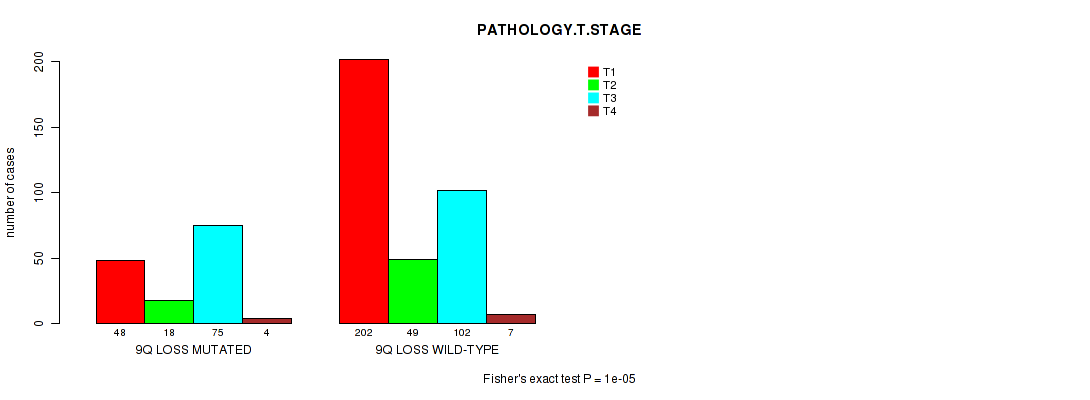
9q loss cnv correlated to 'NEOPLASM.DISEASESTAGE' and 'PATHOLOGY.T.STAGE'.
-
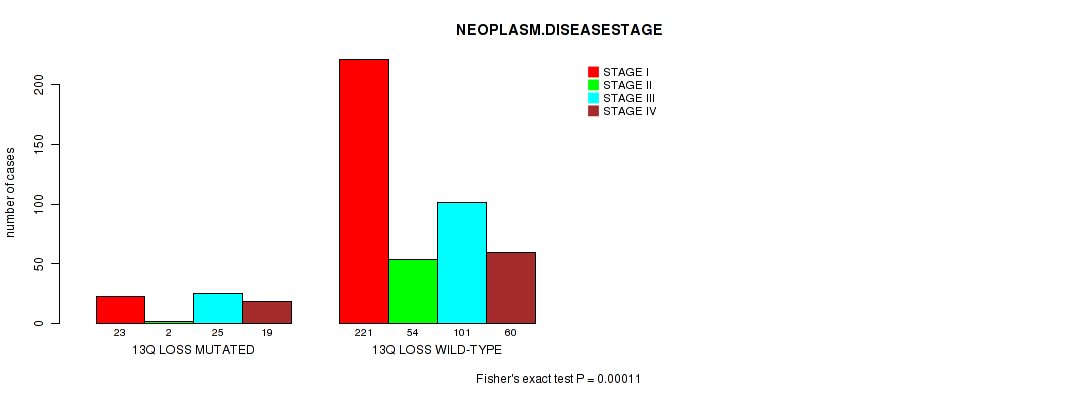
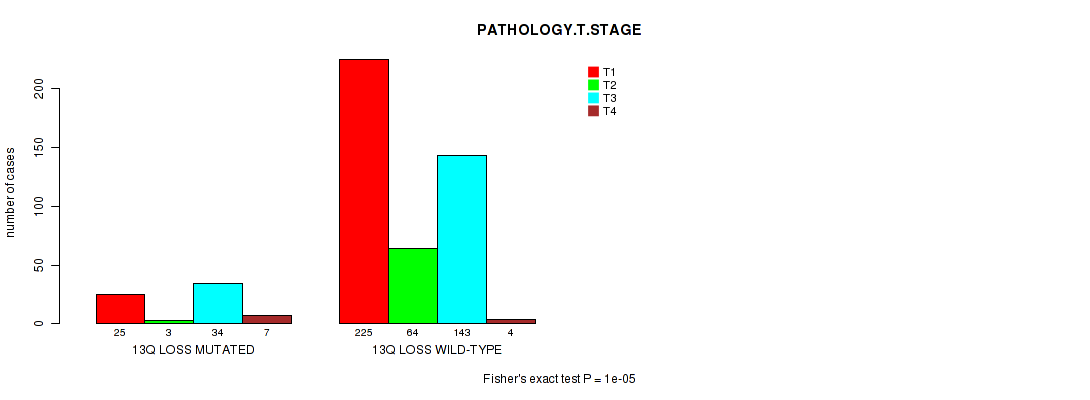
13q loss cnv correlated to 'NEOPLASM.DISEASESTAGE' and 'PATHOLOGY.T.STAGE'.
-
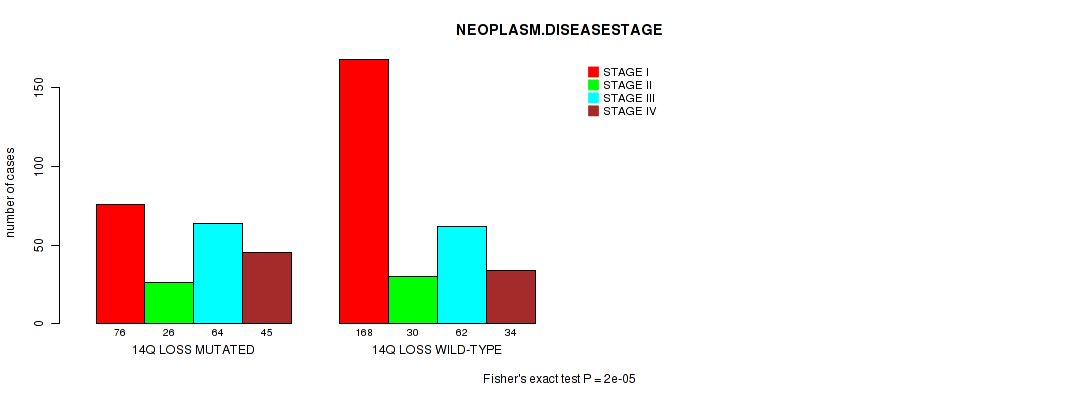
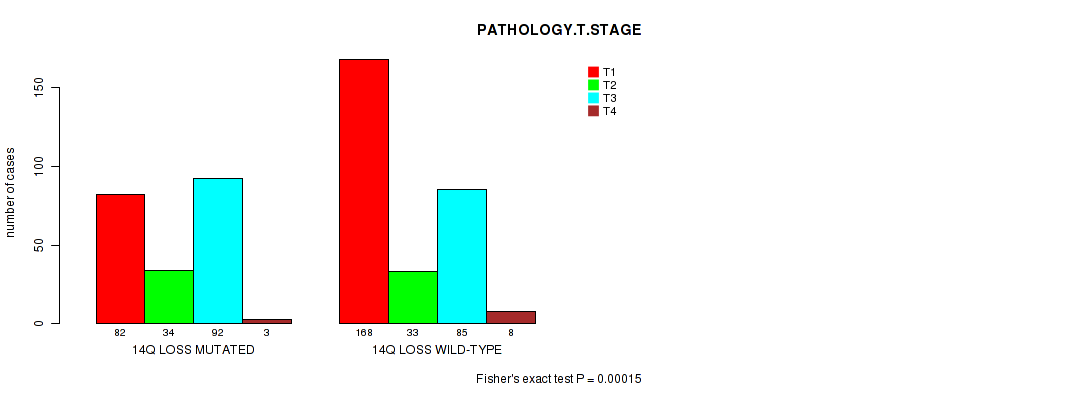
14q loss cnv correlated to 'NEOPLASM.DISEASESTAGE' and 'PATHOLOGY.T.STAGE'.
-
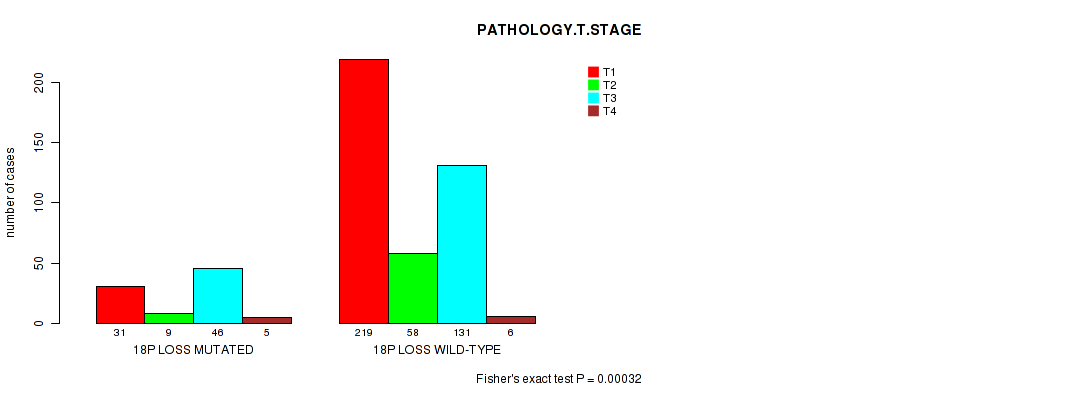
18p loss cnv correlated to 'PATHOLOGY.T.STAGE'.
Table 1. Get Full Table Overview of the association between significant copy number variation of 79 arm-level events and 11 clinical features. Shown in the table are P values (Q values). Thresholded by Q value < 0.25, 21 significant findings detected.
|
Clinical Features |
Time to Death |
AGE |
NEOPLASM DISEASESTAGE |
PATHOLOGY T STAGE |
PATHOLOGY N STAGE |
PATHOLOGY M STAGE |
GENDER |
KARNOFSKY PERFORMANCE SCORE |
NUMBERPACKYEARSSMOKED | RACE | ETHNICITY | ||
| nCNV (%) | nWild-Type | logrank test | Wilcoxon-test | Fisher's exact test | Fisher's exact test | Fisher's exact test | Fisher's exact test | Fisher's exact test | Wilcoxon-test | Wilcoxon-test | Fisher's exact test | Fisher's exact test | |
| 20p gain | 110 (22%) | 395 |
0.192 (1.00) |
0.259 (1.00) |
0.0001 (0.0751) |
1e-05 (0.00762) |
0.546 (1.00) |
0.0248 (1.00) |
0.000712 (0.521) |
0.878 (1.00) |
0.747 (1.00) |
0.435 (1.00) |
|
| 20q gain | 113 (22%) | 392 |
0.0904 (1.00) |
0.0889 (1.00) |
8e-05 (0.0602) |
4e-05 (0.0302) |
0.237 (1.00) |
0.0339 (1.00) |
0.00504 (1.00) |
0.878 (1.00) |
0.798 (1.00) |
0.436 (1.00) |
|
| 4p loss | 71 (14%) | 434 |
0.265 (1.00) |
0.9 (1.00) |
0.00026 (0.193) |
0.00023 (0.171) |
0.726 (1.00) |
0.0366 (1.00) |
0.894 (1.00) |
0.327 (1.00) |
0.142 (1.00) |
0.38 (1.00) |
|
| 4q loss | 65 (13%) | 440 |
0.517 (1.00) |
0.828 (1.00) |
2e-05 (0.0151) |
1e-05 (0.00762) |
0.464 (1.00) |
0.00716 (1.00) |
0.331 (1.00) |
0.542 (1.00) |
0.178 (1.00) |
0.541 (1.00) |
|
| 9p loss | 144 (29%) | 361 |
0.133 (1.00) |
0.058 (1.00) |
1e-05 (0.00762) |
4e-05 (0.0302) |
0.0997 (1.00) |
0.00071 (0.52) |
0.00063 (0.464) |
0.824 (1.00) |
0.145 (1.00) |
0.817 (1.00) |
|
| 9q loss | 145 (29%) | 360 |
0.388 (1.00) |
0.0409 (1.00) |
1e-05 (0.00762) |
1e-05 (0.00762) |
0.171 (1.00) |
0.00163 (1.00) |
0.000443 (0.328) |
0.539 (1.00) |
0.148 (1.00) |
0.643 (1.00) |
|
| 13q loss | 69 (14%) | 436 |
0.00206 (1.00) |
0.783 (1.00) |
0.00011 (0.0825) |
1e-05 (0.00762) |
0.321 (1.00) |
0.0632 (1.00) |
0.279 (1.00) |
0.752 (1.00) |
0.279 (1.00) |
0.224 (1.00) |
|
| 14q loss | 211 (42%) | 294 |
0.0366 (1.00) |
0.184 (1.00) |
2e-05 (0.0151) |
0.00015 (0.112) |
0.0024 (1.00) |
0.00306 (1.00) |
0.0376 (1.00) |
0.126 (1.00) |
0.465 (1.00) |
0.145 (1.00) |
0.529 (1.00) |
| 3q gain | 60 (12%) | 445 |
0.539 (1.00) |
0.919 (1.00) |
0.00126 (0.917) |
0.00013 (0.0974) |
0.00868 (1.00) |
0.0136 (1.00) |
0.776 (1.00) |
0.542 (1.00) |
0.754 (1.00) |
1 (1.00) |
|
| 5p gain | 187 (37%) | 318 |
0.144 (1.00) |
0.000207 (0.154) |
0.138 (1.00) |
0.233 (1.00) |
0.622 (1.00) |
1 (1.00) |
0.0264 (1.00) |
0.629 (1.00) |
0.0561 (1.00) |
1 (1.00) |
|
| 5p loss | 7 (1%) | 498 |
0.143 (1.00) |
0.253 (1.00) |
0.0019 (1.00) |
0.00014 (0.105) |
1 (1.00) |
0.191 (1.00) |
0.249 (1.00) |
1 (1.00) |
1 (1.00) |
||
| 5q loss | 6 (1%) | 499 |
0.143 (1.00) |
0.151 (1.00) |
0.00567 (1.00) |
0.00033 (0.245) |
1 (1.00) |
0.323 (1.00) |
0.43 (1.00) |
1 (1.00) |
1 (1.00) |
||
| 18p loss | 91 (18%) | 414 |
0.0624 (1.00) |
0.112 (1.00) |
0.00034 (0.252) |
0.00032 (0.238) |
1 (1.00) |
0.0711 (1.00) |
0.148 (1.00) |
0.771 (1.00) |
0.585 (1.00) |
0.0946 (1.00) |
|
| 1p gain | 23 (5%) | 482 |
0.205 (1.00) |
0.212 (1.00) |
0.294 (1.00) |
0.361 (1.00) |
0.213 (1.00) |
0.598 (1.00) |
1 (1.00) |
0.45 (1.00) |
0.45 (1.00) |
1 (1.00) |
|
| 1q gain | 50 (10%) | 455 |
0.678 (1.00) |
0.0375 (1.00) |
0.126 (1.00) |
0.164 (1.00) |
0.426 (1.00) |
0.75 (1.00) |
0.644 (1.00) |
0.7 (1.00) |
0.898 (1.00) |
0.719 (1.00) |
|
| 2p gain | 75 (15%) | 430 |
0.263 (1.00) |
0.152 (1.00) |
0.159 (1.00) |
0.597 (1.00) |
0.744 (1.00) |
0.345 (1.00) |
0.896 (1.00) |
0.252 (1.00) |
0.788 (1.00) |
0.541 (1.00) |
|
| 2q gain | 77 (15%) | 428 |
0.583 (1.00) |
0.245 (1.00) |
0.359 (1.00) |
0.736 (1.00) |
1 (1.00) |
0.446 (1.00) |
0.364 (1.00) |
0.588 (1.00) |
0.739 (1.00) |
0.353 (1.00) |
|
| 3p gain | 19 (4%) | 486 |
0.169 (1.00) |
0.518 (1.00) |
0.169 (1.00) |
0.222 (1.00) |
0.0468 (1.00) |
0.156 (1.00) |
0.328 (1.00) |
0.976 (1.00) |
1 (1.00) |
1 (1.00) |
|
| 4p gain | 13 (3%) | 492 |
0.0161 (1.00) |
0.776 (1.00) |
0.467 (1.00) |
0.2 (1.00) |
0.498 (1.00) |
1 (1.00) |
0.558 (1.00) |
0.677 (1.00) |
1 (1.00) |
||
| 4q gain | 13 (3%) | 492 |
0.0196 (1.00) |
0.776 (1.00) |
0.573 (1.00) |
0.719 (1.00) |
0.458 (1.00) |
0.767 (1.00) |
1 (1.00) |
0.679 (1.00) |
1 (1.00) |
||
| 5q gain | 200 (40%) | 305 |
0.0858 (1.00) |
0.000568 (0.419) |
0.392 (1.00) |
0.401 (1.00) |
1 (1.00) |
1 (1.00) |
0.029 (1.00) |
0.629 (1.00) |
0.0257 (1.00) |
0.833 (1.00) |
|
| 6p gain | 11 (2%) | 494 |
0.477 (1.00) |
0.795 (1.00) |
0.373 (1.00) |
0.257 (1.00) |
1 (1.00) |
0.745 (1.00) |
0.343 (1.00) |
0.613 (1.00) |
1 (1.00) |
||
| 6q gain | 9 (2%) | 496 |
0.344 (1.00) |
0.362 (1.00) |
0.255 (1.00) |
0.295 (1.00) |
1 (1.00) |
1 (1.00) |
0.17 (1.00) |
0.54 (1.00) |
1 (1.00) |
||
| 7p gain | 167 (33%) | 338 |
0.965 (1.00) |
0.393 (1.00) |
0.0804 (1.00) |
0.136 (1.00) |
0.448 (1.00) |
0.05 (1.00) |
0.00401 (1.00) |
0.546 (1.00) |
0.102 (1.00) |
0.365 (1.00) |
|
| 7q gain | 168 (33%) | 337 |
0.361 (1.00) |
0.439 (1.00) |
0.0168 (1.00) |
0.0627 (1.00) |
0.442 (1.00) |
0.00617 (1.00) |
0.0101 (1.00) |
0.258 (1.00) |
0.0988 (1.00) |
0.169 (1.00) |
|
| 8p gain | 29 (6%) | 476 |
0.0445 (1.00) |
0.199 (1.00) |
0.00547 (1.00) |
0.00329 (1.00) |
1 (1.00) |
0.338 (1.00) |
0.693 (1.00) |
0.441 (1.00) |
0.524 (1.00) |
0.622 (1.00) |
|
| 8q gain | 60 (12%) | 445 |
0.067 (1.00) |
0.051 (1.00) |
0.0169 (1.00) |
0.0207 (1.00) |
0.451 (1.00) |
0.191 (1.00) |
0.152 (1.00) |
0.828 (1.00) |
0.915 (1.00) |
0.491 (1.00) |
|
| 9p gain | 13 (3%) | 492 |
0.325 (1.00) |
0.676 (1.00) |
0.948 (1.00) |
0.0516 (1.00) |
1 (1.00) |
0.397 (1.00) |
0.0155 (1.00) |
0.365 (1.00) |
0.543 (1.00) |
||
| 9q gain | 12 (2%) | 493 |
0.803 (1.00) |
0.339 (1.00) |
0.236 (1.00) |
0.00288 (1.00) |
1 (1.00) |
1 (1.00) |
0.124 (1.00) |
0.648 (1.00) |
0.543 (1.00) |
||
| 10p gain | 17 (3%) | 488 |
0.218 (1.00) |
0.0957 (1.00) |
0.36 (1.00) |
0.108 (1.00) |
0.107 (1.00) |
0.81 (1.00) |
0.797 (1.00) |
0.222 (1.00) |
0.711 (1.00) |
1 (1.00) |
|
| 10q gain | 12 (2%) | 493 |
0.0708 (1.00) |
0.0153 (1.00) |
0.827 (1.00) |
0.884 (1.00) |
0.262 (1.00) |
1 (1.00) |
0.36 (1.00) |
0.587 (1.00) |
1 (1.00) |
1 (1.00) |
|
| 11p gain | 31 (6%) | 474 |
0.285 (1.00) |
0.992 (1.00) |
0.0449 (1.00) |
0.0196 (1.00) |
1 (1.00) |
0.143 (1.00) |
0.847 (1.00) |
1 (1.00) |
1 (1.00) |
1 (1.00) |
|
| 11q gain | 29 (6%) | 476 |
0.796 (1.00) |
0.941 (1.00) |
0.23 (1.00) |
0.113 (1.00) |
1 (1.00) |
0.29 (1.00) |
1 (1.00) |
1 (1.00) |
1 (1.00) |
||
| 12p gain | 119 (24%) | 386 |
0.0924 (1.00) |
0.139 (1.00) |
0.00098 (0.716) |
0.00318 (1.00) |
0.0892 (1.00) |
0.0405 (1.00) |
0.583 (1.00) |
0.0163 (1.00) |
0.514 (1.00) |
0.223 (1.00) |
|
| 12q gain | 120 (24%) | 385 |
0.105 (1.00) |
0.265 (1.00) |
0.00063 (0.464) |
0.00233 (1.00) |
0.0892 (1.00) |
0.044 (1.00) |
0.512 (1.00) |
0.0163 (1.00) |
0.515 (1.00) |
0.221 (1.00) |
|
| 13q gain | 22 (4%) | 483 |
0.146 (1.00) |
0.254 (1.00) |
0.172 (1.00) |
0.257 (1.00) |
1 (1.00) |
0.579 (1.00) |
0.258 (1.00) |
0.182 (1.00) |
0.0855 (1.00) |
||
| 14q gain | 16 (3%) | 489 |
0.662 (1.00) |
0.476 (1.00) |
0.265 (1.00) |
0.00779 (1.00) |
1 (1.00) |
0.476 (1.00) |
0.798 (1.00) |
1 (1.00) |
1 (1.00) |
||
| 15q gain | 26 (5%) | 479 |
0.609 (1.00) |
0.451 (1.00) |
0.636 (1.00) |
0.455 (1.00) |
0.213 (1.00) |
0.742 (1.00) |
0.68 (1.00) |
0.0275 (1.00) |
1 (1.00) |
1 (1.00) |
|
| 16p gain | 104 (21%) | 401 |
0.852 (1.00) |
0.219 (1.00) |
0.201 (1.00) |
0.108 (1.00) |
0.133 (1.00) |
0.726 (1.00) |
0.731 (1.00) |
0.708 (1.00) |
0.486 (1.00) |
1 (1.00) |
|
| 16q gain | 96 (19%) | 409 |
0.863 (1.00) |
0.304 (1.00) |
0.217 (1.00) |
0.071 (1.00) |
0.211 (1.00) |
1 (1.00) |
1 (1.00) |
0.86 (1.00) |
0.632 (1.00) |
1 (1.00) |
|
| 17p gain | 25 (5%) | 480 |
0.464 (1.00) |
0.398 (1.00) |
0.0827 (1.00) |
0.823 (1.00) |
0.213 (1.00) |
0.0471 (1.00) |
0.832 (1.00) |
0.139 (1.00) |
0.0229 (1.00) |
0.611 (1.00) |
|
| 17q gain | 31 (6%) | 474 |
0.599 (1.00) |
0.366 (1.00) |
0.529 (1.00) |
0.729 (1.00) |
0.298 (1.00) |
0.315 (1.00) |
1 (1.00) |
0.828 (1.00) |
0.0624 (1.00) |
0.617 (1.00) |
|
| 18p gain | 25 (5%) | 480 |
0.214 (1.00) |
0.806 (1.00) |
0.695 (1.00) |
0.874 (1.00) |
1 (1.00) |
0.623 (1.00) |
0.0862 (1.00) |
1 (1.00) |
0.323 (1.00) |
||
| 18q gain | 25 (5%) | 480 |
0.227 (1.00) |
0.62 (1.00) |
0.541 (1.00) |
0.775 (1.00) |
0.604 (1.00) |
0.62 (1.00) |
0.0862 (1.00) |
1 (1.00) |
0.323 (1.00) |
||
| 19p gain | 51 (10%) | 454 |
0.359 (1.00) |
0.677 (1.00) |
0.00895 (1.00) |
0.0214 (1.00) |
0.404 (1.00) |
0.0212 (1.00) |
0.279 (1.00) |
0.312 (1.00) |
0.379 (1.00) |
0.723 (1.00) |
|
| 19q gain | 57 (11%) | 448 |
0.437 (1.00) |
0.393 (1.00) |
0.00237 (1.00) |
0.00847 (1.00) |
0.438 (1.00) |
0.00768 (1.00) |
0.243 (1.00) |
0.312 (1.00) |
0.245 (1.00) |
0.749 (1.00) |
|
| 21q gain | 49 (10%) | 456 |
0.333 (1.00) |
0.0951 (1.00) |
0.253 (1.00) |
0.124 (1.00) |
1 (1.00) |
0.583 (1.00) |
0.532 (1.00) |
0.84 (1.00) |
0.418 (1.00) |
0.479 (1.00) |
|
| 22q gain | 40 (8%) | 465 |
0.391 (1.00) |
0.563 (1.00) |
0.817 (1.00) |
0.11 (1.00) |
1 (1.00) |
0.914 (1.00) |
0.307 (1.00) |
0.291 (1.00) |
0.653 (1.00) |
1 (1.00) |
|
| xq gain | 29 (6%) | 476 |
0.327 (1.00) |
0.84 (1.00) |
0.0792 (1.00) |
0.138 (1.00) |
1 (1.00) |
0.0367 (1.00) |
0.842 (1.00) |
0.976 (1.00) |
0.443 (1.00) |
0.617 (1.00) |
|
| 1p loss | 55 (11%) | 450 |
0.0329 (1.00) |
0.0926 (1.00) |
0.543 (1.00) |
0.0155 (1.00) |
0.702 (1.00) |
0.501 (1.00) |
0.232 (1.00) |
0.84 (1.00) |
0.228 (1.00) |
0.184 (1.00) |
|
| 1q loss | 36 (7%) | 469 |
0.308 (1.00) |
0.656 (1.00) |
0.795 (1.00) |
0.0785 (1.00) |
1 (1.00) |
0.373 (1.00) |
0.592 (1.00) |
1 (1.00) |
0.602 (1.00) |
0.443 (1.00) |
|
| 2p loss | 14 (3%) | 491 |
0.0125 (1.00) |
0.836 (1.00) |
0.434 (1.00) |
0.126 (1.00) |
1 (1.00) |
0.773 (1.00) |
0.779 (1.00) |
0.0362 (1.00) |
1 (1.00) |
||
| 2q loss | 14 (3%) | 491 |
0.142 (1.00) |
0.812 (1.00) |
0.561 (1.00) |
0.223 (1.00) |
1 (1.00) |
0.774 (1.00) |
0.779 (1.00) |
0.0666 (1.00) |
1 (1.00) |
||
| 3p loss | 364 (72%) | 141 |
0.735 (1.00) |
0.859 (1.00) |
0.0251 (1.00) |
0.038 (1.00) |
0.791 (1.00) |
0.242 (1.00) |
0.0223 (1.00) |
0.248 (1.00) |
0.121 (1.00) |
0.486 (1.00) |
|
| 3q loss | 96 (19%) | 409 |
0.0634 (1.00) |
0.0169 (1.00) |
0.647 (1.00) |
0.282 (1.00) |
0.747 (1.00) |
0.886 (1.00) |
0.000347 (0.257) |
0.421 (1.00) |
0.879 (1.00) |
0.571 (1.00) |
|
| 6p loss | 98 (19%) | 407 |
0.126 (1.00) |
0.271 (1.00) |
0.0598 (1.00) |
0.0357 (1.00) |
0.00494 (1.00) |
0.196 (1.00) |
0.0014 (1.00) |
0.0689 (1.00) |
0.107 (1.00) |
0.791 (1.00) |
|
| 6q loss | 125 (25%) | 380 |
0.738 (1.00) |
0.754 (1.00) |
0.339 (1.00) |
0.237 (1.00) |
0.00118 (0.858) |
0.9 (1.00) |
0.0527 (1.00) |
0.626 (1.00) |
0.0347 (1.00) |
0.219 (1.00) |
0.627 (1.00) |
| 7q loss | 3 (1%) | 502 |
0.597 (1.00) |
0.127 (1.00) |
0.011 (1.00) |
0.0726 (1.00) |
1 (1.00) |
0.555 (1.00) |
1 (1.00) |
0.131 (1.00) |
|||
| 8p loss | 134 (27%) | 371 |
0.542 (1.00) |
0.683 (1.00) |
0.354 (1.00) |
0.292 (1.00) |
0.776 (1.00) |
0.33 (1.00) |
0.0577 (1.00) |
0.449 (1.00) |
0.291 (1.00) |
0.41 (1.00) |
0.0267 (1.00) |
| 8q loss | 62 (12%) | 443 |
0.847 (1.00) |
0.805 (1.00) |
0.534 (1.00) |
0.356 (1.00) |
0.438 (1.00) |
0.742 (1.00) |
0.0325 (1.00) |
0.449 (1.00) |
0.213 (1.00) |
0.0363 (1.00) |
|
| 10p loss | 65 (13%) | 440 |
0.537 (1.00) |
0.477 (1.00) |
0.0701 (1.00) |
0.00825 (1.00) |
0.14 (1.00) |
0.564 (1.00) |
0.331 (1.00) |
0.0521 (1.00) |
0.693 (1.00) |
0.184 (1.00) |
|
| 10q loss | 87 (17%) | 418 |
0.637 (1.00) |
0.668 (1.00) |
0.109 (1.00) |
0.00253 (1.00) |
0.322 (1.00) |
0.436 (1.00) |
0.11 (1.00) |
0.282 (1.00) |
0.457 (1.00) |
0.253 (1.00) |
|
| 11p loss | 18 (4%) | 487 |
0.0705 (1.00) |
0.0546 (1.00) |
0.452 (1.00) |
0.442 (1.00) |
0.158 (1.00) |
0.646 (1.00) |
1 (1.00) |
0.587 (1.00) |
1 (1.00) |
1 (1.00) |
|
| 11q loss | 23 (5%) | 482 |
0.0164 (1.00) |
0.00599 (1.00) |
0.678 (1.00) |
0.602 (1.00) |
0.241 (1.00) |
0.6 (1.00) |
0.383 (1.00) |
0.222 (1.00) |
1 (1.00) |
1 (1.00) |
|
| 12p loss | 3 (1%) | 502 |
0.66 (1.00) |
0.813 (1.00) |
0.489 (1.00) |
0.742 (1.00) |
1 (1.00) |
1 (1.00) |
1 (1.00) |
1 (1.00) |
1 (1.00) |
||
| 12q loss | 4 (1%) | 501 |
0.66 (1.00) |
0.315 (1.00) |
0.174 (1.00) |
0.415 (1.00) |
1 (1.00) |
1 (1.00) |
1 (1.00) |
1 (1.00) |
1 (1.00) |
||
| 15q loss | 35 (7%) | 470 |
0.407 (1.00) |
0.991 (1.00) |
0.00099 (0.723) |
0.00047 (0.347) |
1 (1.00) |
0.0386 (1.00) |
0.0654 (1.00) |
1 (1.00) |
0.167 (1.00) |
0.381 (1.00) |
|
| 16p loss | 9 (2%) | 496 |
0.605 (1.00) |
0.983 (1.00) |
0.249 (1.00) |
0.00885 (1.00) |
0.367 (1.00) |
1 (1.00) |
1 (1.00) |
0.541 (1.00) |
1 (1.00) |
||
| 16q loss | 13 (3%) | 492 |
0.518 (1.00) |
0.688 (1.00) |
0.298 (1.00) |
0.00381 (1.00) |
0.458 (1.00) |
1 (1.00) |
1 (1.00) |
0.677 (1.00) |
1 (1.00) |
||
| 17p loss | 44 (9%) | 461 |
0.0427 (1.00) |
0.407 (1.00) |
0.206 (1.00) |
0.17 (1.00) |
0.376 (1.00) |
0.0927 (1.00) |
0.186 (1.00) |
0.101 (1.00) |
1 (1.00) |
0.708 (1.00) |
|
| 17q loss | 28 (6%) | 477 |
0.777 (1.00) |
0.789 (1.00) |
0.343 (1.00) |
0.325 (1.00) |
1 (1.00) |
0.324 (1.00) |
0.31 (1.00) |
0.809 (1.00) |
1 (1.00) |
||
| 18q loss | 93 (18%) | 412 |
0.00697 (1.00) |
0.136 (1.00) |
0.00921 (1.00) |
0.0048 (1.00) |
1 (1.00) |
0.0954 (1.00) |
0.118 (1.00) |
0.916 (1.00) |
0.59 (1.00) |
0.276 (1.00) |
|
| 19p loss | 11 (2%) | 494 |
0.0935 (1.00) |
0.028 (1.00) |
0.00069 (0.506) |
1 (1.00) |
0.504 (1.00) |
0.754 (1.00) |
0.19 (1.00) |
1 (1.00) |
|||
| 19q loss | 4 (1%) | 501 |
0.847 (1.00) |
0.241 (1.00) |
0.00307 (1.00) |
1 (1.00) |
0.179 (1.00) |
1 (1.00) |
1 (1.00) |
1 (1.00) |
|||
| 20p loss | 8 (2%) | 497 |
0.547 (1.00) |
0.704 (1.00) |
0.728 (1.00) |
0.618 (1.00) |
1 (1.00) |
0.455 (1.00) |
1 (1.00) |
0.132 (1.00) |
0.246 (1.00) |
||
| 20q loss | 3 (1%) | 502 |
0.116 (1.00) |
0.24 (1.00) |
0.111 (1.00) |
0.433 (1.00) |
1 (1.00) |
1 (1.00) |
0.0678 (1.00) |
||||
| 21q loss | 53 (10%) | 452 |
0.782 (1.00) |
0.546 (1.00) |
0.176 (1.00) |
0.00365 (1.00) |
0.0927 (1.00) |
0.878 (1.00) |
0.651 (1.00) |
0.962 (1.00) |
0.638 (1.00) |
1 (1.00) |
|
| 22q loss | 38 (8%) | 467 |
0.00183 (1.00) |
0.249 (1.00) |
0.0173 (1.00) |
0.147 (1.00) |
1 (1.00) |
0.149 (1.00) |
0.725 (1.00) |
0.398 (1.00) |
0.86 (1.00) |
0.0315 (1.00) |
|
| xq loss | 45 (9%) | 460 |
0.0344 (1.00) |
0.358 (1.00) |
0.714 (1.00) |
0.199 (1.00) |
0.326 (1.00) |
0.858 (1.00) |
0.141 (1.00) |
0.675 (1.00) |
0.245 (1.00) |
P value = 0.00013 (Fisher's exact test), Q value = 0.097
Table S1. Gene #6: '3q gain' versus Clinical Feature #4: 'PATHOLOGY.T.STAGE'
| nPatients | T1 | T2 | T3 | T4 |
|---|---|---|---|---|
| ALL | 250 | 67 | 177 | 11 |
| 3Q GAIN MUTATED | 17 | 6 | 33 | 4 |
| 3Q GAIN WILD-TYPE | 233 | 61 | 144 | 7 |
Figure S1. Get High-res Image Gene #6: '3q gain' versus Clinical Feature #4: 'PATHOLOGY.T.STAGE'
P value = 0.000207 (Wilcoxon-test), Q value = 0.15
Table S2. Gene #9: '5p gain' versus Clinical Feature #2: 'AGE'
| nPatients | Mean (Std.Dev) | |
|---|---|---|
| ALL | 504 | 60.5 (12.1) |
| 5P GAIN MUTATED | 187 | 63.2 (11.8) |
| 5P GAIN WILD-TYPE | 317 | 59.0 (12.1) |
Figure S2. Get High-res Image Gene #9: '5p gain' versus Clinical Feature #2: 'AGE'
P value = 1e-04 (Fisher's exact test), Q value = 0.075
Table S3. Gene #36: '20p gain' versus Clinical Feature #3: 'NEOPLASM.DISEASESTAGE'
| nPatients | STAGE I | STAGE II | STAGE III | STAGE IV |
|---|---|---|---|---|
| ALL | 244 | 56 | 126 | 79 |
| 20P GAIN MUTATED | 33 | 12 | 39 | 26 |
| 20P GAIN WILD-TYPE | 211 | 44 | 87 | 53 |
Figure S3. Get High-res Image Gene #36: '20p gain' versus Clinical Feature #3: 'NEOPLASM.DISEASESTAGE'

P value = 1e-05 (Fisher's exact test), Q value = 0.0076
Table S4. Gene #36: '20p gain' versus Clinical Feature #4: 'PATHOLOGY.T.STAGE'
| nPatients | T1 | T2 | T3 | T4 |
|---|---|---|---|---|
| ALL | 250 | 67 | 177 | 11 |
| 20P GAIN MUTATED | 34 | 13 | 57 | 6 |
| 20P GAIN WILD-TYPE | 216 | 54 | 120 | 5 |
Figure S4. Get High-res Image Gene #36: '20p gain' versus Clinical Feature #4: 'PATHOLOGY.T.STAGE'
P value = 8e-05 (Fisher's exact test), Q value = 0.06
Table S5. Gene #37: '20q gain' versus Clinical Feature #3: 'NEOPLASM.DISEASESTAGE'
| nPatients | STAGE I | STAGE II | STAGE III | STAGE IV |
|---|---|---|---|---|
| ALL | 244 | 56 | 126 | 79 |
| 20Q GAIN MUTATED | 34 | 12 | 41 | 26 |
| 20Q GAIN WILD-TYPE | 210 | 44 | 85 | 53 |
Figure S5. Get High-res Image Gene #37: '20q gain' versus Clinical Feature #3: 'NEOPLASM.DISEASESTAGE'
P value = 4e-05 (Fisher's exact test), Q value = 0.03
Table S6. Gene #37: '20q gain' versus Clinical Feature #4: 'PATHOLOGY.T.STAGE'
| nPatients | T1 | T2 | T3 | T4 |
|---|---|---|---|---|
| ALL | 250 | 67 | 177 | 11 |
| 20Q GAIN MUTATED | 36 | 13 | 59 | 5 |
| 20Q GAIN WILD-TYPE | 214 | 54 | 118 | 6 |
Figure S6. Get High-res Image Gene #37: '20q gain' versus Clinical Feature #4: 'PATHOLOGY.T.STAGE'
P value = 0.00026 (Fisher's exact test), Q value = 0.19
Table S7. Gene #47: '4p loss' versus Clinical Feature #3: 'NEOPLASM.DISEASESTAGE'
| nPatients | STAGE I | STAGE II | STAGE III | STAGE IV |
|---|---|---|---|---|
| ALL | 244 | 56 | 126 | 79 |
| 4P LOSS MUTATED | 20 | 6 | 26 | 19 |
| 4P LOSS WILD-TYPE | 224 | 50 | 100 | 60 |
Figure S7. Get High-res Image Gene #47: '4p loss' versus Clinical Feature #3: 'NEOPLASM.DISEASESTAGE'

P value = 0.00023 (Fisher's exact test), Q value = 0.17
Table S8. Gene #47: '4p loss' versus Clinical Feature #4: 'PATHOLOGY.T.STAGE'
| nPatients | T1 | T2 | T3 | T4 |
|---|---|---|---|---|
| ALL | 250 | 67 | 177 | 11 |
| 4P LOSS MUTATED | 21 | 8 | 38 | 4 |
| 4P LOSS WILD-TYPE | 229 | 59 | 139 | 7 |
Figure S8. Get High-res Image Gene #47: '4p loss' versus Clinical Feature #4: 'PATHOLOGY.T.STAGE'

P value = 2e-05 (Fisher's exact test), Q value = 0.015
Table S9. Gene #48: '4q loss' versus Clinical Feature #3: 'NEOPLASM.DISEASESTAGE'
| nPatients | STAGE I | STAGE II | STAGE III | STAGE IV |
|---|---|---|---|---|
| ALL | 244 | 56 | 126 | 79 |
| 4Q LOSS MUTATED | 15 | 6 | 24 | 20 |
| 4Q LOSS WILD-TYPE | 229 | 50 | 102 | 59 |
Figure S9. Get High-res Image Gene #48: '4q loss' versus Clinical Feature #3: 'NEOPLASM.DISEASESTAGE'
P value = 1e-05 (Fisher's exact test), Q value = 0.0076
Table S10. Gene #48: '4q loss' versus Clinical Feature #4: 'PATHOLOGY.T.STAGE'
| nPatients | T1 | T2 | T3 | T4 |
|---|---|---|---|---|
| ALL | 250 | 67 | 177 | 11 |
| 4Q LOSS MUTATED | 16 | 8 | 36 | 5 |
| 4Q LOSS WILD-TYPE | 234 | 59 | 141 | 6 |
Figure S10. Get High-res Image Gene #48: '4q loss' versus Clinical Feature #4: 'PATHOLOGY.T.STAGE'
P value = 0.00014 (Fisher's exact test), Q value = 0.1
Table S11. Gene #49: '5p loss' versus Clinical Feature #4: 'PATHOLOGY.T.STAGE'
| nPatients | T1 | T2 | T3 | T4 |
|---|---|---|---|---|
| ALL | 250 | 67 | 177 | 11 |
| 5P LOSS MUTATED | 0 | 3 | 2 | 2 |
| 5P LOSS WILD-TYPE | 250 | 64 | 175 | 9 |
Figure S11. Get High-res Image Gene #49: '5p loss' versus Clinical Feature #4: 'PATHOLOGY.T.STAGE'

P value = 0.00033 (Fisher's exact test), Q value = 0.24
Table S12. Gene #50: '5q loss' versus Clinical Feature #4: 'PATHOLOGY.T.STAGE'
| nPatients | T1 | T2 | T3 | T4 |
|---|---|---|---|---|
| ALL | 250 | 67 | 177 | 11 |
| 5Q LOSS MUTATED | 0 | 2 | 2 | 2 |
| 5Q LOSS WILD-TYPE | 250 | 65 | 175 | 9 |
Figure S12. Get High-res Image Gene #50: '5q loss' versus Clinical Feature #4: 'PATHOLOGY.T.STAGE'
P value = 1e-05 (Fisher's exact test), Q value = 0.0076
Table S13. Gene #56: '9p loss' versus Clinical Feature #3: 'NEOPLASM.DISEASESTAGE'
| nPatients | STAGE I | STAGE II | STAGE III | STAGE IV |
|---|---|---|---|---|
| ALL | 244 | 56 | 126 | 79 |
| 9P LOSS MUTATED | 48 | 11 | 50 | 35 |
| 9P LOSS WILD-TYPE | 196 | 45 | 76 | 44 |
Figure S13. Get High-res Image Gene #56: '9p loss' versus Clinical Feature #3: 'NEOPLASM.DISEASESTAGE'

P value = 4e-05 (Fisher's exact test), Q value = 0.03
Table S14. Gene #56: '9p loss' versus Clinical Feature #4: 'PATHOLOGY.T.STAGE'
| nPatients | T1 | T2 | T3 | T4 |
|---|---|---|---|---|
| ALL | 250 | 67 | 177 | 11 |
| 9P LOSS MUTATED | 52 | 15 | 72 | 5 |
| 9P LOSS WILD-TYPE | 198 | 52 | 105 | 6 |
Figure S14. Get High-res Image Gene #56: '9p loss' versus Clinical Feature #4: 'PATHOLOGY.T.STAGE'
P value = 1e-05 (Fisher's exact test), Q value = 0.0076
Table S15. Gene #57: '9q loss' versus Clinical Feature #3: 'NEOPLASM.DISEASESTAGE'
| nPatients | STAGE I | STAGE II | STAGE III | STAGE IV |
|---|---|---|---|---|
| ALL | 244 | 56 | 126 | 79 |
| 9Q LOSS MUTATED | 45 | 14 | 52 | 34 |
| 9Q LOSS WILD-TYPE | 199 | 42 | 74 | 45 |
Figure S15. Get High-res Image Gene #57: '9q loss' versus Clinical Feature #3: 'NEOPLASM.DISEASESTAGE'
P value = 1e-05 (Fisher's exact test), Q value = 0.0076
Table S16. Gene #57: '9q loss' versus Clinical Feature #4: 'PATHOLOGY.T.STAGE'
| nPatients | T1 | T2 | T3 | T4 |
|---|---|---|---|---|
| ALL | 250 | 67 | 177 | 11 |
| 9Q LOSS MUTATED | 48 | 18 | 75 | 4 |
| 9Q LOSS WILD-TYPE | 202 | 49 | 102 | 7 |
Figure S16. Get High-res Image Gene #57: '9q loss' versus Clinical Feature #4: 'PATHOLOGY.T.STAGE'
P value = 0.00011 (Fisher's exact test), Q value = 0.082
Table S17. Gene #64: '13q loss' versus Clinical Feature #3: 'NEOPLASM.DISEASESTAGE'
| nPatients | STAGE I | STAGE II | STAGE III | STAGE IV |
|---|---|---|---|---|
| ALL | 244 | 56 | 126 | 79 |
| 13Q LOSS MUTATED | 23 | 2 | 25 | 19 |
| 13Q LOSS WILD-TYPE | 221 | 54 | 101 | 60 |
Figure S17. Get High-res Image Gene #64: '13q loss' versus Clinical Feature #3: 'NEOPLASM.DISEASESTAGE'
P value = 1e-05 (Fisher's exact test), Q value = 0.0076
Table S18. Gene #64: '13q loss' versus Clinical Feature #4: 'PATHOLOGY.T.STAGE'
| nPatients | T1 | T2 | T3 | T4 |
|---|---|---|---|---|
| ALL | 250 | 67 | 177 | 11 |
| 13Q LOSS MUTATED | 25 | 3 | 34 | 7 |
| 13Q LOSS WILD-TYPE | 225 | 64 | 143 | 4 |
Figure S18. Get High-res Image Gene #64: '13q loss' versus Clinical Feature #4: 'PATHOLOGY.T.STAGE'
P value = 2e-05 (Fisher's exact test), Q value = 0.015
Table S19. Gene #65: '14q loss' versus Clinical Feature #3: 'NEOPLASM.DISEASESTAGE'
| nPatients | STAGE I | STAGE II | STAGE III | STAGE IV |
|---|---|---|---|---|
| ALL | 244 | 56 | 126 | 79 |
| 14Q LOSS MUTATED | 76 | 26 | 64 | 45 |
| 14Q LOSS WILD-TYPE | 168 | 30 | 62 | 34 |
Figure S19. Get High-res Image Gene #65: '14q loss' versus Clinical Feature #3: 'NEOPLASM.DISEASESTAGE'
P value = 0.00015 (Fisher's exact test), Q value = 0.11
Table S20. Gene #65: '14q loss' versus Clinical Feature #4: 'PATHOLOGY.T.STAGE'
| nPatients | T1 | T2 | T3 | T4 |
|---|---|---|---|---|
| ALL | 250 | 67 | 177 | 11 |
| 14Q LOSS MUTATED | 82 | 34 | 92 | 3 |
| 14Q LOSS WILD-TYPE | 168 | 33 | 85 | 8 |
Figure S20. Get High-res Image Gene #65: '14q loss' versus Clinical Feature #4: 'PATHOLOGY.T.STAGE'
P value = 0.00032 (Fisher's exact test), Q value = 0.24
Table S21. Gene #71: '18p loss' versus Clinical Feature #4: 'PATHOLOGY.T.STAGE'
| nPatients | T1 | T2 | T3 | T4 |
|---|---|---|---|---|
| ALL | 250 | 67 | 177 | 11 |
| 18P LOSS MUTATED | 31 | 9 | 46 | 5 |
| 18P LOSS WILD-TYPE | 219 | 58 | 131 | 6 |
Figure S21. Get High-res Image Gene #71: '18p loss' versus Clinical Feature #4: 'PATHOLOGY.T.STAGE'
-
Copy number data file = transformed.cor.cli.txt
-
Clinical data file = KIRC-TP.merged_data.txt
-
Number of patients = 505
-
Number of significantly arm-level cnvs = 79
-
Number of selected clinical features = 11
-
Exclude regions that fewer than K tumors have mutations, K = 3
For survival clinical features, the Kaplan-Meier survival curves of tumors with and without gene mutations were plotted and the statistical significance P values were estimated by logrank test (Bland and Altman 2004) using the 'survdiff' function in R
For binary or multi-class clinical features (nominal or ordinal), two-tailed Fisher's exact tests (Fisher 1922) were used to estimate the P values using the 'fisher.test' function in R
For multiple hypothesis correction, Q value is the False Discovery Rate (FDR) analogue of the P value (Benjamini and Hochberg 1995), defined as the minimum FDR at which the test may be called significant. We used the 'Benjamini and Hochberg' method of 'p.adjust' function in R to convert P values into Q values.
In addition to the links below, the full results of the analysis summarized in this report can also be downloaded programmatically using firehose_get, or interactively from either the Broad GDAC website or TCGA Data Coordination Center Portal.