This pipeline computes the correlation between significant arm-level copy number variations (cnvs) and selected clinical features.
Testing the association between copy number variation 69 arm-level events and 11 clinical features across 198 patients, 47 significant findings detected with Q value < 0.25.
-
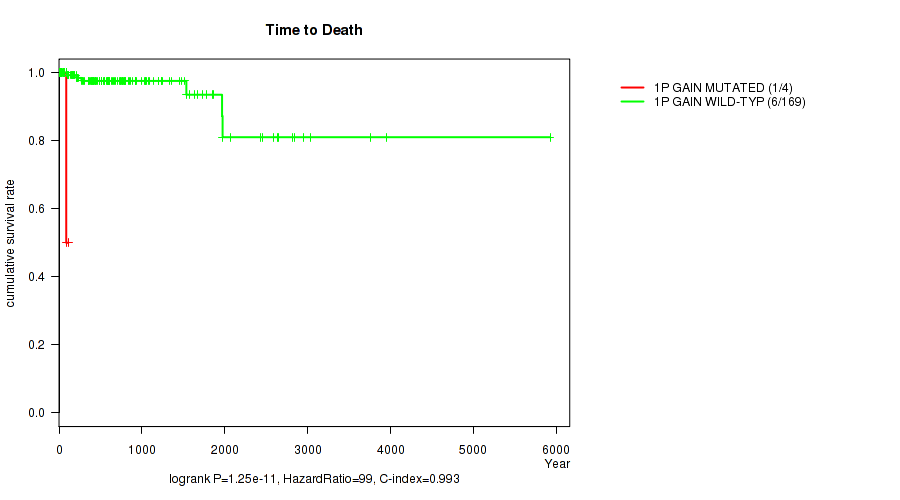
1p gain cnv correlated to 'Time to Death'.
-
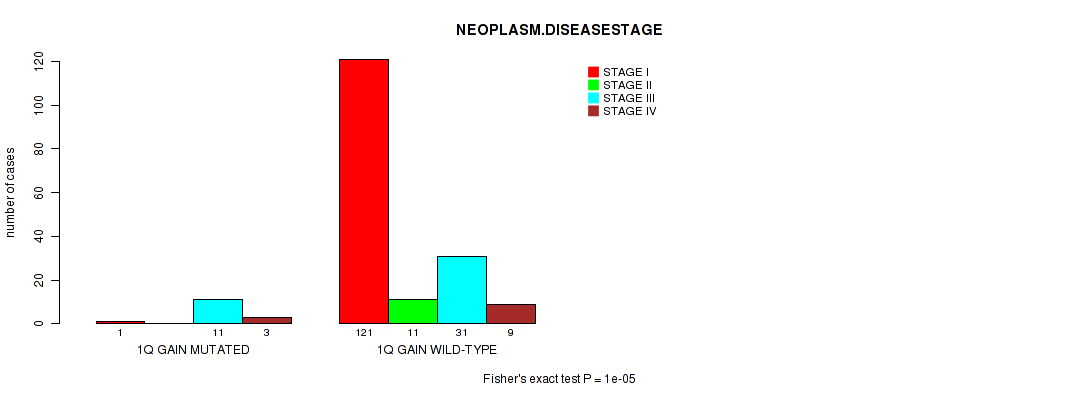
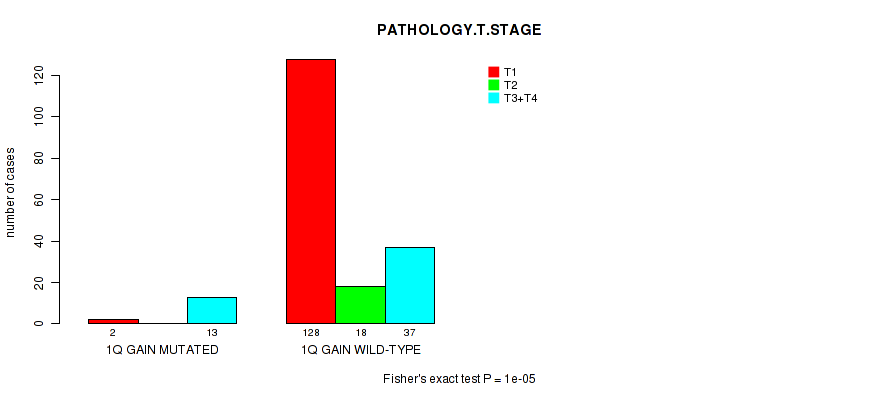
1q gain cnv correlated to 'Time to Death', 'NEOPLASM.DISEASESTAGE', and 'PATHOLOGY.T.STAGE'.
-
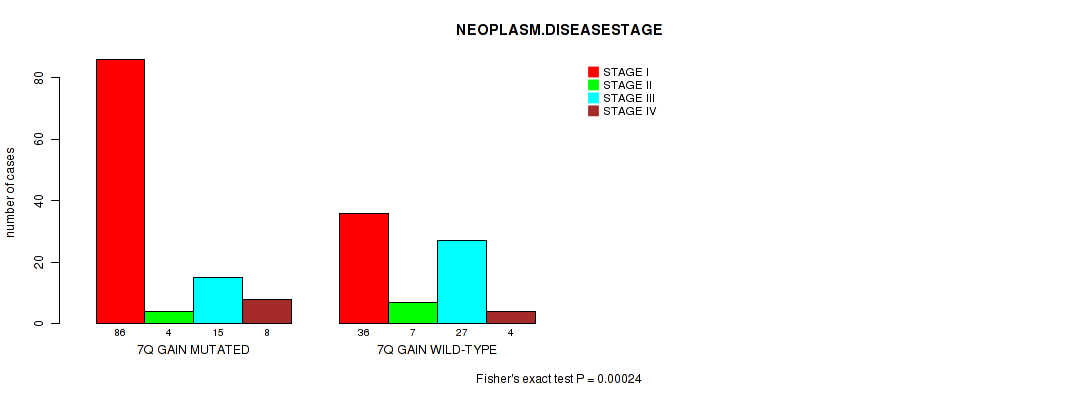
7q gain cnv correlated to 'NEOPLASM.DISEASESTAGE'.
-
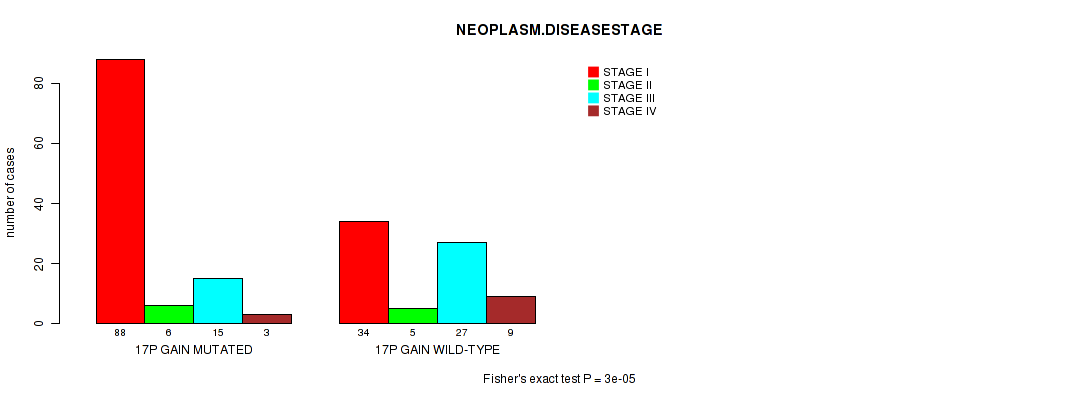
17p gain cnv correlated to 'NEOPLASM.DISEASESTAGE' and 'PATHOLOGY.M.STAGE'.
-
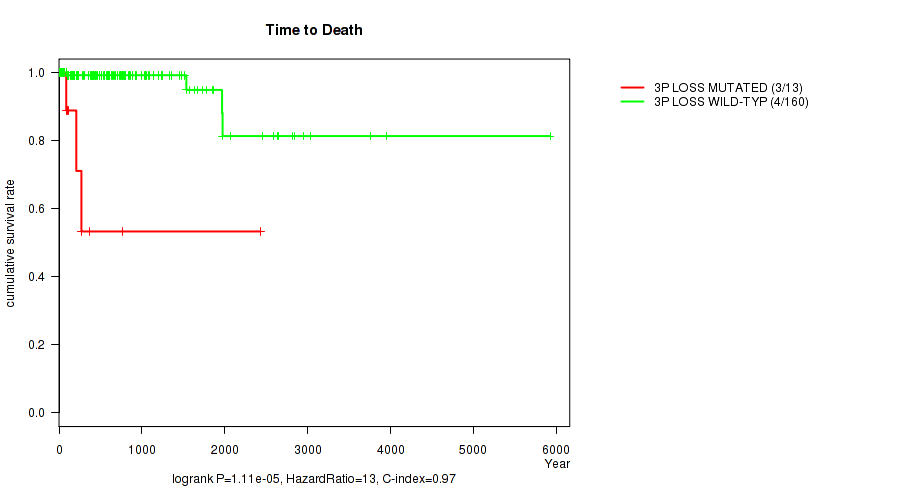
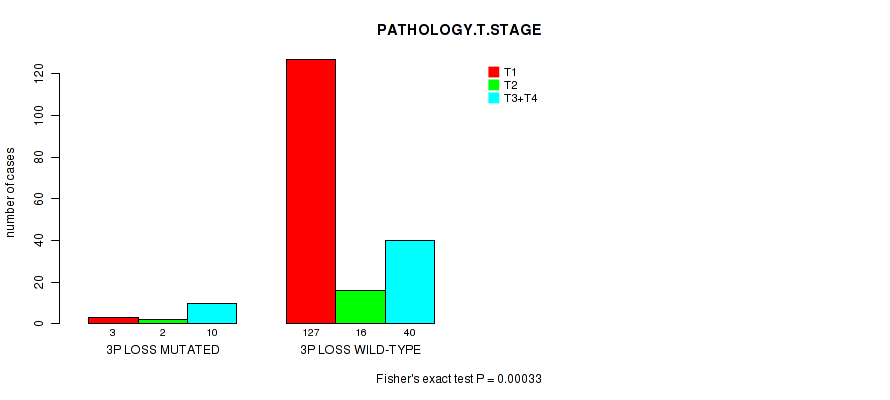
3p loss cnv correlated to 'Time to Death', 'NEOPLASM.DISEASESTAGE', and 'PATHOLOGY.T.STAGE'.
-
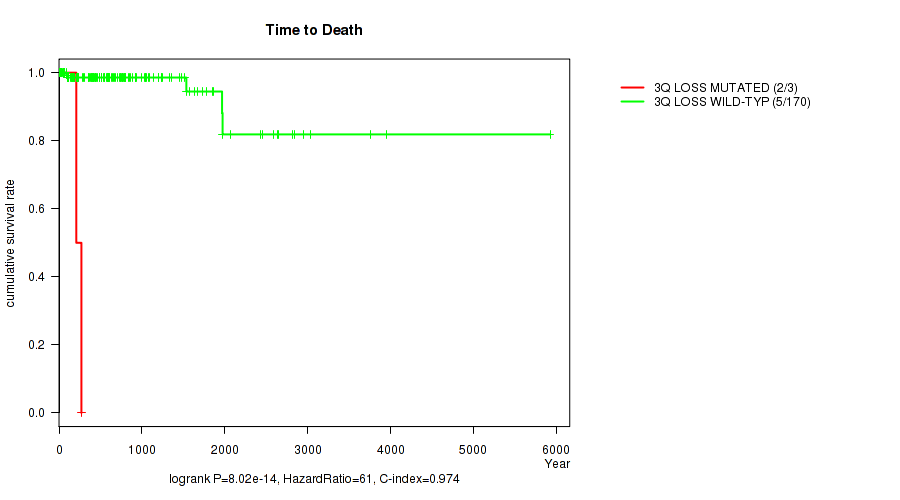
3q loss cnv correlated to 'Time to Death'.
-
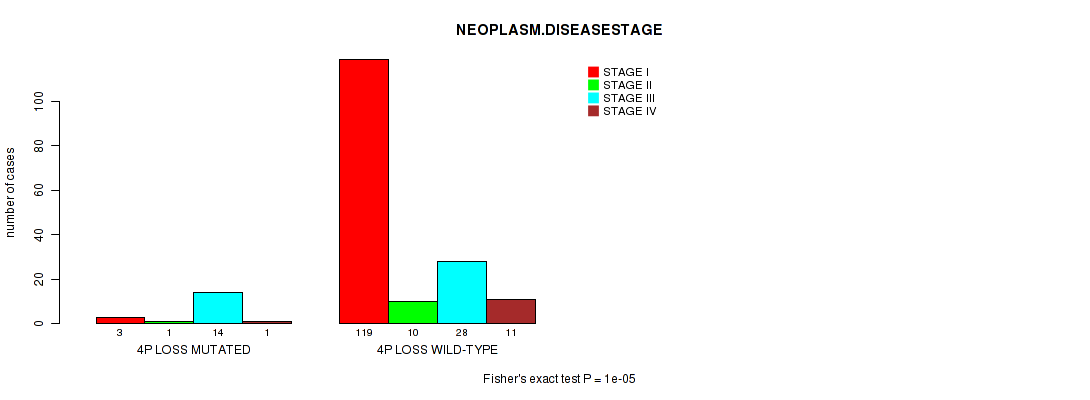
4p loss cnv correlated to 'NEOPLASM.DISEASESTAGE', 'PATHOLOGY.T.STAGE', and 'GENDER'.
-
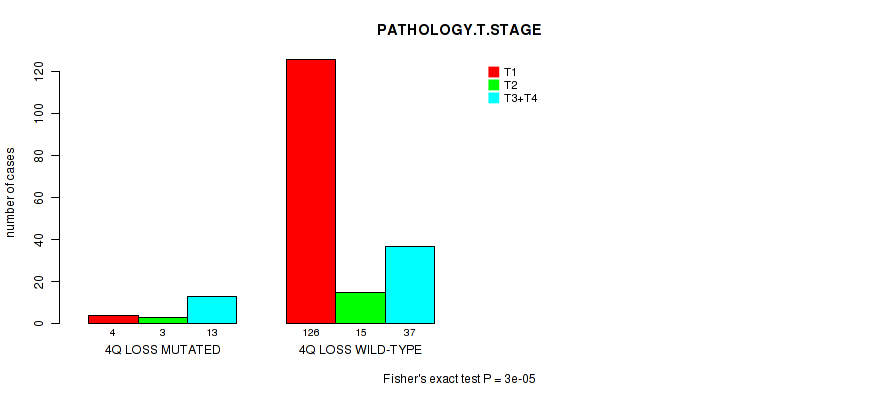
4q loss cnv correlated to 'NEOPLASM.DISEASESTAGE' and 'PATHOLOGY.T.STAGE'.
-
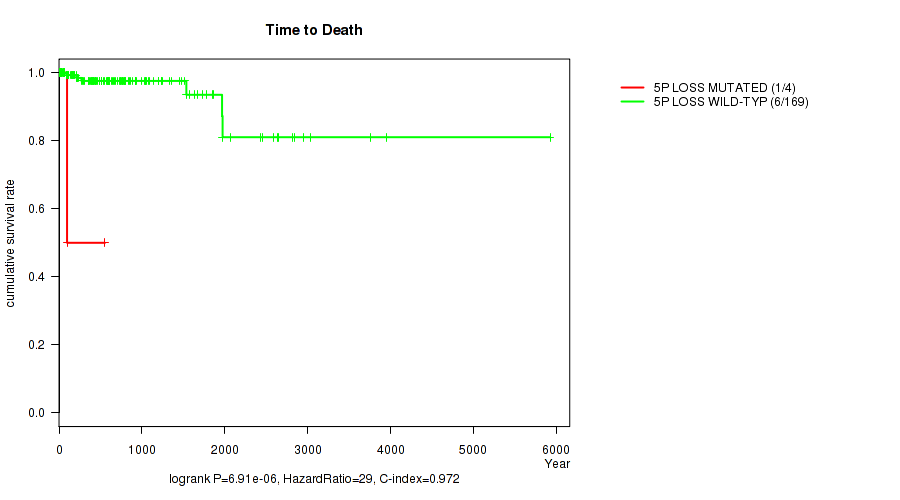
5p loss cnv correlated to 'Time to Death'.
-
5q loss cnv correlated to 'Time to Death'.
-
8q loss cnv correlated to 'Time to Death'.
-
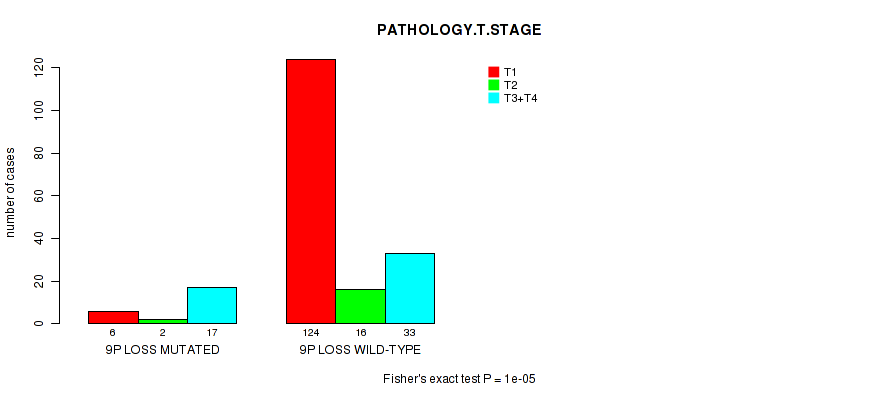
9p loss cnv correlated to 'NEOPLASM.DISEASESTAGE' and 'PATHOLOGY.T.STAGE'.
-
9q loss cnv correlated to 'NEOPLASM.DISEASESTAGE' and 'PATHOLOGY.T.STAGE'.
-
11p loss cnv correlated to 'Time to Death'.
-
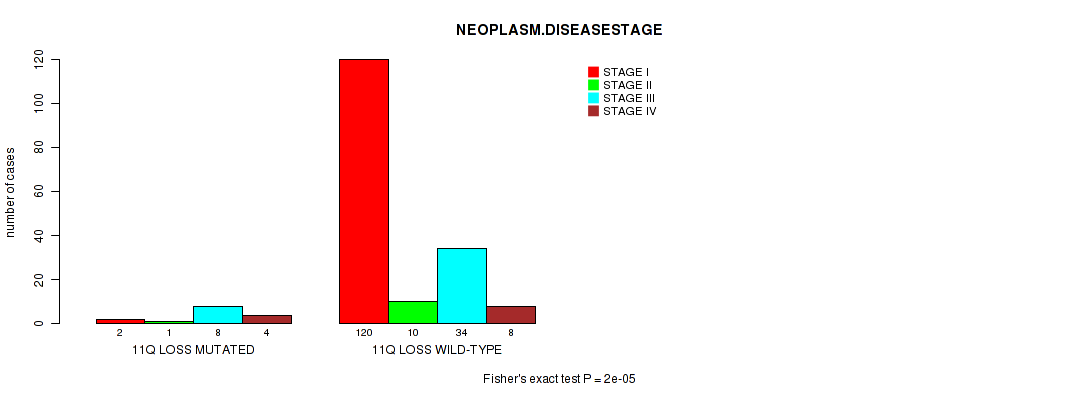
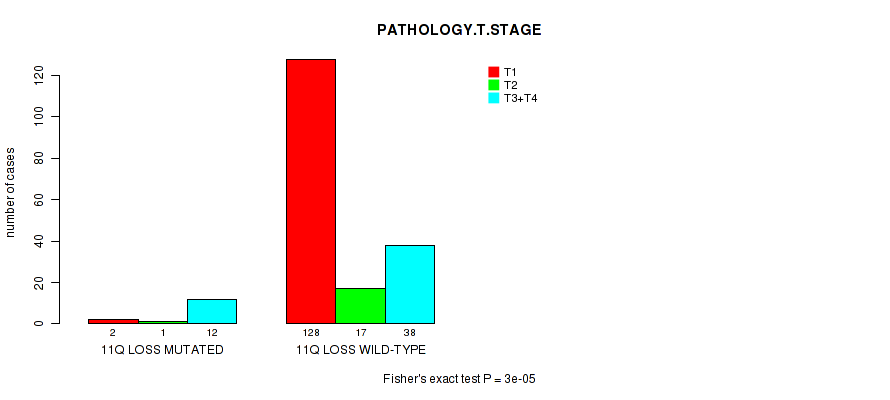
11q loss cnv correlated to 'NEOPLASM.DISEASESTAGE' and 'PATHOLOGY.T.STAGE'.
-
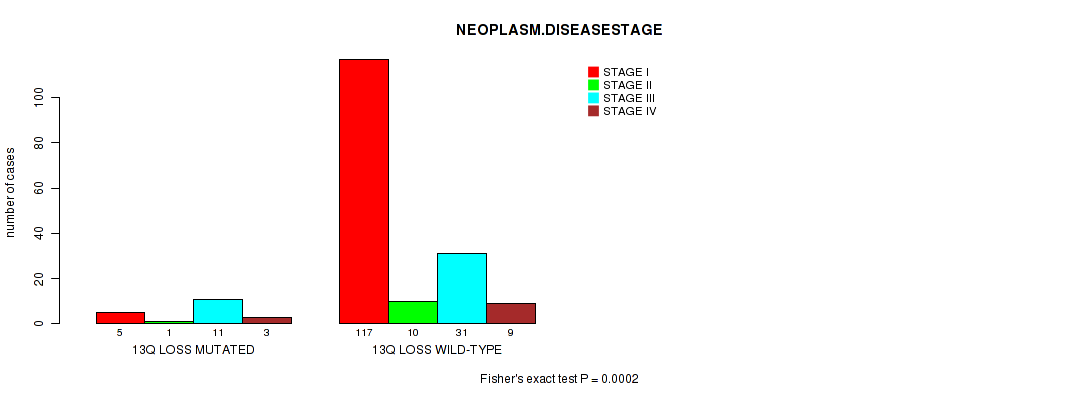
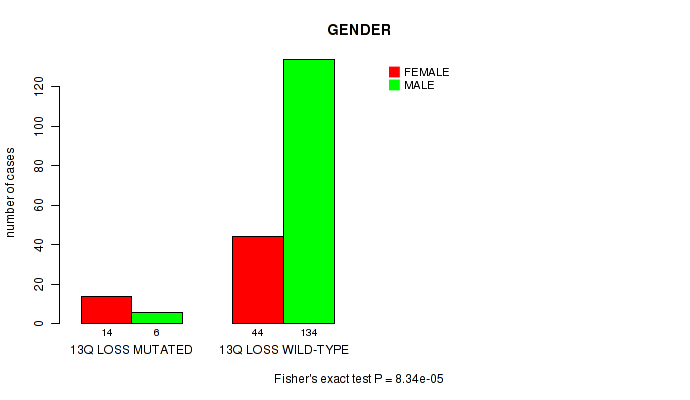
13q loss cnv correlated to 'Time to Death', 'NEOPLASM.DISEASESTAGE', 'PATHOLOGY.T.STAGE', and 'GENDER'.
-
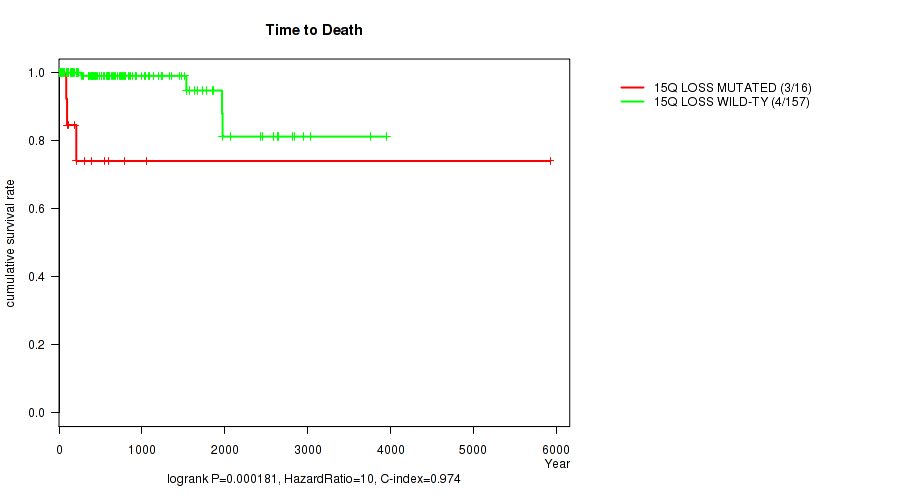
15q loss cnv correlated to 'Time to Death'.
-
16q loss cnv correlated to 'Time to Death'.
-
17p loss cnv correlated to 'Time to Death' and 'NEOPLASM.DISEASESTAGE'.
-
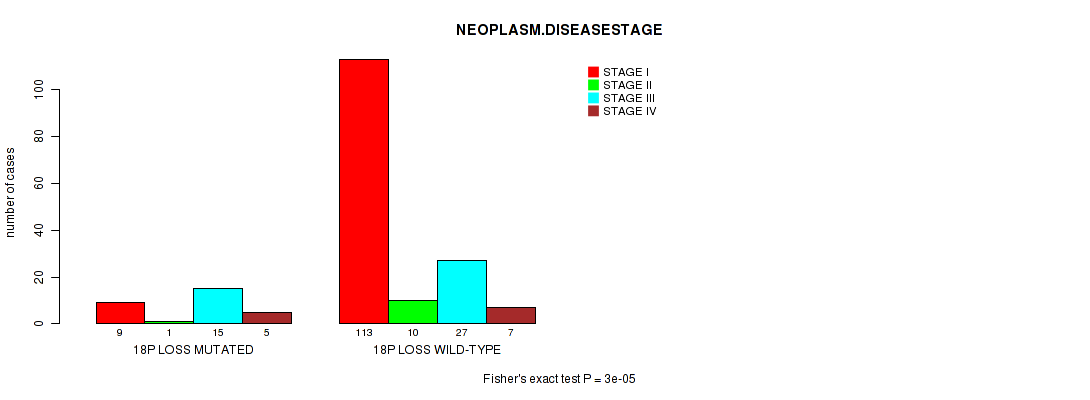
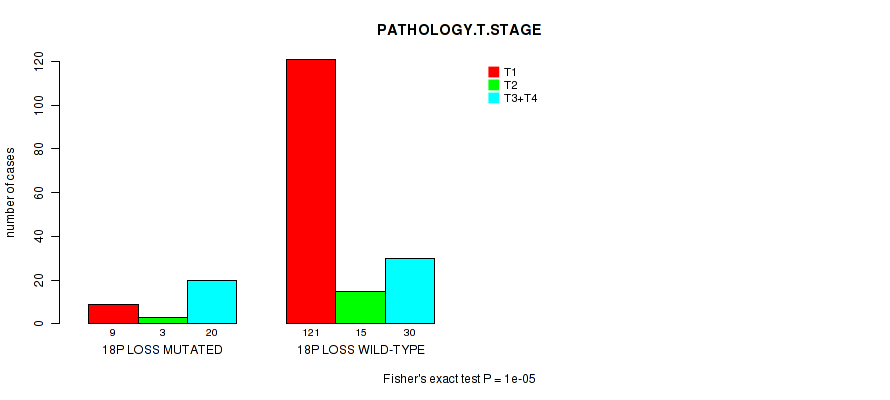
18p loss cnv correlated to 'NEOPLASM.DISEASESTAGE' and 'PATHOLOGY.T.STAGE'.
-
18q loss cnv correlated to 'Time to Death', 'NEOPLASM.DISEASESTAGE', and 'PATHOLOGY.T.STAGE'.
-
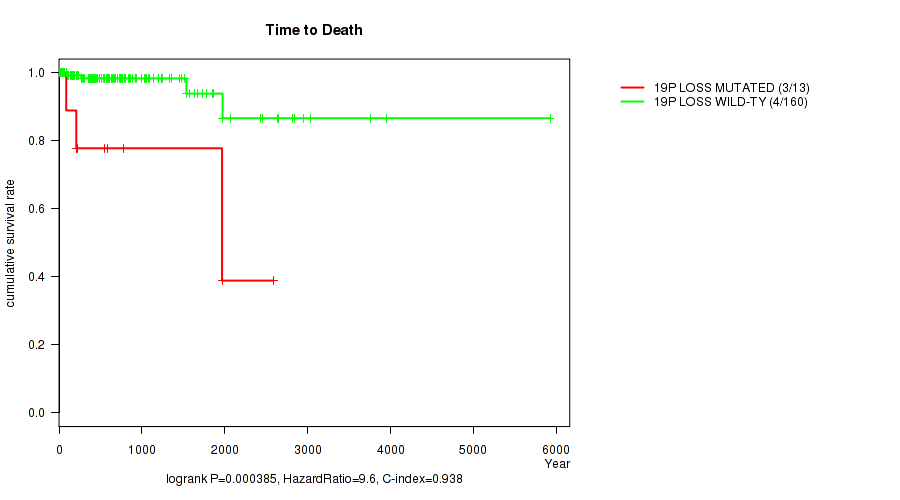
19p loss cnv correlated to 'Time to Death'.
-
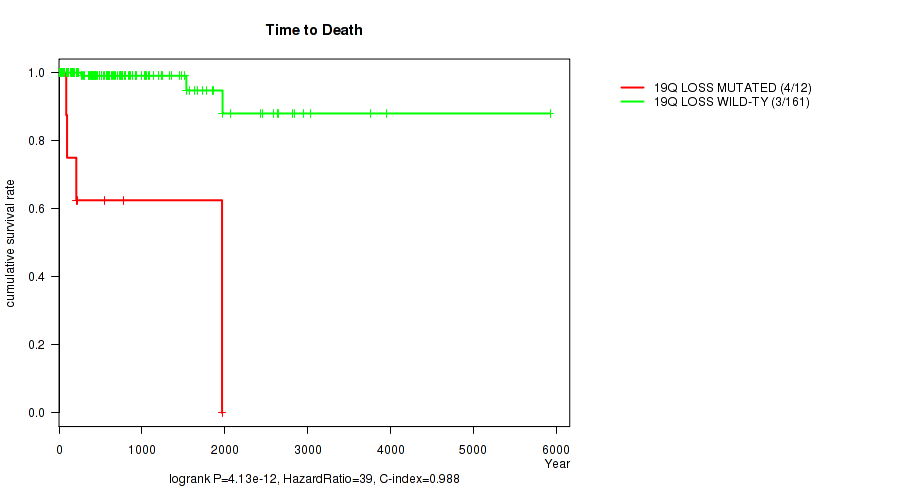
19q loss cnv correlated to 'Time to Death', 'NEOPLASM.DISEASESTAGE', and 'PATHOLOGY.T.STAGE'.
-
22q loss cnv correlated to 'NEOPLASM.DISEASESTAGE' and 'PATHOLOGY.T.STAGE'.
-
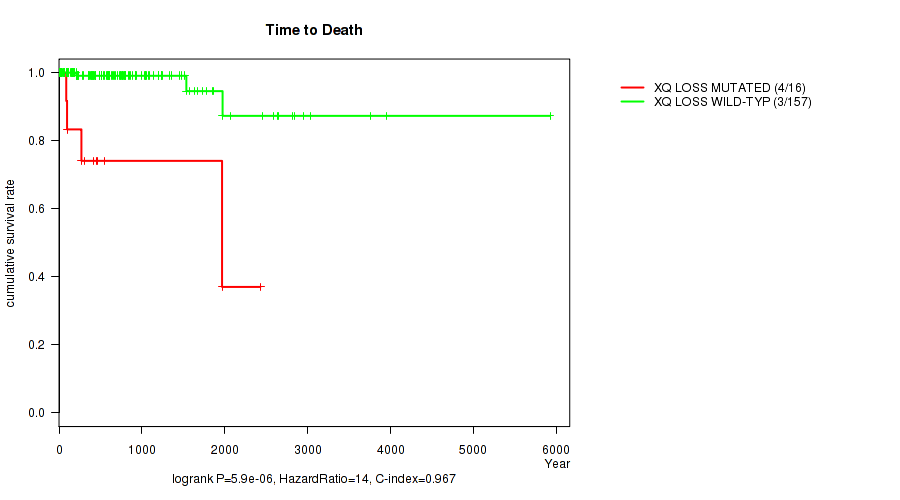
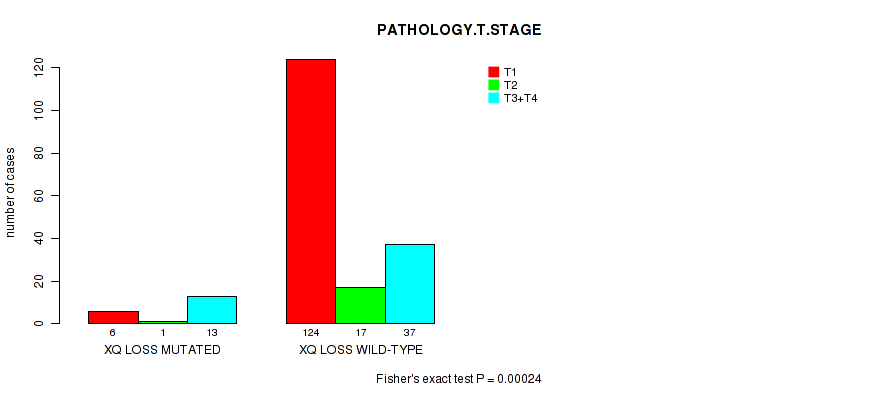
xq loss cnv correlated to 'Time to Death' and 'PATHOLOGY.T.STAGE'.
Table 1. Get Full Table Overview of the association between significant copy number variation of 69 arm-level events and 11 clinical features. Shown in the table are P values (Q values). Thresholded by Q value < 0.25, 47 significant findings detected.
|
Clinical Features |
Time to Death |
AGE |
NEOPLASM DISEASESTAGE |
PATHOLOGY T STAGE |
PATHOLOGY N STAGE |
PATHOLOGY M STAGE |
GENDER |
KARNOFSKY PERFORMANCE SCORE |
NUMBERPACKYEARSSMOKED | RACE | ETHNICITY | ||
| nCNV (%) | nWild-Type | logrank test | Wilcoxon-test | Fisher's exact test | Fisher's exact test | Fisher's exact test | Fisher's exact test | Fisher's exact test | Wilcoxon-test | Wilcoxon-test | Fisher's exact test | Fisher's exact test | |
| 13q loss | 20 (10%) | 178 |
0.000105 (0.0683) |
0.0145 (1.00) |
0.0002 (0.129) |
0.00013 (0.0846) |
0.00591 (1.00) |
0.584 (1.00) |
8.34e-05 (0.0546) |
0.469 (1.00) |
0.102 (1.00) |
1 (1.00) |
|
| 1q gain | 15 (8%) | 183 |
6.77e-08 (4.62e-05) |
0.935 (1.00) |
1e-05 (0.00677) |
1e-05 (0.00677) |
0.184 (1.00) |
0.166 (1.00) |
0.0419 (1.00) |
0.241 (1.00) |
0.285 (1.00) |
1 (1.00) |
|
| 3p loss | 15 (8%) | 183 |
1.11e-05 (0.00739) |
0.171 (1.00) |
5e-05 (0.0328) |
0.00033 (0.212) |
0.884 (1.00) |
0.106 (1.00) |
0.77 (1.00) |
0.317 (1.00) |
0.785 (1.00) |
0.451 (1.00) |
1 (1.00) |
| 4p loss | 19 (10%) | 179 |
0.0188 (1.00) |
0.00357 (1.00) |
1e-05 (0.00677) |
1e-05 (0.00677) |
0.00255 (1.00) |
0.695 (1.00) |
3.24e-05 (0.0213) |
0.219 (1.00) |
0.0962 (1.00) |
0.566 (1.00) |
|
| 18q loss | 33 (17%) | 165 |
8.33e-07 (0.000568) |
0.462 (1.00) |
2e-05 (0.0133) |
3e-05 (0.0199) |
0.0156 (1.00) |
0.0411 (1.00) |
0.0926 (1.00) |
0.362 (1.00) |
0.35 (1.00) |
0.258 (1.00) |
1 (1.00) |
| 19q loss | 12 (6%) | 186 |
4.13e-12 (2.83e-09) |
0.839 (1.00) |
0.00019 (0.123) |
0.00032 (0.206) |
0.0793 (1.00) |
0.0593 (1.00) |
0.114 (1.00) |
0.152 (1.00) |
0.792 (1.00) |
0.826 (1.00) |
1 (1.00) |
| 17p gain | 120 (61%) | 78 |
0.159 (1.00) |
0.0113 (1.00) |
3e-05 (0.0199) |
0.00059 (0.375) |
0.191 (1.00) |
0.00024 (0.155) |
0.0562 (1.00) |
0.954 (1.00) |
0.839 (1.00) |
0.227 (1.00) |
0.277 (1.00) |
| 4q loss | 20 (10%) | 178 |
0.0259 (1.00) |
0.0322 (1.00) |
4e-05 (0.0263) |
3e-05 (0.0199) |
0.0173 (1.00) |
0.264 (1.00) |
0.000517 (0.33) |
0.152 (1.00) |
0.104 (1.00) |
0.593 (1.00) |
|
| 9p loss | 25 (13%) | 173 |
0.0115 (1.00) |
0.636 (1.00) |
1e-05 (0.00677) |
1e-05 (0.00677) |
0.0584 (1.00) |
0.0912 (1.00) |
0.00376 (1.00) |
0.0166 (1.00) |
0.0283 (1.00) |
0.0311 (1.00) |
0.606 (1.00) |
| 9q loss | 26 (13%) | 172 |
0.00566 (1.00) |
0.563 (1.00) |
3e-05 (0.0199) |
1e-05 (0.00677) |
0.0468 (1.00) |
0.488 (1.00) |
0.00514 (1.00) |
0.0362 (1.00) |
0.148 (1.00) |
0.0638 (1.00) |
0.603 (1.00) |
| 11q loss | 15 (8%) | 183 |
0.0076 (1.00) |
0.319 (1.00) |
2e-05 (0.0133) |
3e-05 (0.0199) |
0.0357 (1.00) |
0.191 (1.00) |
0.38 (1.00) |
0.317 (1.00) |
0.483 (1.00) |
1 (1.00) |
|
| 17p loss | 9 (5%) | 189 |
6.34e-11 (4.34e-08) |
0.771 (1.00) |
0.00019 (0.123) |
0.00103 (0.649) |
0.00486 (1.00) |
0.0408 (1.00) |
0.0199 (1.00) |
0.748 (1.00) |
1 (1.00) |
1 (1.00) |
|
| 18p loss | 32 (16%) | 166 |
0.0014 (0.875) |
0.188 (1.00) |
3e-05 (0.0199) |
1e-05 (0.00677) |
0.0598 (1.00) |
0.0303 (1.00) |
0.0208 (1.00) |
0.482 (1.00) |
0.511 (1.00) |
0.306 (1.00) |
1 (1.00) |
| 22q loss | 47 (24%) | 151 |
0.00277 (1.00) |
0.233 (1.00) |
1e-05 (0.00677) |
1e-05 (0.00677) |
0.0242 (1.00) |
0.0389 (1.00) |
0.00154 (0.966) |
0.496 (1.00) |
0.463 (1.00) |
0.136 (1.00) |
0.407 (1.00) |
| xq loss | 20 (10%) | 178 |
5.9e-06 (0.00401) |
0.0901 (1.00) |
0.00068 (0.431) |
0.00024 (0.155) |
0.0233 (1.00) |
0.285 (1.00) |
0.0398 (1.00) |
0.322 (1.00) |
0.0979 (1.00) |
1 (1.00) |
|
| 1p gain | 6 (3%) | 192 |
1.25e-11 (8.59e-09) |
0.718 (1.00) |
0.00168 (1.00) |
0.00712 (1.00) |
0.0444 (1.00) |
0.129 (1.00) |
0.062 (1.00) |
0.43 (1.00) |
1 (1.00) |
||
| 7q gain | 121 (61%) | 77 |
0.411 (1.00) |
0.128 (1.00) |
0.00024 (0.155) |
0.00845 (1.00) |
0.458 (1.00) |
0.632 (1.00) |
0.109 (1.00) |
0.086 (1.00) |
0.885 (1.00) |
0.795 (1.00) |
0.293 (1.00) |
| 3q loss | 4 (2%) | 194 |
8.02e-14 (5.51e-11) |
0.123 (1.00) |
0.00457 (1.00) |
0.00892 (1.00) |
0.164 (1.00) |
0.199 (1.00) |
0.582 (1.00) |
1 (1.00) |
1 (1.00) |
||
| 5p loss | 7 (4%) | 191 |
6.91e-06 (0.00469) |
0.0365 (1.00) |
0.014 (1.00) |
0.00266 (1.00) |
0.0336 (1.00) |
0.129 (1.00) |
0.0238 (1.00) |
1 (1.00) |
0.251 (1.00) |
||
| 5q loss | 7 (4%) | 191 |
0.000104 (0.068) |
0.00572 (1.00) |
0.0224 (1.00) |
0.00264 (1.00) |
0.046 (1.00) |
0.127 (1.00) |
0.0238 (1.00) |
1 (1.00) |
0.251 (1.00) |
||
| 8q loss | 5 (3%) | 193 |
0.000126 (0.0823) |
0.997 (1.00) |
0.144 (1.00) |
0.583 (1.00) |
0.251 (1.00) |
0.151 (1.00) |
0.172 (1.00) |
1 (1.00) |
|||
| 11p loss | 12 (6%) | 186 |
1.37e-06 (0.000932) |
0.0802 (1.00) |
0.00631 (1.00) |
0.0064 (1.00) |
0.0796 (1.00) |
0.406 (1.00) |
0.339 (1.00) |
0.227 (1.00) |
0.807 (1.00) |
1 (1.00) |
|
| 15q loss | 21 (11%) | 177 |
0.000181 (0.118) |
0.0364 (1.00) |
0.00118 (0.742) |
0.00063 (0.4) |
0.058 (1.00) |
0.328 (1.00) |
0.203 (1.00) |
0.227 (1.00) |
0.41 (1.00) |
1 (1.00) |
|
| 16q loss | 6 (3%) | 192 |
7.46e-07 (0.000509) |
0.171 (1.00) |
0.022 (1.00) |
0.0955 (1.00) |
0.166 (1.00) |
0.762 (1.00) |
0.361 (1.00) |
0.629 (1.00) |
1 (1.00) |
||
| 19p loss | 13 (7%) | 185 |
0.000385 (0.247) |
0.125 (1.00) |
0.00799 (1.00) |
0.00793 (1.00) |
0.0789 (1.00) |
0.175 (1.00) |
0.53 (1.00) |
0.152 (1.00) |
0.726 (1.00) |
1 (1.00) |
1 (1.00) |
| 2p gain | 37 (19%) | 161 |
0.869 (1.00) |
0.373 (1.00) |
0.0613 (1.00) |
0.484 (1.00) |
0.199 (1.00) |
0.00458 (1.00) |
0.69 (1.00) |
0.886 (1.00) |
0.307 (1.00) |
0.695 (1.00) |
1 (1.00) |
| 2q gain | 39 (20%) | 159 |
0.823 (1.00) |
0.696 (1.00) |
0.0159 (1.00) |
0.479 (1.00) |
0.104 (1.00) |
0.00689 (1.00) |
0.559 (1.00) |
0.719 (1.00) |
0.307 (1.00) |
0.623 (1.00) |
1 (1.00) |
| 3p gain | 58 (29%) | 140 |
0.107 (1.00) |
0.796 (1.00) |
0.0153 (1.00) |
0.0175 (1.00) |
0.835 (1.00) |
0.21 (1.00) |
0.607 (1.00) |
0.0208 (1.00) |
0.366 (1.00) |
0.789 (1.00) |
1 (1.00) |
| 3q gain | 68 (34%) | 130 |
0.21 (1.00) |
0.425 (1.00) |
0.0929 (1.00) |
0.0972 (1.00) |
0.882 (1.00) |
0.0853 (1.00) |
0.412 (1.00) |
0.168 (1.00) |
0.549 (1.00) |
0.29 (1.00) |
0.719 (1.00) |
| 4p gain | 6 (3%) | 192 |
0.00876 (1.00) |
0.0107 (1.00) |
0.0861 (1.00) |
0.505 (1.00) |
0.468 (1.00) |
0.18 (1.00) |
0.673 (1.00) |
1 (1.00) |
1 (1.00) |
||
| 4q gain | 5 (3%) | 193 |
0.00876 (1.00) |
0.0336 (1.00) |
0.365 (1.00) |
0.585 (1.00) |
0.148 (1.00) |
0.687 (1.00) |
1 (1.00) |
1 (1.00) |
1 (1.00) |
||
| 5p gain | 27 (14%) | 171 |
0.732 (1.00) |
0.63 (1.00) |
0.322 (1.00) |
0.261 (1.00) |
0.408 (1.00) |
0.428 (1.00) |
0.821 (1.00) |
0.275 (1.00) |
0.693 (1.00) |
0.371 (1.00) |
0.611 (1.00) |
| 5q gain | 27 (14%) | 171 |
0.732 (1.00) |
0.971 (1.00) |
0.324 (1.00) |
0.441 (1.00) |
0.77 (1.00) |
0.432 (1.00) |
0.821 (1.00) |
0.275 (1.00) |
0.693 (1.00) |
0.582 (1.00) |
0.361 (1.00) |
| 6p gain | 8 (4%) | 190 |
0.603 (1.00) |
0.504 (1.00) |
0.00289 (1.00) |
0.00084 (0.531) |
0.258 (1.00) |
0.0509 (1.00) |
0.695 (1.00) |
1 (1.00) |
1 (1.00) |
1 (1.00) |
|
| 6q gain | 6 (3%) | 192 |
0.859 (1.00) |
0.173 (1.00) |
0.0148 (1.00) |
0.00726 (1.00) |
0.0765 (1.00) |
0.0182 (1.00) |
0.361 (1.00) |
1 (1.00) |
0.727 (1.00) |
1 (1.00) |
|
| 7p gain | 120 (61%) | 78 |
0.426 (1.00) |
0.166 (1.00) |
0.00046 (0.294) |
0.0131 (1.00) |
0.586 (1.00) |
0.548 (1.00) |
0.112 (1.00) |
0.086 (1.00) |
0.885 (1.00) |
0.762 (1.00) |
0.299 (1.00) |
| 8p gain | 12 (6%) | 186 |
0.0931 (1.00) |
0.964 (1.00) |
0.169 (1.00) |
0.1 (1.00) |
0.208 (1.00) |
1 (1.00) |
0.339 (1.00) |
0.118 (1.00) |
1 (1.00) |
||
| 8q gain | 17 (9%) | 181 |
0.0931 (1.00) |
0.501 (1.00) |
0.00194 (1.00) |
0.00071 (0.449) |
0.0157 (1.00) |
0.141 (1.00) |
0.0467 (1.00) |
0.603 (1.00) |
0.0905 (1.00) |
1 (1.00) |
|
| 9p gain | 3 (2%) | 195 |
0.477 (1.00) |
0.0337 (1.00) |
0.0545 (1.00) |
0.643 (1.00) |
1 (1.00) |
0.604 (1.00) |
1 (1.00) |
||||
| 10p gain | 8 (4%) | 190 |
0.727 (1.00) |
0.381 (1.00) |
0.215 (1.00) |
0.413 (1.00) |
1 (1.00) |
0.0365 (1.00) |
0.695 (1.00) |
0.00498 (1.00) |
1 (1.00) |
||
| 10q gain | 8 (4%) | 190 |
0.727 (1.00) |
0.381 (1.00) |
0.217 (1.00) |
0.411 (1.00) |
1 (1.00) |
0.037 (1.00) |
0.695 (1.00) |
0.0045 (1.00) |
1 (1.00) |
||
| 11p gain | 10 (5%) | 188 |
0.603 (1.00) |
0.217 (1.00) |
0.0452 (1.00) |
0.0303 (1.00) |
0.558 (1.00) |
0.0473 (1.00) |
0.161 (1.00) |
0.337 (1.00) |
1 (1.00) |
||
| 11q gain | 9 (5%) | 189 |
0.603 (1.00) |
0.0943 (1.00) |
0.134 (1.00) |
0.0615 (1.00) |
0.723 (1.00) |
0.263 (1.00) |
0.0199 (1.00) |
0.349 (1.00) |
1 (1.00) |
||
| 12p gain | 81 (41%) | 117 |
0.0904 (1.00) |
0.328 (1.00) |
0.158 (1.00) |
0.474 (1.00) |
0.623 (1.00) |
0.203 (1.00) |
0.0171 (1.00) |
0.356 (1.00) |
0.541 (1.00) |
0.63 (1.00) |
0.0796 (1.00) |
| 12q gain | 81 (41%) | 117 |
0.0904 (1.00) |
0.328 (1.00) |
0.161 (1.00) |
0.476 (1.00) |
0.627 (1.00) |
0.2 (1.00) |
0.0171 (1.00) |
0.356 (1.00) |
0.541 (1.00) |
0.631 (1.00) |
0.0796 (1.00) |
| 13q gain | 22 (11%) | 176 |
0.875 (1.00) |
0.459 (1.00) |
0.568 (1.00) |
0.553 (1.00) |
0.725 (1.00) |
0.855 (1.00) |
1 (1.00) |
0.318 (1.00) |
0.734 (1.00) |
0.285 (1.00) |
|
| 14q gain | 3 (2%) | 195 |
0.0553 (1.00) |
0.0223 (1.00) |
0.643 (1.00) |
0.206 (1.00) |
1 (1.00) |
||||||
| 15q gain | 5 (3%) | 193 |
0.597 (1.00) |
0.891 (1.00) |
0.182 (1.00) |
0.245 (1.00) |
0.503 (1.00) |
0.151 (1.00) |
0.677 (1.00) |
1 (1.00) |
|||
| 16p gain | 106 (54%) | 92 |
0.18 (1.00) |
0.156 (1.00) |
0.821 (1.00) |
0.659 (1.00) |
1 (1.00) |
0.562 (1.00) |
0.00507 (1.00) |
0.679 (1.00) |
0.383 (1.00) |
0.036 (1.00) |
0.0824 (1.00) |
| 16q gain | 102 (52%) | 96 |
0.0406 (1.00) |
0.334 (1.00) |
0.472 (1.00) |
0.3 (1.00) |
0.768 (1.00) |
0.151 (1.00) |
0.0419 (1.00) |
0.233 (1.00) |
0.794 (1.00) |
0.161 (1.00) |
0.0896 (1.00) |
| 17q gain | 135 (68%) | 63 |
0.263 (1.00) |
0.0514 (1.00) |
0.0465 (1.00) |
0.205 (1.00) |
0.369 (1.00) |
0.00229 (1.00) |
0.406 (1.00) |
0.76 (1.00) |
0.503 (1.00) |
0.416 (1.00) |
0.265 (1.00) |
| 18p gain | 9 (5%) | 189 |
0.201 (1.00) |
0.925 (1.00) |
0.368 (1.00) |
1 (1.00) |
0.64 (1.00) |
0.121 (1.00) |
0.288 (1.00) |
0.623 (1.00) |
0.32 (1.00) |
1 (1.00) |
|
| 18q gain | 6 (3%) | 192 |
0.623 (1.00) |
0.797 (1.00) |
0.621 (1.00) |
0.634 (1.00) |
0.344 (1.00) |
0.673 (1.00) |
0.0964 (1.00) |
0.336 (1.00) |
1 (1.00) |
||
| 19p gain | 4 (2%) | 194 |
0.779 (1.00) |
0.0504 (1.00) |
0.573 (1.00) |
0.527 (1.00) |
1 (1.00) |
0.442 (1.00) |
0.582 (1.00) |
0.0944 (1.00) |
1 (1.00) |
||
| 19q gain | 4 (2%) | 194 |
0.779 (1.00) |
0.0504 (1.00) |
0.57 (1.00) |
0.528 (1.00) |
1 (1.00) |
0.442 (1.00) |
0.582 (1.00) |
0.0948 (1.00) |
1 (1.00) |
||
| 20p gain | 69 (35%) | 129 |
0.897 (1.00) |
0.25 (1.00) |
0.377 (1.00) |
0.4 (1.00) |
1 (1.00) |
0.896 (1.00) |
0.624 (1.00) |
0.389 (1.00) |
0.588 (1.00) |
0.689 (1.00) |
0.495 (1.00) |
| 20q gain | 71 (36%) | 127 |
0.919 (1.00) |
0.232 (1.00) |
0.214 (1.00) |
0.286 (1.00) |
0.902 (1.00) |
0.836 (1.00) |
0.516 (1.00) |
0.389 (1.00) |
0.588 (1.00) |
0.601 (1.00) |
0.492 (1.00) |
| 21q gain | 12 (6%) | 186 |
0.677 (1.00) |
0.135 (1.00) |
0.858 (1.00) |
1 (1.00) |
0.637 (1.00) |
0.125 (1.00) |
0.75 (1.00) |
0.931 (1.00) |
0.0494 (1.00) |
0.478 (1.00) |
|
| xq gain | 67 (34%) | 131 |
0.287 (1.00) |
0.71 (1.00) |
0.00613 (1.00) |
0.0184 (1.00) |
0.572 (1.00) |
0.679 (1.00) |
0.0709 (1.00) |
0.0448 (1.00) |
0.746 (1.00) |
0.311 (1.00) |
0.72 (1.00) |
| 1p loss | 20 (10%) | 178 |
0.115 (1.00) |
0.313 (1.00) |
0.0843 (1.00) |
0.0853 (1.00) |
0.308 (1.00) |
0.769 (1.00) |
0.122 (1.00) |
0.806 (1.00) |
0.448 (1.00) |
0.593 (1.00) |
|
| 1q loss | 13 (7%) | 185 |
0.6 (1.00) |
0.265 (1.00) |
0.288 (1.00) |
0.603 (1.00) |
0.724 (1.00) |
0.473 (1.00) |
0.208 (1.00) |
0.812 (1.00) |
0.401 (1.00) |
0.538 (1.00) |
|
| 6p loss | 15 (8%) | 183 |
0.147 (1.00) |
0.328 (1.00) |
0.0236 (1.00) |
0.0405 (1.00) |
0.0508 (1.00) |
0.611 (1.00) |
0.144 (1.00) |
0.753 (1.00) |
0.0438 (1.00) |
1 (1.00) |
|
| 6q loss | 18 (9%) | 180 |
0.697 (1.00) |
0.836 (1.00) |
0.0358 (1.00) |
0.00166 (1.00) |
0.117 (1.00) |
0.303 (1.00) |
0.0148 (1.00) |
0.469 (1.00) |
0.392 (1.00) |
0.0214 (1.00) |
1 (1.00) |
| 8p loss | 10 (5%) | 188 |
0.000536 (0.342) |
0.303 (1.00) |
0.0281 (1.00) |
0.438 (1.00) |
0.00672 (1.00) |
0.00806 (1.00) |
0.161 (1.00) |
0.748 (1.00) |
0.019 (1.00) |
1 (1.00) |
|
| 10p loss | 12 (6%) | 186 |
0.00691 (1.00) |
0.994 (1.00) |
0.00125 (0.785) |
0.00365 (1.00) |
0.0685 (1.00) |
0.0386 (1.00) |
0.114 (1.00) |
0.241 (1.00) |
0.826 (1.00) |
1 (1.00) |
|
| 10q loss | 12 (6%) | 186 |
0.0041 (1.00) |
0.373 (1.00) |
0.00058 (0.369) |
0.00089 (0.562) |
0.0282 (1.00) |
0.126 (1.00) |
0.114 (1.00) |
0.0757 (1.00) |
0.398 (1.00) |
1 (1.00) |
|
| 14q loss | 36 (18%) | 162 |
0.00312 (1.00) |
0.832 (1.00) |
0.00249 (1.00) |
0.00207 (1.00) |
0.0455 (1.00) |
0.135 (1.00) |
0.0042 (1.00) |
0.0943 (1.00) |
0.213 (1.00) |
0.953 (1.00) |
1 (1.00) |
| 16p loss | 4 (2%) | 194 |
0.672 (1.00) |
0.133 (1.00) |
0.0934 (1.00) |
1 (1.00) |
0.0764 (1.00) |
1 (1.00) |
|||||
| 21q loss | 32 (16%) | 166 |
0.295 (1.00) |
0.503 (1.00) |
0.00882 (1.00) |
0.00467 (1.00) |
0.646 (1.00) |
0.21 (1.00) |
0.058 (1.00) |
0.105 (1.00) |
0.456 (1.00) |
0.482 (1.00) |
1 (1.00) |
P value = 1.25e-11 (logrank test), Q value = 8.6e-09
Table S1. Gene #1: '1p gain' versus Clinical Feature #1: 'Time to Death'
| nPatients | nDeath | Duration Range (Median), Year | |
|---|---|---|---|
| ALL | 173 | 7 | 2.0 - 5925.0 (508.0) |
| 1P GAIN MUTATED | 4 | 1 | 26.0 - 112.0 (74.5) |
| 1P GAIN WILD-TYPE | 169 | 6 | 2.0 - 5925.0 (511.0) |
Figure S1. Get High-res Image Gene #1: '1p gain' versus Clinical Feature #1: 'Time to Death'
P value = 6.77e-08 (logrank test), Q value = 4.6e-05
Table S2. Gene #2: '1q gain' versus Clinical Feature #1: 'Time to Death'
| nPatients | nDeath | Duration Range (Median), Year | |
|---|---|---|---|
| ALL | 173 | 7 | 2.0 - 5925.0 (508.0) |
| 1Q GAIN MUTATED | 12 | 3 | 21.0 - 1967.0 (99.5) |
| 1Q GAIN WILD-TYPE | 161 | 4 | 2.0 - 5925.0 (516.0) |
Figure S2. Get High-res Image Gene #2: '1q gain' versus Clinical Feature #1: 'Time to Death'

P value = 1e-05 (Fisher's exact test), Q value = 0.0068
Table S3. Gene #2: '1q gain' versus Clinical Feature #3: 'NEOPLASM.DISEASESTAGE'
| nPatients | STAGE I | STAGE II | STAGE III | STAGE IV |
|---|---|---|---|---|
| ALL | 122 | 11 | 42 | 12 |
| 1Q GAIN MUTATED | 1 | 0 | 11 | 3 |
| 1Q GAIN WILD-TYPE | 121 | 11 | 31 | 9 |
Figure S3. Get High-res Image Gene #2: '1q gain' versus Clinical Feature #3: 'NEOPLASM.DISEASESTAGE'
P value = 1e-05 (Fisher's exact test), Q value = 0.0068
Table S4. Gene #2: '1q gain' versus Clinical Feature #4: 'PATHOLOGY.T.STAGE'
| nPatients | T1 | T2 | T3+T4 |
|---|---|---|---|
| ALL | 130 | 18 | 50 |
| 1Q GAIN MUTATED | 2 | 0 | 13 |
| 1Q GAIN WILD-TYPE | 128 | 18 | 37 |
Figure S4. Get High-res Image Gene #2: '1q gain' versus Clinical Feature #4: 'PATHOLOGY.T.STAGE'
P value = 0.00024 (Fisher's exact test), Q value = 0.16
Table S5. Gene #14: '7q gain' versus Clinical Feature #3: 'NEOPLASM.DISEASESTAGE'
| nPatients | STAGE I | STAGE II | STAGE III | STAGE IV |
|---|---|---|---|---|
| ALL | 122 | 11 | 42 | 12 |
| 7Q GAIN MUTATED | 86 | 4 | 15 | 8 |
| 7Q GAIN WILD-TYPE | 36 | 7 | 27 | 4 |
Figure S5. Get High-res Image Gene #14: '7q gain' versus Clinical Feature #3: 'NEOPLASM.DISEASESTAGE'
P value = 3e-05 (Fisher's exact test), Q value = 0.02
Table S6. Gene #29: '17p gain' versus Clinical Feature #3: 'NEOPLASM.DISEASESTAGE'
| nPatients | STAGE I | STAGE II | STAGE III | STAGE IV |
|---|---|---|---|---|
| ALL | 122 | 11 | 42 | 12 |
| 17P GAIN MUTATED | 88 | 6 | 15 | 3 |
| 17P GAIN WILD-TYPE | 34 | 5 | 27 | 9 |
Figure S6. Get High-res Image Gene #29: '17p gain' versus Clinical Feature #3: 'NEOPLASM.DISEASESTAGE'
P value = 0.00024 (Fisher's exact test), Q value = 0.16
Table S7. Gene #29: '17p gain' versus Clinical Feature #6: 'PATHOLOGY.M.STAGE'
| nPatients | M0 | M1 | MX |
|---|---|---|---|
| ALL | 81 | 8 | 96 |
| 17P GAIN MUTATED | 38 | 2 | 70 |
| 17P GAIN WILD-TYPE | 43 | 6 | 26 |
Figure S7. Get High-res Image Gene #29: '17p gain' versus Clinical Feature #6: 'PATHOLOGY.M.STAGE'

P value = 1.11e-05 (logrank test), Q value = 0.0074
Table S8. Gene #41: '3p loss' versus Clinical Feature #1: 'Time to Death'
| nPatients | nDeath | Duration Range (Median), Year | |
|---|---|---|---|
| ALL | 173 | 7 | 2.0 - 5925.0 (508.0) |
| 3P LOSS MUTATED | 13 | 3 | 4.0 - 2429.0 (112.0) |
| 3P LOSS WILD-TYPE | 160 | 4 | 2.0 - 5925.0 (542.0) |
Figure S8. Get High-res Image Gene #41: '3p loss' versus Clinical Feature #1: 'Time to Death'
P value = 5e-05 (Fisher's exact test), Q value = 0.033
Table S9. Gene #41: '3p loss' versus Clinical Feature #3: 'NEOPLASM.DISEASESTAGE'
| nPatients | STAGE I | STAGE II | STAGE III | STAGE IV |
|---|---|---|---|---|
| ALL | 122 | 11 | 42 | 12 |
| 3P LOSS MUTATED | 2 | 1 | 9 | 3 |
| 3P LOSS WILD-TYPE | 120 | 10 | 33 | 9 |
Figure S9. Get High-res Image Gene #41: '3p loss' versus Clinical Feature #3: 'NEOPLASM.DISEASESTAGE'

P value = 0.00033 (Fisher's exact test), Q value = 0.21
Table S10. Gene #41: '3p loss' versus Clinical Feature #4: 'PATHOLOGY.T.STAGE'
| nPatients | T1 | T2 | T3+T4 |
|---|---|---|---|
| ALL | 130 | 18 | 50 |
| 3P LOSS MUTATED | 3 | 2 | 10 |
| 3P LOSS WILD-TYPE | 127 | 16 | 40 |
Figure S10. Get High-res Image Gene #41: '3p loss' versus Clinical Feature #4: 'PATHOLOGY.T.STAGE'
P value = 8.02e-14 (logrank test), Q value = 5.5e-11
Table S11. Gene #42: '3q loss' versus Clinical Feature #1: 'Time to Death'
| nPatients | nDeath | Duration Range (Median), Year | |
|---|---|---|---|
| ALL | 173 | 7 | 2.0 - 5925.0 (508.0) |
| 3Q LOSS MUTATED | 3 | 2 | 112.0 - 270.0 (208.0) |
| 3Q LOSS WILD-TYPE | 170 | 5 | 2.0 - 5925.0 (510.5) |
Figure S11. Get High-res Image Gene #42: '3q loss' versus Clinical Feature #1: 'Time to Death'
P value = 1e-05 (Fisher's exact test), Q value = 0.0068
Table S12. Gene #43: '4p loss' versus Clinical Feature #3: 'NEOPLASM.DISEASESTAGE'
| nPatients | STAGE I | STAGE II | STAGE III | STAGE IV |
|---|---|---|---|---|
| ALL | 122 | 11 | 42 | 12 |
| 4P LOSS MUTATED | 3 | 1 | 14 | 1 |
| 4P LOSS WILD-TYPE | 119 | 10 | 28 | 11 |
Figure S12. Get High-res Image Gene #43: '4p loss' versus Clinical Feature #3: 'NEOPLASM.DISEASESTAGE'
P value = 1e-05 (Fisher's exact test), Q value = 0.0068
Table S13. Gene #43: '4p loss' versus Clinical Feature #4: 'PATHOLOGY.T.STAGE'
| nPatients | T1 | T2 | T3+T4 |
|---|---|---|---|
| ALL | 130 | 18 | 50 |
| 4P LOSS MUTATED | 3 | 2 | 14 |
| 4P LOSS WILD-TYPE | 127 | 16 | 36 |
Figure S13. Get High-res Image Gene #43: '4p loss' versus Clinical Feature #4: 'PATHOLOGY.T.STAGE'

P value = 3.24e-05 (Fisher's exact test), Q value = 0.021
Table S14. Gene #43: '4p loss' versus Clinical Feature #7: 'GENDER'
| nPatients | FEMALE | MALE |
|---|---|---|
| ALL | 58 | 140 |
| 4P LOSS MUTATED | 14 | 5 |
| 4P LOSS WILD-TYPE | 44 | 135 |
Figure S14. Get High-res Image Gene #43: '4p loss' versus Clinical Feature #7: 'GENDER'

P value = 4e-05 (Fisher's exact test), Q value = 0.026
Table S15. Gene #44: '4q loss' versus Clinical Feature #3: 'NEOPLASM.DISEASESTAGE'
| nPatients | STAGE I | STAGE II | STAGE III | STAGE IV |
|---|---|---|---|---|
| ALL | 122 | 11 | 42 | 12 |
| 4Q LOSS MUTATED | 4 | 1 | 13 | 2 |
| 4Q LOSS WILD-TYPE | 118 | 10 | 29 | 10 |
Figure S15. Get High-res Image Gene #44: '4q loss' versus Clinical Feature #3: 'NEOPLASM.DISEASESTAGE'

P value = 3e-05 (Fisher's exact test), Q value = 0.02
Table S16. Gene #44: '4q loss' versus Clinical Feature #4: 'PATHOLOGY.T.STAGE'
| nPatients | T1 | T2 | T3+T4 |
|---|---|---|---|
| ALL | 130 | 18 | 50 |
| 4Q LOSS MUTATED | 4 | 3 | 13 |
| 4Q LOSS WILD-TYPE | 126 | 15 | 37 |
Figure S16. Get High-res Image Gene #44: '4q loss' versus Clinical Feature #4: 'PATHOLOGY.T.STAGE'
P value = 6.91e-06 (logrank test), Q value = 0.0047
Table S17. Gene #45: '5p loss' versus Clinical Feature #1: 'Time to Death'
| nPatients | nDeath | Duration Range (Median), Year | |
|---|---|---|---|
| ALL | 173 | 7 | 2.0 - 5925.0 (508.0) |
| 5P LOSS MUTATED | 4 | 1 | 21.0 - 554.0 (90.5) |
| 5P LOSS WILD-TYPE | 169 | 6 | 2.0 - 5925.0 (510.0) |
Figure S17. Get High-res Image Gene #45: '5p loss' versus Clinical Feature #1: 'Time to Death'
P value = 0.000104 (logrank test), Q value = 0.068
Table S18. Gene #46: '5q loss' versus Clinical Feature #1: 'Time to Death'
| nPatients | nDeath | Duration Range (Median), Year | |
|---|---|---|---|
| ALL | 173 | 7 | 2.0 - 5925.0 (508.0) |
| 5Q LOSS MUTATED | 5 | 1 | 21.0 - 554.0 (97.0) |
| 5Q LOSS WILD-TYPE | 168 | 6 | 2.0 - 5925.0 (510.5) |
Figure S18. Get High-res Image Gene #46: '5q loss' versus Clinical Feature #1: 'Time to Death'

P value = 0.000126 (logrank test), Q value = 0.082
Table S19. Gene #50: '8q loss' versus Clinical Feature #1: 'Time to Death'
| nPatients | nDeath | Duration Range (Median), Year | |
|---|---|---|---|
| ALL | 173 | 7 | 2.0 - 5925.0 (508.0) |
| 8Q LOSS MUTATED | 4 | 1 | 10.0 - 307.0 (155.0) |
| 8Q LOSS WILD-TYPE | 169 | 6 | 2.0 - 5925.0 (511.0) |
Figure S19. Get High-res Image Gene #50: '8q loss' versus Clinical Feature #1: 'Time to Death'

P value = 1e-05 (Fisher's exact test), Q value = 0.0068
Table S20. Gene #51: '9p loss' versus Clinical Feature #3: 'NEOPLASM.DISEASESTAGE'
| nPatients | STAGE I | STAGE II | STAGE III | STAGE IV |
|---|---|---|---|---|
| ALL | 122 | 11 | 42 | 12 |
| 9P LOSS MUTATED | 5 | 0 | 13 | 5 |
| 9P LOSS WILD-TYPE | 117 | 11 | 29 | 7 |
Figure S20. Get High-res Image Gene #51: '9p loss' versus Clinical Feature #3: 'NEOPLASM.DISEASESTAGE'

P value = 1e-05 (Fisher's exact test), Q value = 0.0068
Table S21. Gene #51: '9p loss' versus Clinical Feature #4: 'PATHOLOGY.T.STAGE'
| nPatients | T1 | T2 | T3+T4 |
|---|---|---|---|
| ALL | 130 | 18 | 50 |
| 9P LOSS MUTATED | 6 | 2 | 17 |
| 9P LOSS WILD-TYPE | 124 | 16 | 33 |
Figure S21. Get High-res Image Gene #51: '9p loss' versus Clinical Feature #4: 'PATHOLOGY.T.STAGE'
P value = 3e-05 (Fisher's exact test), Q value = 0.02
Table S22. Gene #52: '9q loss' versus Clinical Feature #3: 'NEOPLASM.DISEASESTAGE'
| nPatients | STAGE I | STAGE II | STAGE III | STAGE IV |
|---|---|---|---|---|
| ALL | 122 | 11 | 42 | 12 |
| 9Q LOSS MUTATED | 6 | 1 | 14 | 4 |
| 9Q LOSS WILD-TYPE | 116 | 10 | 28 | 8 |
Figure S22. Get High-res Image Gene #52: '9q loss' versus Clinical Feature #3: 'NEOPLASM.DISEASESTAGE'

P value = 1e-05 (Fisher's exact test), Q value = 0.0068
Table S23. Gene #52: '9q loss' versus Clinical Feature #4: 'PATHOLOGY.T.STAGE'
| nPatients | T1 | T2 | T3+T4 |
|---|---|---|---|
| ALL | 130 | 18 | 50 |
| 9Q LOSS MUTATED | 7 | 1 | 18 |
| 9Q LOSS WILD-TYPE | 123 | 17 | 32 |
Figure S23. Get High-res Image Gene #52: '9q loss' versus Clinical Feature #4: 'PATHOLOGY.T.STAGE'

P value = 1.37e-06 (logrank test), Q value = 0.00093
Table S24. Gene #55: '11p loss' versus Clinical Feature #1: 'Time to Death'
| nPatients | nDeath | Duration Range (Median), Year | |
|---|---|---|---|
| ALL | 173 | 7 | 2.0 - 5925.0 (508.0) |
| 11P LOSS MUTATED | 10 | 3 | 21.0 - 1967.0 (246.5) |
| 11P LOSS WILD-TYPE | 163 | 4 | 2.0 - 5925.0 (510.0) |
Figure S24. Get High-res Image Gene #55: '11p loss' versus Clinical Feature #1: 'Time to Death'

P value = 2e-05 (Fisher's exact test), Q value = 0.013
Table S25. Gene #56: '11q loss' versus Clinical Feature #3: 'NEOPLASM.DISEASESTAGE'
| nPatients | STAGE I | STAGE II | STAGE III | STAGE IV |
|---|---|---|---|---|
| ALL | 122 | 11 | 42 | 12 |
| 11Q LOSS MUTATED | 2 | 1 | 8 | 4 |
| 11Q LOSS WILD-TYPE | 120 | 10 | 34 | 8 |
Figure S25. Get High-res Image Gene #56: '11q loss' versus Clinical Feature #3: 'NEOPLASM.DISEASESTAGE'
P value = 3e-05 (Fisher's exact test), Q value = 0.02
Table S26. Gene #56: '11q loss' versus Clinical Feature #4: 'PATHOLOGY.T.STAGE'
| nPatients | T1 | T2 | T3+T4 |
|---|---|---|---|
| ALL | 130 | 18 | 50 |
| 11Q LOSS MUTATED | 2 | 1 | 12 |
| 11Q LOSS WILD-TYPE | 128 | 17 | 38 |
Figure S26. Get High-res Image Gene #56: '11q loss' versus Clinical Feature #4: 'PATHOLOGY.T.STAGE'
P value = 0.000105 (logrank test), Q value = 0.068
Table S27. Gene #57: '13q loss' versus Clinical Feature #1: 'Time to Death'
| nPatients | nDeath | Duration Range (Median), Year | |
|---|---|---|---|
| ALL | 173 | 7 | 2.0 - 5925.0 (508.0) |
| 13Q LOSS MUTATED | 16 | 3 | 4.0 - 2639.0 (84.5) |
| 13Q LOSS WILD-TYPE | 157 | 4 | 2.0 - 5925.0 (543.0) |
Figure S27. Get High-res Image Gene #57: '13q loss' versus Clinical Feature #1: 'Time to Death'

P value = 2e-04 (Fisher's exact test), Q value = 0.13
Table S28. Gene #57: '13q loss' versus Clinical Feature #3: 'NEOPLASM.DISEASESTAGE'
| nPatients | STAGE I | STAGE II | STAGE III | STAGE IV |
|---|---|---|---|---|
| ALL | 122 | 11 | 42 | 12 |
| 13Q LOSS MUTATED | 5 | 1 | 11 | 3 |
| 13Q LOSS WILD-TYPE | 117 | 10 | 31 | 9 |
Figure S28. Get High-res Image Gene #57: '13q loss' versus Clinical Feature #3: 'NEOPLASM.DISEASESTAGE'
P value = 0.00013 (Fisher's exact test), Q value = 0.085
Table S29. Gene #57: '13q loss' versus Clinical Feature #4: 'PATHOLOGY.T.STAGE'
| nPatients | T1 | T2 | T3+T4 |
|---|---|---|---|
| ALL | 130 | 18 | 50 |
| 13Q LOSS MUTATED | 5 | 2 | 13 |
| 13Q LOSS WILD-TYPE | 125 | 16 | 37 |
Figure S29. Get High-res Image Gene #57: '13q loss' versus Clinical Feature #4: 'PATHOLOGY.T.STAGE'

P value = 8.34e-05 (Fisher's exact test), Q value = 0.055
Table S30. Gene #57: '13q loss' versus Clinical Feature #7: 'GENDER'
| nPatients | FEMALE | MALE |
|---|---|---|
| ALL | 58 | 140 |
| 13Q LOSS MUTATED | 14 | 6 |
| 13Q LOSS WILD-TYPE | 44 | 134 |
Figure S30. Get High-res Image Gene #57: '13q loss' versus Clinical Feature #7: 'GENDER'
P value = 0.000181 (logrank test), Q value = 0.12
Table S31. Gene #59: '15q loss' versus Clinical Feature #1: 'Time to Death'
| nPatients | nDeath | Duration Range (Median), Year | |
|---|---|---|---|
| ALL | 173 | 7 | 2.0 - 5925.0 (508.0) |
| 15Q LOSS MUTATED | 16 | 3 | 3.0 - 5925.0 (207.5) |
| 15Q LOSS WILD-TYPE | 157 | 4 | 2.0 - 3950.0 (516.0) |
Figure S31. Get High-res Image Gene #59: '15q loss' versus Clinical Feature #1: 'Time to Death'
P value = 7.46e-07 (logrank test), Q value = 0.00051
Table S32. Gene #61: '16q loss' versus Clinical Feature #1: 'Time to Death'
| nPatients | nDeath | Duration Range (Median), Year | |
|---|---|---|---|
| ALL | 173 | 7 | 2.0 - 5925.0 (508.0) |
| 16Q LOSS MUTATED | 3 | 2 | 21.0 - 1967.0 (87.0) |
| 16Q LOSS WILD-TYPE | 170 | 5 | 2.0 - 5925.0 (509.0) |
Figure S32. Get High-res Image Gene #61: '16q loss' versus Clinical Feature #1: 'Time to Death'

P value = 6.34e-11 (logrank test), Q value = 4.3e-08
Table S33. Gene #62: '17p loss' versus Clinical Feature #1: 'Time to Death'
| nPatients | nDeath | Duration Range (Median), Year | |
|---|---|---|---|
| ALL | 173 | 7 | 2.0 - 5925.0 (508.0) |
| 17P LOSS MUTATED | 4 | 1 | 7.0 - 208.0 (39.0) |
| 17P LOSS WILD-TYPE | 169 | 6 | 2.0 - 5925.0 (511.0) |
Figure S33. Get High-res Image Gene #62: '17p loss' versus Clinical Feature #1: 'Time to Death'

P value = 0.00019 (Fisher's exact test), Q value = 0.12
Table S34. Gene #62: '17p loss' versus Clinical Feature #3: 'NEOPLASM.DISEASESTAGE'
| nPatients | STAGE I | STAGE II | STAGE III | STAGE IV |
|---|---|---|---|---|
| ALL | 122 | 11 | 42 | 12 |
| 17P LOSS MUTATED | 1 | 1 | 3 | 4 |
| 17P LOSS WILD-TYPE | 121 | 10 | 39 | 8 |
Figure S34. Get High-res Image Gene #62: '17p loss' versus Clinical Feature #3: 'NEOPLASM.DISEASESTAGE'

P value = 3e-05 (Fisher's exact test), Q value = 0.02
Table S35. Gene #63: '18p loss' versus Clinical Feature #3: 'NEOPLASM.DISEASESTAGE'
| nPatients | STAGE I | STAGE II | STAGE III | STAGE IV |
|---|---|---|---|---|
| ALL | 122 | 11 | 42 | 12 |
| 18P LOSS MUTATED | 9 | 1 | 15 | 5 |
| 18P LOSS WILD-TYPE | 113 | 10 | 27 | 7 |
Figure S35. Get High-res Image Gene #63: '18p loss' versus Clinical Feature #3: 'NEOPLASM.DISEASESTAGE'
P value = 1e-05 (Fisher's exact test), Q value = 0.0068
Table S36. Gene #63: '18p loss' versus Clinical Feature #4: 'PATHOLOGY.T.STAGE'
| nPatients | T1 | T2 | T3+T4 |
|---|---|---|---|
| ALL | 130 | 18 | 50 |
| 18P LOSS MUTATED | 9 | 3 | 20 |
| 18P LOSS WILD-TYPE | 121 | 15 | 30 |
Figure S36. Get High-res Image Gene #63: '18p loss' versus Clinical Feature #4: 'PATHOLOGY.T.STAGE'
P value = 8.33e-07 (logrank test), Q value = 0.00057
Table S37. Gene #64: '18q loss' versus Clinical Feature #1: 'Time to Death'
| nPatients | nDeath | Duration Range (Median), Year | |
|---|---|---|---|
| ALL | 173 | 7 | 2.0 - 5925.0 (508.0) |
| 18Q LOSS MUTATED | 27 | 6 | 4.0 - 3760.0 (232.0) |
| 18Q LOSS WILD-TYPE | 146 | 1 | 2.0 - 5925.0 (528.5) |
Figure S37. Get High-res Image Gene #64: '18q loss' versus Clinical Feature #1: 'Time to Death'

P value = 2e-05 (Fisher's exact test), Q value = 0.013
Table S38. Gene #64: '18q loss' versus Clinical Feature #3: 'NEOPLASM.DISEASESTAGE'
| nPatients | STAGE I | STAGE II | STAGE III | STAGE IV |
|---|---|---|---|---|
| ALL | 122 | 11 | 42 | 12 |
| 18Q LOSS MUTATED | 9 | 1 | 16 | 5 |
| 18Q LOSS WILD-TYPE | 113 | 10 | 26 | 7 |
Figure S38. Get High-res Image Gene #64: '18q loss' versus Clinical Feature #3: 'NEOPLASM.DISEASESTAGE'

P value = 3e-05 (Fisher's exact test), Q value = 0.02
Table S39. Gene #64: '18q loss' versus Clinical Feature #4: 'PATHOLOGY.T.STAGE'
| nPatients | T1 | T2 | T3+T4 |
|---|---|---|---|
| ALL | 130 | 18 | 50 |
| 18Q LOSS MUTATED | 10 | 3 | 20 |
| 18Q LOSS WILD-TYPE | 120 | 15 | 30 |
Figure S39. Get High-res Image Gene #64: '18q loss' versus Clinical Feature #4: 'PATHOLOGY.T.STAGE'

P value = 0.000385 (logrank test), Q value = 0.25
Table S40. Gene #65: '19p loss' versus Clinical Feature #1: 'Time to Death'
| nPatients | nDeath | Duration Range (Median), Year | |
|---|---|---|---|
| ALL | 173 | 7 | 2.0 - 5925.0 (508.0) |
| 19P LOSS MUTATED | 13 | 3 | 29.0 - 2584.0 (223.0) |
| 19P LOSS WILD-TYPE | 160 | 4 | 2.0 - 5925.0 (509.0) |
Figure S40. Get High-res Image Gene #65: '19p loss' versus Clinical Feature #1: 'Time to Death'
P value = 4.13e-12 (logrank test), Q value = 2.8e-09
Table S41. Gene #66: '19q loss' versus Clinical Feature #1: 'Time to Death'
| nPatients | nDeath | Duration Range (Median), Year | |
|---|---|---|---|
| ALL | 173 | 7 | 2.0 - 5925.0 (508.0) |
| 19Q LOSS MUTATED | 12 | 4 | 29.0 - 1967.0 (152.5) |
| 19Q LOSS WILD-TYPE | 161 | 3 | 2.0 - 5925.0 (511.0) |
Figure S41. Get High-res Image Gene #66: '19q loss' versus Clinical Feature #1: 'Time to Death'
P value = 0.00019 (Fisher's exact test), Q value = 0.12
Table S42. Gene #66: '19q loss' versus Clinical Feature #3: 'NEOPLASM.DISEASESTAGE'
| nPatients | STAGE I | STAGE II | STAGE III | STAGE IV |
|---|---|---|---|---|
| ALL | 122 | 11 | 42 | 12 |
| 19Q LOSS MUTATED | 1 | 1 | 8 | 1 |
| 19Q LOSS WILD-TYPE | 121 | 10 | 34 | 11 |
Figure S42. Get High-res Image Gene #66: '19q loss' versus Clinical Feature #3: 'NEOPLASM.DISEASESTAGE'

P value = 0.00032 (Fisher's exact test), Q value = 0.21
Table S43. Gene #66: '19q loss' versus Clinical Feature #4: 'PATHOLOGY.T.STAGE'
| nPatients | T1 | T2 | T3+T4 |
|---|---|---|---|
| ALL | 130 | 18 | 50 |
| 19Q LOSS MUTATED | 2 | 1 | 9 |
| 19Q LOSS WILD-TYPE | 128 | 17 | 41 |
Figure S43. Get High-res Image Gene #66: '19q loss' versus Clinical Feature #4: 'PATHOLOGY.T.STAGE'

P value = 1e-05 (Fisher's exact test), Q value = 0.0068
Table S44. Gene #68: '22q loss' versus Clinical Feature #3: 'NEOPLASM.DISEASESTAGE'
| nPatients | STAGE I | STAGE II | STAGE III | STAGE IV |
|---|---|---|---|---|
| ALL | 122 | 11 | 42 | 12 |
| 22Q LOSS MUTATED | 14 | 3 | 21 | 7 |
| 22Q LOSS WILD-TYPE | 108 | 8 | 21 | 5 |
Figure S44. Get High-res Image Gene #68: '22q loss' versus Clinical Feature #3: 'NEOPLASM.DISEASESTAGE'

P value = 1e-05 (Fisher's exact test), Q value = 0.0068
Table S45. Gene #68: '22q loss' versus Clinical Feature #4: 'PATHOLOGY.T.STAGE'
| nPatients | T1 | T2 | T3+T4 |
|---|---|---|---|
| ALL | 130 | 18 | 50 |
| 22Q LOSS MUTATED | 17 | 3 | 27 |
| 22Q LOSS WILD-TYPE | 113 | 15 | 23 |
Figure S45. Get High-res Image Gene #68: '22q loss' versus Clinical Feature #4: 'PATHOLOGY.T.STAGE'

P value = 5.9e-06 (logrank test), Q value = 0.004
Table S46. Gene #69: 'xq loss' versus Clinical Feature #1: 'Time to Death'
| nPatients | nDeath | Duration Range (Median), Year | |
|---|---|---|---|
| ALL | 173 | 7 | 2.0 - 5925.0 (508.0) |
| XQ LOSS MUTATED | 16 | 4 | 4.0 - 2429.0 (288.5) |
| XQ LOSS WILD-TYPE | 157 | 3 | 2.0 - 5925.0 (541.0) |
Figure S46. Get High-res Image Gene #69: 'xq loss' versus Clinical Feature #1: 'Time to Death'
P value = 0.00024 (Fisher's exact test), Q value = 0.16
Table S47. Gene #69: 'xq loss' versus Clinical Feature #4: 'PATHOLOGY.T.STAGE'
| nPatients | T1 | T2 | T3+T4 |
|---|---|---|---|
| ALL | 130 | 18 | 50 |
| XQ LOSS MUTATED | 6 | 1 | 13 |
| XQ LOSS WILD-TYPE | 124 | 17 | 37 |
Figure S47. Get High-res Image Gene #69: 'xq loss' versus Clinical Feature #4: 'PATHOLOGY.T.STAGE'
-
Copy number data file = transformed.cor.cli.txt
-
Clinical data file = KIRP-TP.merged_data.txt
-
Number of patients = 198
-
Number of significantly arm-level cnvs = 69
-
Number of selected clinical features = 11
-
Exclude regions that fewer than K tumors have mutations, K = 3
For survival clinical features, the Kaplan-Meier survival curves of tumors with and without gene mutations were plotted and the statistical significance P values were estimated by logrank test (Bland and Altman 2004) using the 'survdiff' function in R
For binary or multi-class clinical features (nominal or ordinal), two-tailed Fisher's exact tests (Fisher 1922) were used to estimate the P values using the 'fisher.test' function in R
For multiple hypothesis correction, Q value is the False Discovery Rate (FDR) analogue of the P value (Benjamini and Hochberg 1995), defined as the minimum FDR at which the test may be called significant. We used the 'Benjamini and Hochberg' method of 'p.adjust' function in R to convert P values into Q values.
In addition to the links below, the full results of the analysis summarized in this report can also be downloaded programmatically using firehose_get, or interactively from either the Broad GDAC website or TCGA Data Coordination Center Portal.