This pipeline computes the correlation between significant arm-level copy number variations (cnvs) and selected clinical features.
Testing the association between copy number variation 80 arm-level events and 8 clinical features across 562 patients, 12 significant findings detected with Q value < 0.25.
-
2p gain cnv correlated to 'AGE'.
-
3q gain cnv correlated to 'AGE'.
-
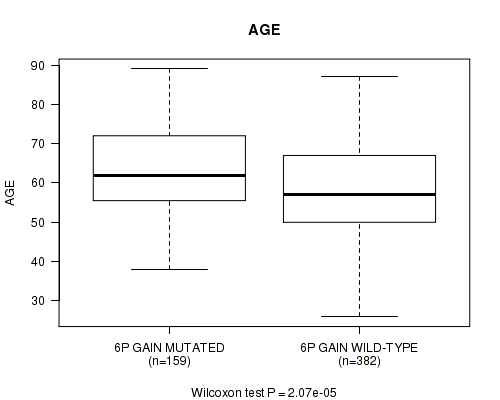
6p gain cnv correlated to 'AGE'.
-
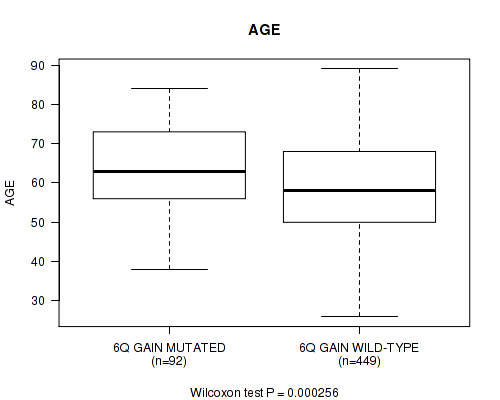
6q gain cnv correlated to 'AGE'.
-
10p gain cnv correlated to 'AGE'.
-
12p gain cnv correlated to 'AGE'.
-
12q gain cnv correlated to 'AGE'.
-
20p gain cnv correlated to 'AGE'.
-
20q gain cnv correlated to 'AGE'.
-
9q loss cnv correlated to 'AGE'.
-
15q loss cnv correlated to 'AGE'.
-
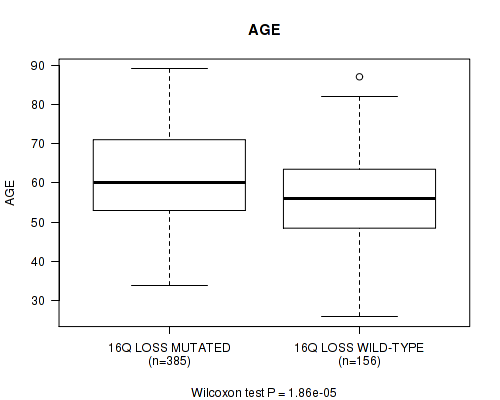
16q loss cnv correlated to 'AGE'.
Table 1. Get Full Table Overview of the association between significant copy number variation of 80 arm-level events and 8 clinical features. Shown in the table are P values (Q values). Thresholded by Q value < 0.25, 12 significant findings detected.
|
Clinical Features |
Time to Death |
AGE |
PRIMARY SITE OF DISEASE |
KARNOFSKY PERFORMANCE SCORE |
RADIATIONS RADIATION REGIMENINDICATION |
COMPLETENESS OF RESECTION |
RACE | ETHNICITY | ||
| nCNV (%) | nWild-Type | logrank test | Wilcoxon-test | Fisher's exact test | Wilcoxon-test | Fisher's exact test | Fisher's exact test | Fisher's exact test | Fisher's exact test | |
| 2p gain | 176 (31%) | 386 |
0.117 (1.00) |
9.38e-06 (0.00587) |
1 (1.00) |
0.524 (1.00) |
1 (1.00) |
0.837 (1.00) |
0.769 (1.00) |
1 (1.00) |
| 3q gain | 265 (47%) | 297 |
0.557 (1.00) |
3.7e-08 (2.33e-05) |
0.175 (1.00) |
0.729 (1.00) |
0.251 (1.00) |
0.76 (1.00) |
0.485 (1.00) |
0.522 (1.00) |
| 6p gain | 163 (29%) | 399 |
0.299 (1.00) |
2.07e-05 (0.0129) |
0.747 (1.00) |
0.103 (1.00) |
0.56 (1.00) |
1 (1.00) |
0.197 (1.00) |
0.729 (1.00) |
| 6q gain | 96 (17%) | 466 |
0.432 (1.00) |
0.000256 (0.159) |
1 (1.00) |
0.187 (1.00) |
1 (1.00) |
0.74 (1.00) |
0.196 (1.00) |
0.676 (1.00) |
| 10p gain | 181 (32%) | 381 |
0.365 (1.00) |
3.57e-08 (2.25e-05) |
0.103 (1.00) |
0.389 (1.00) |
0.244 (1.00) |
0.663 (1.00) |
0.368 (1.00) |
0.509 (1.00) |
| 12p gain | 249 (44%) | 313 |
0.298 (1.00) |
8.2e-10 (5.17e-07) |
0.349 (1.00) |
0.042 (1.00) |
1 (1.00) |
0.574 (1.00) |
0.511 (1.00) |
0.326 (1.00) |
| 12q gain | 173 (31%) | 389 |
0.156 (1.00) |
6.64e-08 (4.17e-05) |
0.0857 (1.00) |
0.0137 (1.00) |
1 (1.00) |
0.663 (1.00) |
0.0195 (1.00) |
0.462 (1.00) |
| 20p gain | 280 (50%) | 282 |
0.0185 (1.00) |
1.29e-06 (0.000808) |
0.746 (1.00) |
0.141 (1.00) |
0.623 (1.00) |
0.869 (1.00) |
0.25 (1.00) |
0.752 (1.00) |
| 20q gain | 317 (56%) | 245 |
0.0591 (1.00) |
2.42e-05 (0.0151) |
0.757 (1.00) |
0.309 (1.00) |
1 (1.00) |
1 (1.00) |
0.019 (1.00) |
0.521 (1.00) |
| 9q loss | 280 (50%) | 282 |
0.403 (1.00) |
8.06e-07 (0.000506) |
0.493 (1.00) |
0.928 (1.00) |
0.623 (1.00) |
0.868 (1.00) |
0.504 (1.00) |
1 (1.00) |
| 15q loss | 272 (48%) | 290 |
0.406 (1.00) |
0.000214 (0.133) |
0.48 (1.00) |
0.777 (1.00) |
0.613 (1.00) |
0.752 (1.00) |
0.561 (1.00) |
0.525 (1.00) |
| 16q loss | 400 (71%) | 162 |
0.153 (1.00) |
1.86e-05 (0.0116) |
0.748 (1.00) |
0.187 (1.00) |
0.561 (1.00) |
0.664 (1.00) |
0.862 (1.00) |
0.159 (1.00) |
| 1p gain | 166 (30%) | 396 |
0.261 (1.00) |
0.0476 (1.00) |
0.339 (1.00) |
0.0778 (1.00) |
0.21 (1.00) |
0.297 (1.00) |
0.849 (1.00) |
0.462 (1.00) |
| 1q gain | 216 (38%) | 346 |
0.646 (1.00) |
0.000413 (0.256) |
0.265 (1.00) |
0.033 (1.00) |
1 (1.00) |
1 (1.00) |
0.671 (1.00) |
0.744 (1.00) |
| 2q gain | 148 (26%) | 414 |
0.115 (1.00) |
0.000947 (0.582) |
1 (1.00) |
0.871 (1.00) |
0.171 (1.00) |
1 (1.00) |
0.515 (1.00) |
0.704 (1.00) |
| 3p gain | 154 (27%) | 408 |
0.57 (1.00) |
0.000767 (0.473) |
0.723 (1.00) |
0.707 (1.00) |
0.565 (1.00) |
0.218 (1.00) |
0.239 (1.00) |
0.461 (1.00) |
| 4p gain | 57 (10%) | 505 |
0.0536 (1.00) |
0.0335 (1.00) |
0.348 (1.00) |
0.433 (1.00) |
0.275 (1.00) |
0.41 (1.00) |
0.293 (1.00) |
0.264 (1.00) |
| 4q gain | 32 (6%) | 530 |
0.243 (1.00) |
0.0721 (1.00) |
1 (1.00) |
0.481 (1.00) |
0.162 (1.00) |
0.584 (1.00) |
0.471 (1.00) |
|
| 5p gain | 193 (34%) | 369 |
0.432 (1.00) |
0.00242 (1.00) |
0.115 (1.00) |
0.243 (1.00) |
1 (1.00) |
0.0537 (1.00) |
0.418 (1.00) |
1 (1.00) |
| 5q gain | 59 (10%) | 503 |
0.909 (1.00) |
0.141 (1.00) |
0.355 (1.00) |
0.362 (1.00) |
1 (1.00) |
0.122 (1.00) |
0.899 (1.00) |
1 (1.00) |
| 7p gain | 178 (32%) | 384 |
0.955 (1.00) |
0.000493 (0.305) |
0.379 (1.00) |
0.0383 (1.00) |
0.555 (1.00) |
1 (1.00) |
0.0554 (1.00) |
0.175 (1.00) |
| 7q gain | 193 (34%) | 369 |
0.445 (1.00) |
0.00286 (1.00) |
0.798 (1.00) |
0.0479 (1.00) |
0.555 (1.00) |
0.573 (1.00) |
0.0145 (1.00) |
1 (1.00) |
| 8p gain | 116 (21%) | 446 |
0.778 (1.00) |
0.945 (1.00) |
0.608 (1.00) |
0.845 (1.00) |
0.501 (1.00) |
0.666 (1.00) |
0.507 (1.00) |
1 (1.00) |
| 8q gain | 236 (42%) | 326 |
0.36 (1.00) |
0.118 (1.00) |
0.329 (1.00) |
0.644 (1.00) |
1 (1.00) |
0.0732 (1.00) |
0.164 (1.00) |
0.527 (1.00) |
| 9p gain | 88 (16%) | 474 |
0.464 (1.00) |
0.835 (1.00) |
1 (1.00) |
0.22 (1.00) |
0.401 (1.00) |
1 (1.00) |
0.605 (1.00) |
0.37 (1.00) |
| 9q gain | 43 (8%) | 519 |
0.698 (1.00) |
0.221 (1.00) |
1 (1.00) |
0.496 (1.00) |
0.213 (1.00) |
1 (1.00) |
0.176 (1.00) |
1 (1.00) |
| 10q gain | 105 (19%) | 457 |
0.685 (1.00) |
0.00202 (1.00) |
0.163 (1.00) |
0.884 (1.00) |
1 (1.00) |
1 (1.00) |
0.548 (1.00) |
0.696 (1.00) |
| 11p gain | 75 (13%) | 487 |
0.116 (1.00) |
0.567 (1.00) |
1 (1.00) |
0.472 (1.00) |
0.35 (1.00) |
0.224 (1.00) |
1 (1.00) |
|
| 11q gain | 111 (20%) | 451 |
0.945 (1.00) |
0.953 (1.00) |
1 (1.00) |
0.317 (1.00) |
1 (1.00) |
0.578 (1.00) |
0.981 (1.00) |
0.219 (1.00) |
| 13q gain | 60 (11%) | 502 |
0.68 (1.00) |
0.00856 (1.00) |
1 (1.00) |
0.482 (1.00) |
0.288 (1.00) |
0.673 (1.00) |
0.64 (1.00) |
0.614 (1.00) |
| 14q gain | 57 (10%) | 505 |
0.0609 (1.00) |
0.266 (1.00) |
1 (1.00) |
0.771 (1.00) |
0.0284 (1.00) |
0.72 (1.00) |
0.897 (1.00) |
0.608 (1.00) |
| 15q gain | 38 (7%) | 524 |
0.169 (1.00) |
0.779 (1.00) |
1 (1.00) |
0.1 (1.00) |
1 (1.00) |
1 (1.00) |
1 (1.00) |
|
| 16p gain | 58 (10%) | 504 |
0.903 (1.00) |
0.256 (1.00) |
1 (1.00) |
0.0358 (1.00) |
1 (1.00) |
0.277 (1.00) |
0.9 (1.00) |
1 (1.00) |
| 16q gain | 30 (5%) | 532 |
0.817 (1.00) |
0.738 (1.00) |
1 (1.00) |
0.13 (1.00) |
1 (1.00) |
0.378 (1.00) |
1 (1.00) |
1 (1.00) |
| 17p gain | 22 (4%) | 540 |
0.17 (1.00) |
0.459 (1.00) |
1 (1.00) |
0.936 (1.00) |
1 (1.00) |
0.323 (1.00) |
1 (1.00) |
|
| 17q gain | 49 (9%) | 513 |
0.818 (1.00) |
0.457 (1.00) |
1 (1.00) |
0.433 (1.00) |
1 (1.00) |
0.00688 (1.00) |
0.294 (1.00) |
1 (1.00) |
| 18p gain | 117 (21%) | 445 |
0.147 (1.00) |
0.0425 (1.00) |
1 (1.00) |
0.692 (1.00) |
1 (1.00) |
0.813 (1.00) |
0.983 (1.00) |
1 (1.00) |
| 18q gain | 71 (13%) | 491 |
0.326 (1.00) |
0.479 (1.00) |
1 (1.00) |
0.704 (1.00) |
1 (1.00) |
0.723 (1.00) |
0.832 (1.00) |
0.617 (1.00) |
| 19p gain | 165 (29%) | 397 |
0.49 (1.00) |
0.0759 (1.00) |
0.75 (1.00) |
0.692 (1.00) |
1 (1.00) |
1 (1.00) |
0.378 (1.00) |
0.73 (1.00) |
| 19q gain | 159 (28%) | 403 |
0.65 (1.00) |
0.0125 (1.00) |
0.155 (1.00) |
0.762 (1.00) |
0.194 (1.00) |
0.857 (1.00) |
0.0465 (1.00) |
0.734 (1.00) |
| 21q gain | 109 (19%) | 453 |
0.999 (1.00) |
0.000941 (0.58) |
0.0721 (1.00) |
0.368 (1.00) |
1 (1.00) |
0.574 (1.00) |
0.903 (1.00) |
0.691 (1.00) |
| 22q gain | 25 (4%) | 537 |
0.0506 (1.00) |
0.646 (1.00) |
0.169 (1.00) |
0.426 (1.00) |
1 (1.00) |
1 (1.00) |
0.74 (1.00) |
1 (1.00) |
| xq gain | 104 (19%) | 458 |
0.663 (1.00) |
0.128 (1.00) |
0.0695 (1.00) |
0.784 (1.00) |
1 (1.00) |
1 (1.00) |
0.738 (1.00) |
1 (1.00) |
| 1p loss | 60 (11%) | 502 |
0.912 (1.00) |
0.347 (1.00) |
1 (1.00) |
0.314 (1.00) |
0.288 (1.00) |
1 (1.00) |
0.695 (1.00) |
0.276 (1.00) |
| 1q loss | 39 (7%) | 523 |
0.885 (1.00) |
0.504 (1.00) |
1 (1.00) |
0.459 (1.00) |
0.194 (1.00) |
0.479 (1.00) |
0.488 (1.00) |
|
| 2p loss | 53 (9%) | 509 |
0.928 (1.00) |
0.406 (1.00) |
1 (1.00) |
0.131 (1.00) |
1 (1.00) |
1 (1.00) |
0.607 (1.00) |
|
| 2q loss | 59 (10%) | 503 |
0.988 (1.00) |
0.0143 (1.00) |
0.36 (1.00) |
0.131 (1.00) |
1 (1.00) |
1 (1.00) |
0.768 (1.00) |
0.608 (1.00) |
| 3p loss | 93 (17%) | 469 |
0.995 (1.00) |
0.0152 (1.00) |
0.523 (1.00) |
0.485 (1.00) |
0.419 (1.00) |
0.0383 (1.00) |
0.555 (1.00) |
1 (1.00) |
| 3q loss | 41 (7%) | 521 |
0.378 (1.00) |
0.189 (1.00) |
0.264 (1.00) |
0.803 (1.00) |
0.204 (1.00) |
0.728 (1.00) |
0.536 (1.00) |
|
| 4p loss | 308 (55%) | 254 |
0.491 (1.00) |
0.967 (1.00) |
0.167 (1.00) |
0.155 (1.00) |
1 (1.00) |
0.66 (1.00) |
0.618 (1.00) |
1 (1.00) |
| 4q loss | 352 (63%) | 210 |
0.429 (1.00) |
0.741 (1.00) |
0.778 (1.00) |
0.842 (1.00) |
1 (1.00) |
0.644 (1.00) |
0.516 (1.00) |
0.326 (1.00) |
| 5p loss | 127 (23%) | 435 |
0.808 (1.00) |
0.0511 (1.00) |
0.645 (1.00) |
0.062 (1.00) |
1 (1.00) |
0.742 (1.00) |
0.64 (1.00) |
0.702 (1.00) |
| 5q loss | 216 (38%) | 346 |
0.433 (1.00) |
0.0251 (1.00) |
1 (1.00) |
0.172 (1.00) |
1 (1.00) |
0.778 (1.00) |
0.863 (1.00) |
0.522 (1.00) |
| 6p loss | 162 (29%) | 400 |
0.214 (1.00) |
0.0939 (1.00) |
0.745 (1.00) |
0.97 (1.00) |
1 (1.00) |
0.494 (1.00) |
0.51 (1.00) |
0.729 (1.00) |
| 6q loss | 235 (42%) | 327 |
0.667 (1.00) |
0.092 (1.00) |
0.149 (1.00) |
0.668 (1.00) |
1 (1.00) |
1 (1.00) |
0.0722 (1.00) |
0.523 (1.00) |
| 7p loss | 117 (21%) | 445 |
0.825 (1.00) |
0.907 (1.00) |
0.608 (1.00) |
0.0694 (1.00) |
1 (1.00) |
0.357 (1.00) |
0.708 (1.00) |
0.694 (1.00) |
| 7q loss | 81 (14%) | 481 |
0.29 (1.00) |
0.226 (1.00) |
0.47 (1.00) |
0.1 (1.00) |
0.374 (1.00) |
0.474 (1.00) |
0.319 (1.00) |
0.369 (1.00) |
| 8p loss | 267 (48%) | 295 |
0.159 (1.00) |
0.0262 (1.00) |
0.174 (1.00) |
0.0813 (1.00) |
1 (1.00) |
0.341 (1.00) |
0.919 (1.00) |
0.521 (1.00) |
| 8q loss | 87 (15%) | 475 |
0.0951 (1.00) |
0.00564 (1.00) |
1 (1.00) |
0.179 (1.00) |
1 (1.00) |
0.74 (1.00) |
0.747 (1.00) |
0.644 (1.00) |
| 9p loss | 255 (45%) | 307 |
0.809 (1.00) |
0.0133 (1.00) |
0.455 (1.00) |
0.281 (1.00) |
0.593 (1.00) |
0.381 (1.00) |
0.892 (1.00) |
0.523 (1.00) |
| 10p loss | 93 (17%) | 469 |
0.399 (1.00) |
0.149 (1.00) |
1 (1.00) |
0.886 (1.00) |
0.419 (1.00) |
0.621 (1.00) |
0.371 (1.00) |
1 (1.00) |
| 10q loss | 122 (22%) | 440 |
0.878 (1.00) |
0.0778 (1.00) |
0.62 (1.00) |
0.981 (1.00) |
0.01 (1.00) |
1 (1.00) |
0.511 (1.00) |
0.693 (1.00) |
| 11p loss | 191 (34%) | 371 |
0.976 (1.00) |
0.00386 (1.00) |
1 (1.00) |
0.837 (1.00) |
1 (1.00) |
0.655 (1.00) |
0.689 (1.00) |
0.729 (1.00) |
| 11q loss | 144 (26%) | 418 |
0.662 (1.00) |
0.0334 (1.00) |
0.274 (1.00) |
0.148 (1.00) |
1 (1.00) |
0.601 (1.00) |
0.568 (1.00) |
0.704 (1.00) |
| 12p loss | 77 (14%) | 485 |
0.807 (1.00) |
0.0915 (1.00) |
1 (1.00) |
0.322 (1.00) |
1 (1.00) |
1 (1.00) |
0.14 (1.00) |
1 (1.00) |
| 12q loss | 102 (18%) | 460 |
0.346 (1.00) |
0.34 (1.00) |
1 (1.00) |
0.989 (1.00) |
1 (1.00) |
1 (1.00) |
0.831 (1.00) |
1 (1.00) |
| 13q loss | 298 (53%) | 264 |
0.504 (1.00) |
0.694 (1.00) |
0.75 (1.00) |
0.952 (1.00) |
0.603 (1.00) |
0.645 (1.00) |
0.462 (1.00) |
0.524 (1.00) |
| 14q loss | 206 (37%) | 356 |
0.596 (1.00) |
0.00103 (0.631) |
0.783 (1.00) |
0.787 (1.00) |
0.302 (1.00) |
0.631 (1.00) |
0.36 (1.00) |
0.182 (1.00) |
| 16p loss | 322 (57%) | 240 |
0.402 (1.00) |
0.0765 (1.00) |
0.758 (1.00) |
0.877 (1.00) |
0.265 (1.00) |
0.871 (1.00) |
0.398 (1.00) |
0.1 (1.00) |
| 17p loss | 466 (83%) | 96 |
0.812 (1.00) |
0.346 (1.00) |
0.526 (1.00) |
0.94 (1.00) |
0.431 (1.00) |
0.0955 (1.00) |
0.907 (1.00) |
0.383 (1.00) |
| 17q loss | 372 (66%) | 190 |
0.544 (1.00) |
0.573 (1.00) |
0.798 (1.00) |
0.00647 (1.00) |
0.554 (1.00) |
0.0615 (1.00) |
0.788 (1.00) |
0.098 (1.00) |
| 18p loss | 230 (41%) | 332 |
0.083 (1.00) |
0.998 (1.00) |
0.765 (1.00) |
0.995 (1.00) |
0.068 (1.00) |
0.872 (1.00) |
0.0936 (1.00) |
1 (1.00) |
| 18q loss | 286 (51%) | 276 |
0.125 (1.00) |
0.266 (1.00) |
0.496 (1.00) |
0.981 (1.00) |
0.249 (1.00) |
1 (1.00) |
0.159 (1.00) |
0.213 (1.00) |
| 19p loss | 180 (32%) | 382 |
0.171 (1.00) |
0.0165 (1.00) |
0.193 (1.00) |
0.893 (1.00) |
1 (1.00) |
0.307 (1.00) |
0.632 (1.00) |
0.734 (1.00) |
| 19q loss | 170 (30%) | 392 |
0.774 (1.00) |
0.38 (1.00) |
0.172 (1.00) |
0.281 (1.00) |
0.557 (1.00) |
0.165 (1.00) |
0.576 (1.00) |
0.503 (1.00) |
| 20p loss | 48 (9%) | 514 |
0.0917 (1.00) |
0.339 (1.00) |
1 (1.00) |
0.369 (1.00) |
0.235 (1.00) |
0.732 (1.00) |
0.229 (1.00) |
|
| 20q loss | 31 (6%) | 531 |
0.142 (1.00) |
0.978 (1.00) |
1 (1.00) |
0.426 (1.00) |
1 (1.00) |
1 (1.00) |
0.471 (1.00) |
|
| 21q loss | 190 (34%) | 372 |
0.789 (1.00) |
0.324 (1.00) |
0.405 (1.00) |
0.48 (1.00) |
1 (1.00) |
1 (1.00) |
0.303 (1.00) |
1 (1.00) |
| 22q loss | 419 (75%) | 143 |
0.155 (1.00) |
0.116 (1.00) |
0.272 (1.00) |
0.677 (1.00) |
0.574 (1.00) |
0.0625 (1.00) |
0.902 (1.00) |
1 (1.00) |
| xq loss | 270 (48%) | 292 |
0.774 (1.00) |
0.00235 (1.00) |
0.749 (1.00) |
0.805 (1.00) |
0.11 (1.00) |
0.868 (1.00) |
0.156 (1.00) |
0.757 (1.00) |
P value = 9.38e-06 (Wilcoxon-test), Q value = 0.0059
Table S1. Gene #3: '2p gain' versus Clinical Feature #2: 'AGE'
| nPatients | Mean (Std.Dev) | |
|---|---|---|
| ALL | 541 | 59.8 (11.6) |
| 2P GAIN MUTATED | 167 | 63.1 (11.2) |
| 2P GAIN WILD-TYPE | 374 | 58.3 (11.5) |
Figure S1. Get High-res Image Gene #3: '2p gain' versus Clinical Feature #2: 'AGE'

P value = 3.7e-08 (Wilcoxon-test), Q value = 2.3e-05
Table S2. Gene #6: '3q gain' versus Clinical Feature #2: 'AGE'
| nPatients | Mean (Std.Dev) | |
|---|---|---|
| ALL | 541 | 59.8 (11.6) |
| 3Q GAIN MUTATED | 258 | 62.7 (11.2) |
| 3Q GAIN WILD-TYPE | 283 | 57.2 (11.4) |
Figure S2. Get High-res Image Gene #6: '3q gain' versus Clinical Feature #2: 'AGE'

P value = 2.07e-05 (Wilcoxon-test), Q value = 0.013
Table S3. Gene #11: '6p gain' versus Clinical Feature #2: 'AGE'
| nPatients | Mean (Std.Dev) | |
|---|---|---|
| ALL | 541 | 59.8 (11.6) |
| 6P GAIN MUTATED | 159 | 63.0 (11.0) |
| 6P GAIN WILD-TYPE | 382 | 58.5 (11.6) |
Figure S3. Get High-res Image Gene #11: '6p gain' versus Clinical Feature #2: 'AGE'
P value = 0.000256 (Wilcoxon-test), Q value = 0.16
Table S4. Gene #12: '6q gain' versus Clinical Feature #2: 'AGE'
| nPatients | Mean (Std.Dev) | |
|---|---|---|
| ALL | 541 | 59.8 (11.6) |
| 6Q GAIN MUTATED | 92 | 63.7 (10.6) |
| 6Q GAIN WILD-TYPE | 449 | 59.0 (11.7) |
Figure S4. Get High-res Image Gene #12: '6q gain' versus Clinical Feature #2: 'AGE'
P value = 3.57e-08 (Wilcoxon-test), Q value = 2.2e-05
Table S5. Gene #19: '10p gain' versus Clinical Feature #2: 'AGE'
| nPatients | Mean (Std.Dev) | |
|---|---|---|
| ALL | 541 | 59.8 (11.6) |
| 10P GAIN MUTATED | 175 | 63.7 (10.9) |
| 10P GAIN WILD-TYPE | 366 | 57.9 (11.5) |
Figure S5. Get High-res Image Gene #19: '10p gain' versus Clinical Feature #2: 'AGE'

P value = 8.2e-10 (Wilcoxon-test), Q value = 5.2e-07
Table S6. Gene #23: '12p gain' versus Clinical Feature #2: 'AGE'
| nPatients | Mean (Std.Dev) | |
|---|---|---|
| ALL | 541 | 59.8 (11.6) |
| 12P GAIN MUTATED | 236 | 63.3 (11.1) |
| 12P GAIN WILD-TYPE | 305 | 57.1 (11.3) |
Figure S6. Get High-res Image Gene #23: '12p gain' versus Clinical Feature #2: 'AGE'

P value = 6.64e-08 (Wilcoxon-test), Q value = 4.2e-05
Table S7. Gene #24: '12q gain' versus Clinical Feature #2: 'AGE'
| nPatients | Mean (Std.Dev) | |
|---|---|---|
| ALL | 541 | 59.8 (11.6) |
| 12Q GAIN MUTATED | 163 | 63.8 (10.4) |
| 12Q GAIN WILD-TYPE | 378 | 58.1 (11.7) |
Figure S7. Get High-res Image Gene #24: '12q gain' versus Clinical Feature #2: 'AGE'

P value = 1.29e-06 (Wilcoxon-test), Q value = 0.00081
Table S8. Gene #36: '20p gain' versus Clinical Feature #2: 'AGE'
| nPatients | Mean (Std.Dev) | |
|---|---|---|
| ALL | 541 | 59.8 (11.6) |
| 20P GAIN MUTATED | 271 | 62.2 (11.7) |
| 20P GAIN WILD-TYPE | 270 | 57.4 (11.1) |
Figure S8. Get High-res Image Gene #36: '20p gain' versus Clinical Feature #2: 'AGE'

P value = 2.42e-05 (Wilcoxon-test), Q value = 0.015
Table S9. Gene #37: '20q gain' versus Clinical Feature #2: 'AGE'
| nPatients | Mean (Std.Dev) | |
|---|---|---|
| ALL | 541 | 59.8 (11.6) |
| 20Q GAIN MUTATED | 306 | 61.7 (11.8) |
| 20Q GAIN WILD-TYPE | 235 | 57.3 (10.9) |
Figure S9. Get High-res Image Gene #37: '20q gain' versus Clinical Feature #2: 'AGE'

P value = 8.06e-07 (Wilcoxon-test), Q value = 0.00051
Table S10. Gene #58: '9q loss' versus Clinical Feature #2: 'AGE'
| nPatients | Mean (Std.Dev) | |
|---|---|---|
| ALL | 541 | 59.8 (11.6) |
| 9Q LOSS MUTATED | 266 | 62.3 (11.3) |
| 9Q LOSS WILD-TYPE | 275 | 57.3 (11.4) |
Figure S10. Get High-res Image Gene #58: '9q loss' versus Clinical Feature #2: 'AGE'

P value = 0.000214 (Wilcoxon-test), Q value = 0.13
Table S11. Gene #67: '15q loss' versus Clinical Feature #2: 'AGE'
| nPatients | Mean (Std.Dev) | |
|---|---|---|
| ALL | 541 | 59.8 (11.6) |
| 15Q LOSS MUTATED | 264 | 61.7 (11.3) |
| 15Q LOSS WILD-TYPE | 277 | 58.0 (11.6) |
Figure S11. Get High-res Image Gene #67: '15q loss' versus Clinical Feature #2: 'AGE'

P value = 1.86e-05 (Wilcoxon-test), Q value = 0.012
Table S12. Gene #69: '16q loss' versus Clinical Feature #2: 'AGE'
| nPatients | Mean (Std.Dev) | |
|---|---|---|
| ALL | 541 | 59.8 (11.6) |
| 16Q LOSS MUTATED | 385 | 61.2 (11.4) |
| 16Q LOSS WILD-TYPE | 156 | 56.3 (11.5) |
Figure S12. Get High-res Image Gene #69: '16q loss' versus Clinical Feature #2: 'AGE'
-
Copy number data file = transformed.cor.cli.txt
-
Clinical data file = OV-TP.merged_data.txt
-
Number of patients = 562
-
Number of significantly arm-level cnvs = 80
-
Number of selected clinical features = 8
-
Exclude regions that fewer than K tumors have mutations, K = 3
For survival clinical features, the Kaplan-Meier survival curves of tumors with and without gene mutations were plotted and the statistical significance P values were estimated by logrank test (Bland and Altman 2004) using the 'survdiff' function in R
For binary or multi-class clinical features (nominal or ordinal), two-tailed Fisher's exact tests (Fisher 1922) were used to estimate the P values using the 'fisher.test' function in R
For multiple hypothesis correction, Q value is the False Discovery Rate (FDR) analogue of the P value (Benjamini and Hochberg 1995), defined as the minimum FDR at which the test may be called significant. We used the 'Benjamini and Hochberg' method of 'p.adjust' function in R to convert P values into Q values.
In addition to the links below, the full results of the analysis summarized in this report can also be downloaded programmatically using firehose_get, or interactively from either the Broad GDAC website or TCGA Data Coordination Center Portal.