This pipeline computes the correlation between significant copy number variation (cnv focal) genes and molecular subtypes.
Testing the association between copy number variation 30 focal events and 8 molecular subtypes across 160 patients, 35 significant findings detected with P value < 0.05 and Q value < 0.25.
-
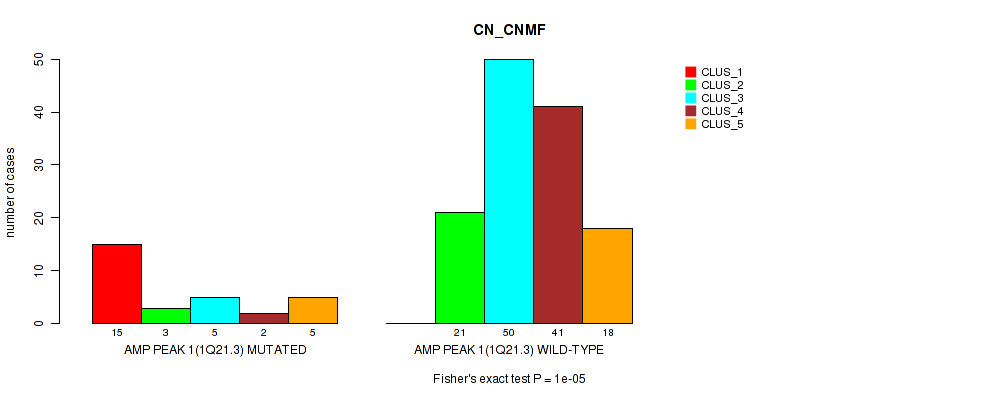
amp_1q21.3 cnv correlated to 'CN_CNMF'.
-
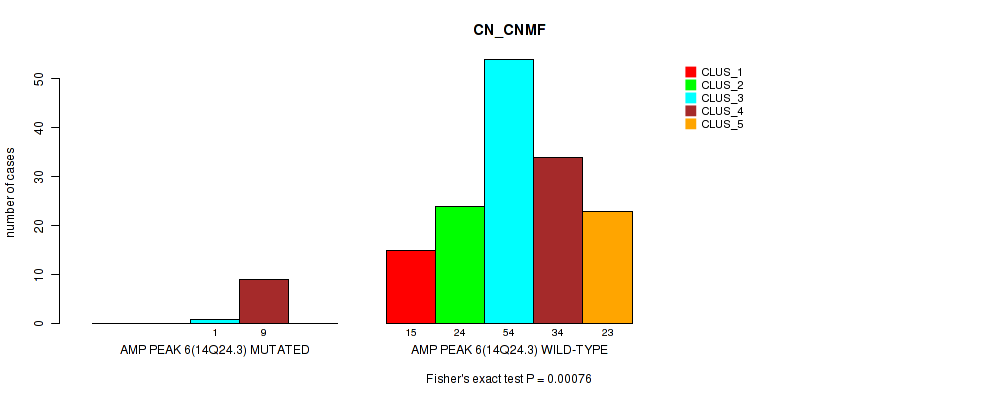
amp_14q24.3 cnv correlated to 'CN_CNMF'.
-
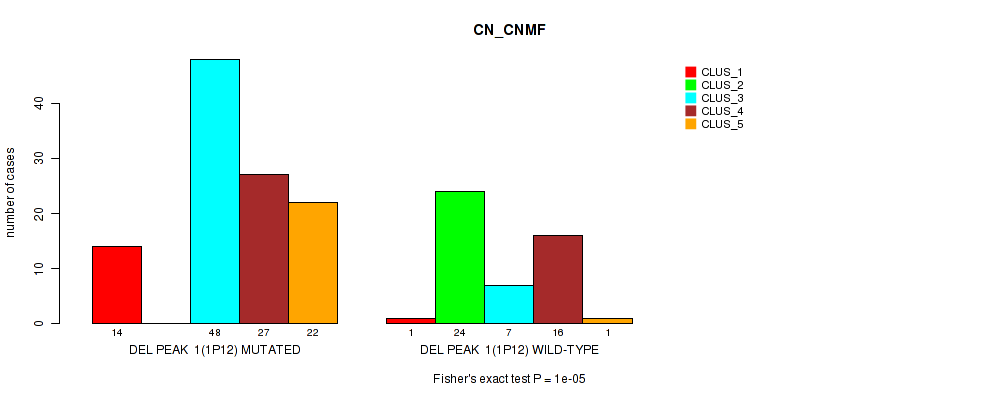
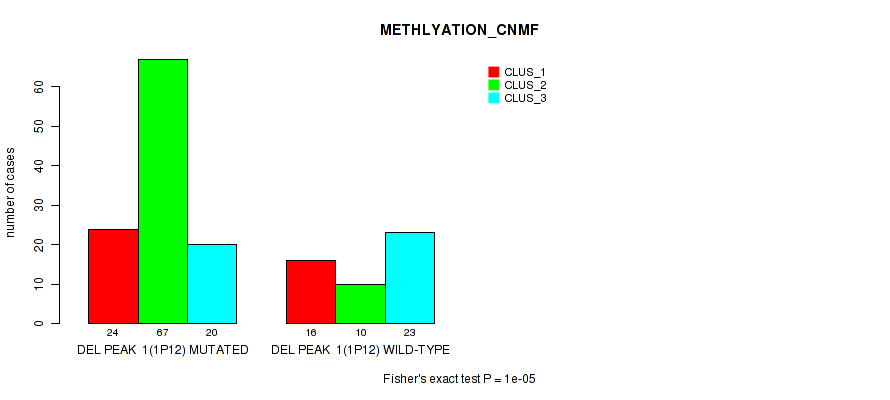
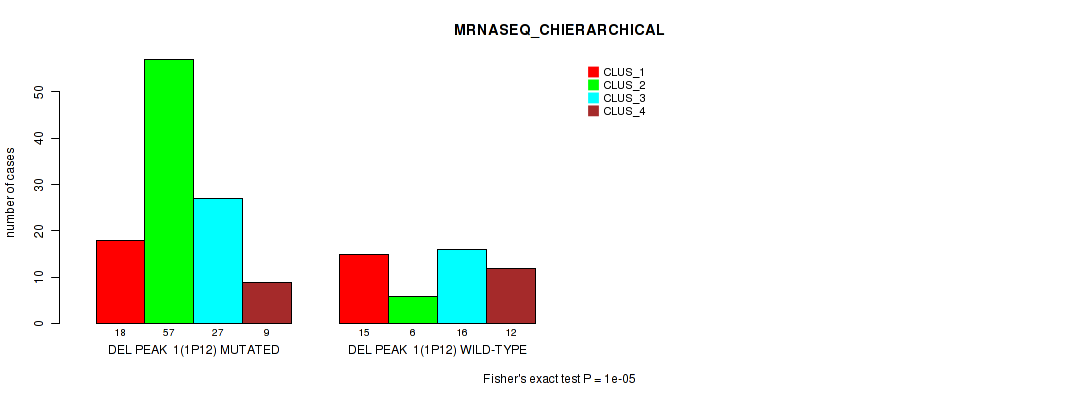
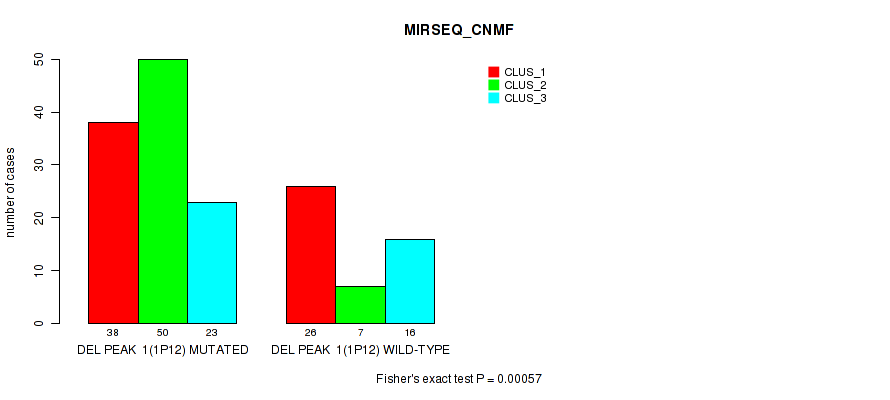
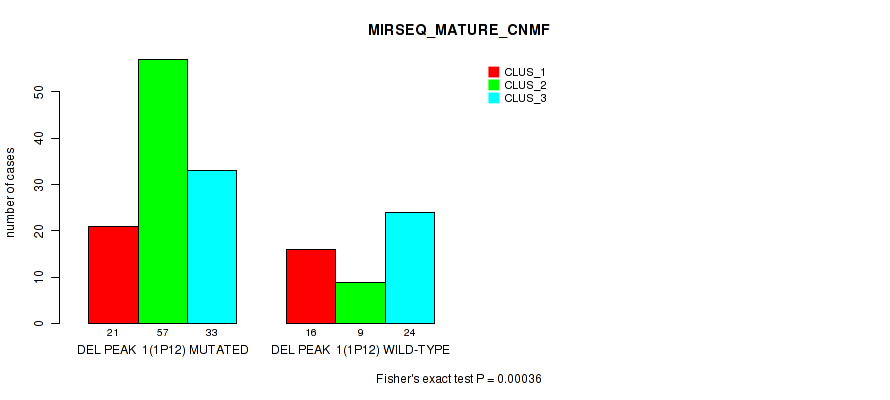
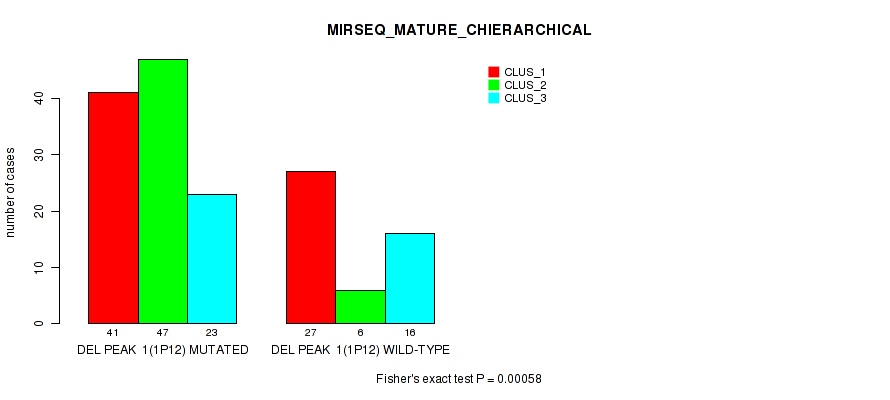
del_1p12 cnv correlated to 'CN_CNMF', 'METHLYATION_CNMF', 'MRNASEQ_CNMF', 'MRNASEQ_CHIERARCHICAL', 'MIRSEQ_CNMF', 'MIRSEQ_MATURE_CNMF', and 'MIRSEQ_MATURE_CHIERARCHICAL'.
-
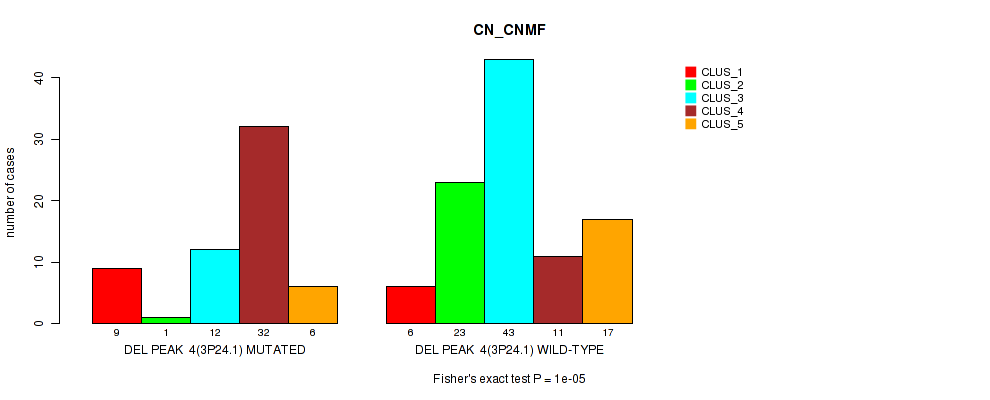
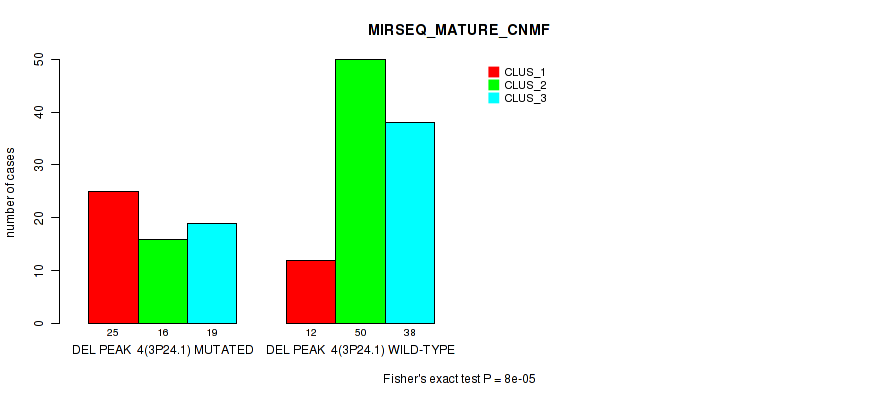
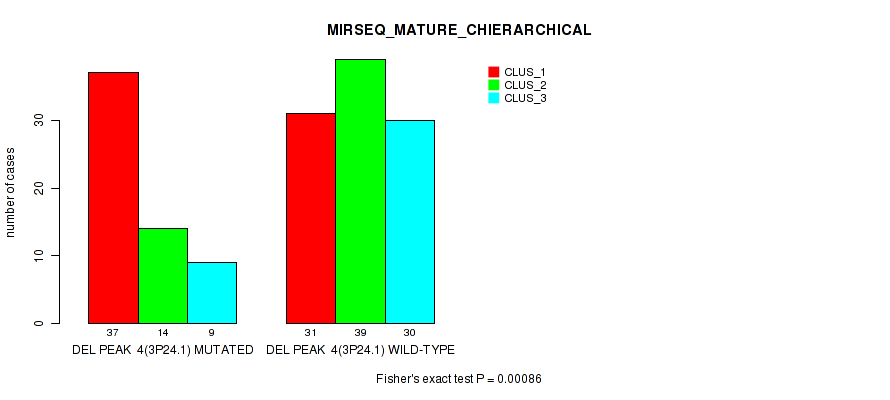
del_3p24.1 cnv correlated to 'CN_CNMF', 'MRNASEQ_CNMF', 'MRNASEQ_CHIERARCHICAL', 'MIRSEQ_CNMF', 'MIRSEQ_CHIERARCHICAL', 'MIRSEQ_MATURE_CNMF', and 'MIRSEQ_MATURE_CHIERARCHICAL'.
-
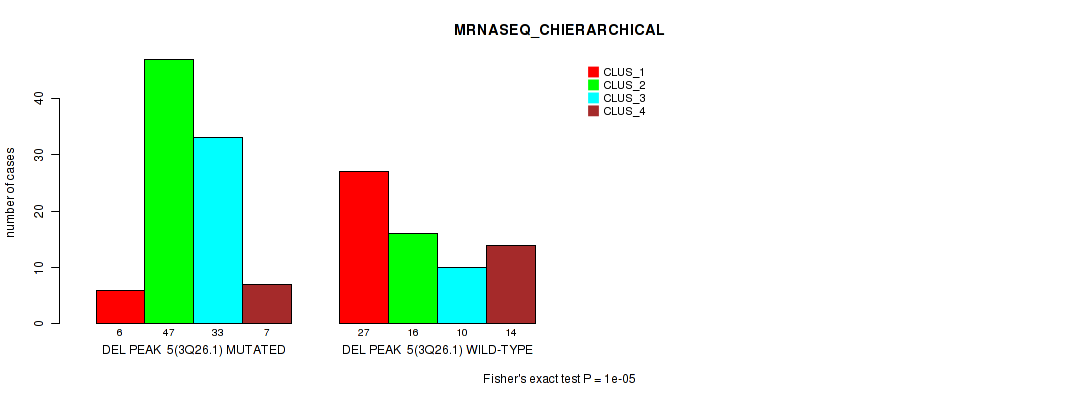
del_3q26.1 cnv correlated to 'CN_CNMF' and 'MRNASEQ_CHIERARCHICAL'.
-
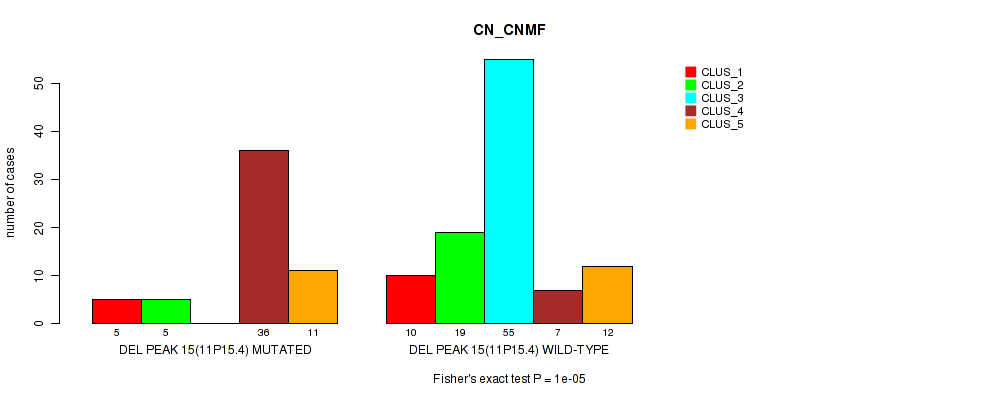
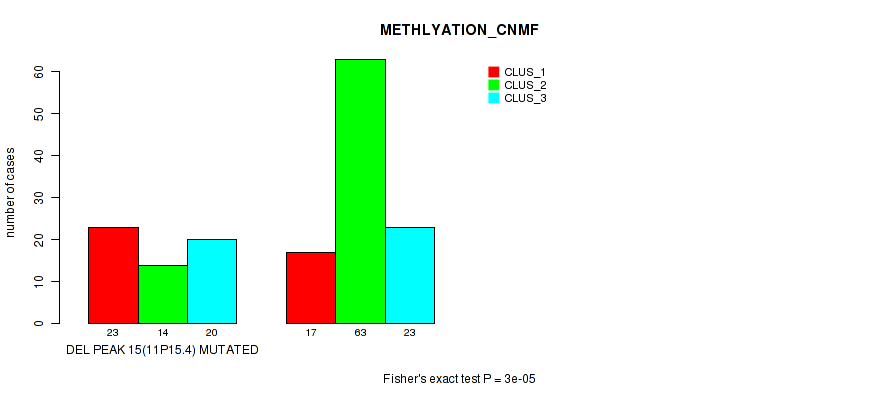
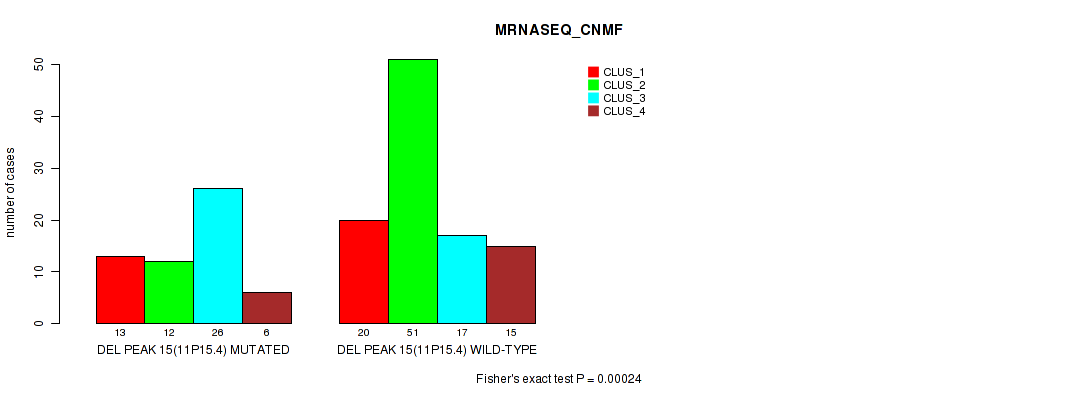
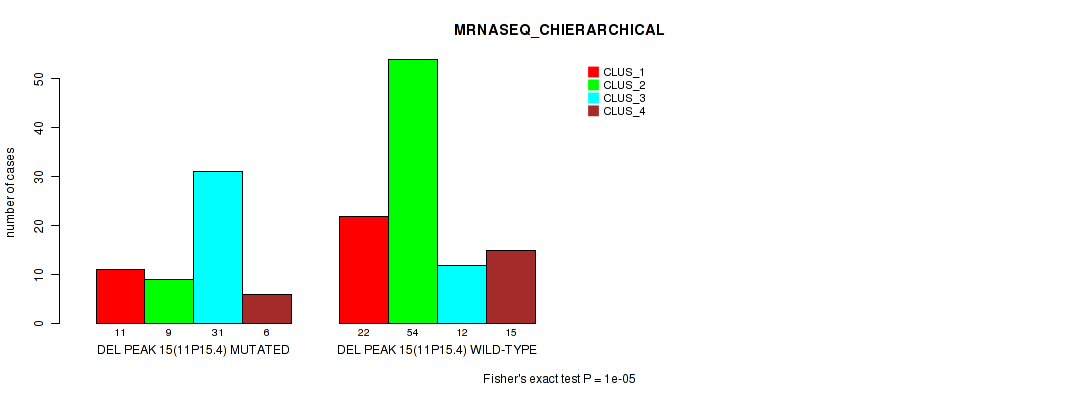
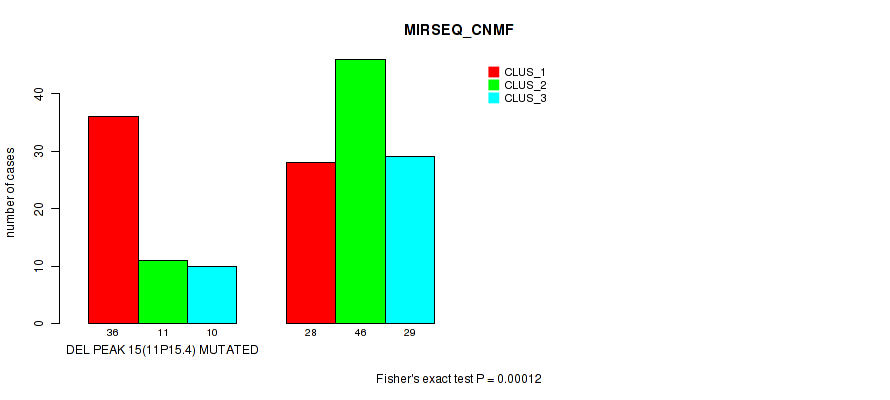
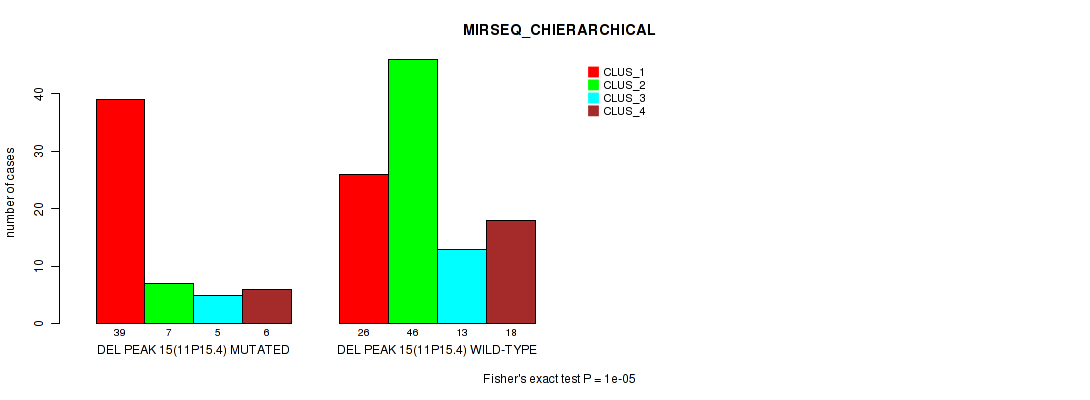
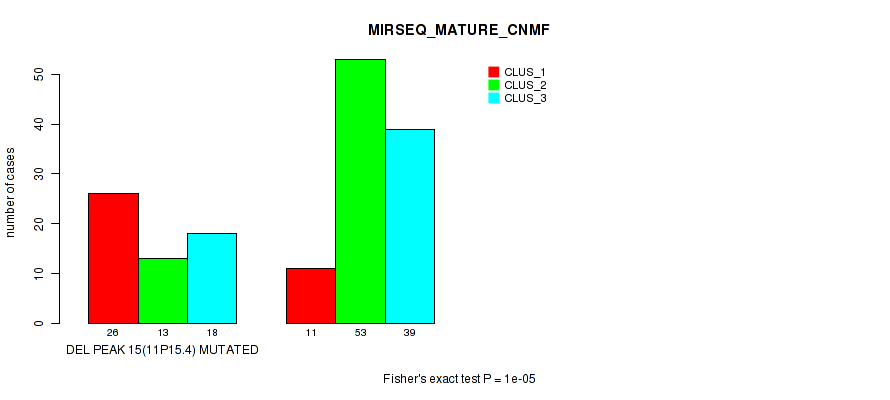
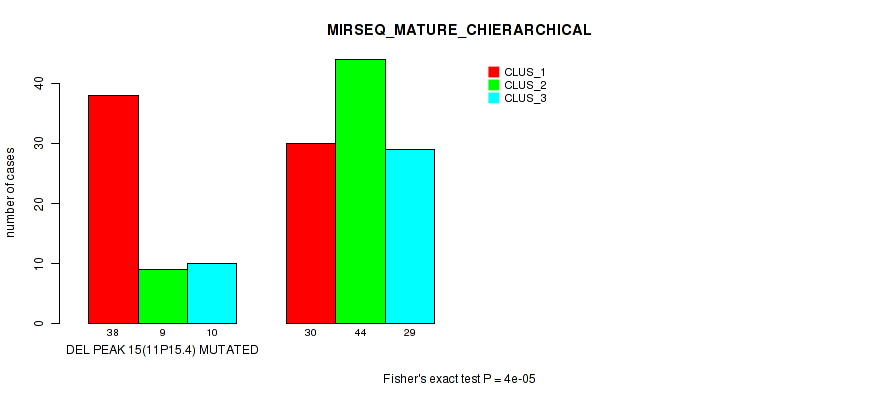
del_11p15.4 cnv correlated to 'CN_CNMF', 'METHLYATION_CNMF', 'MRNASEQ_CNMF', 'MRNASEQ_CHIERARCHICAL', 'MIRSEQ_CNMF', 'MIRSEQ_CHIERARCHICAL', 'MIRSEQ_MATURE_CNMF', and 'MIRSEQ_MATURE_CHIERARCHICAL'.
-
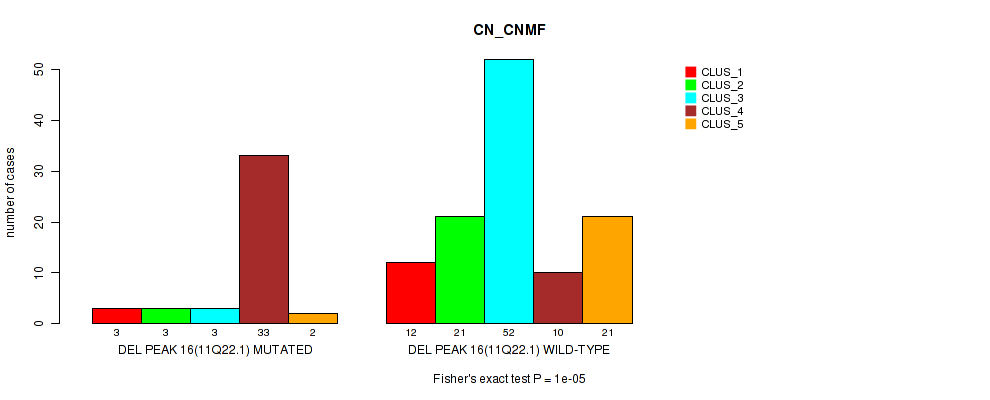
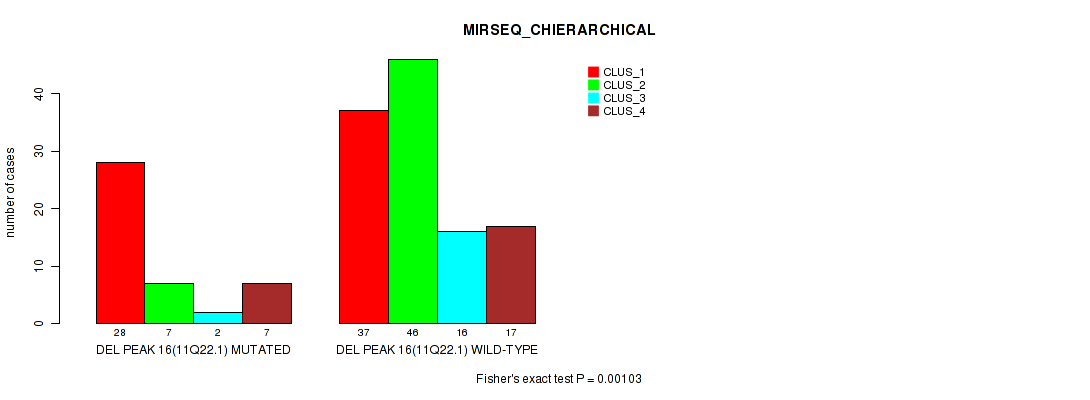
del_11q22.1 cnv correlated to 'CN_CNMF' and 'MIRSEQ_CHIERARCHICAL'.
-
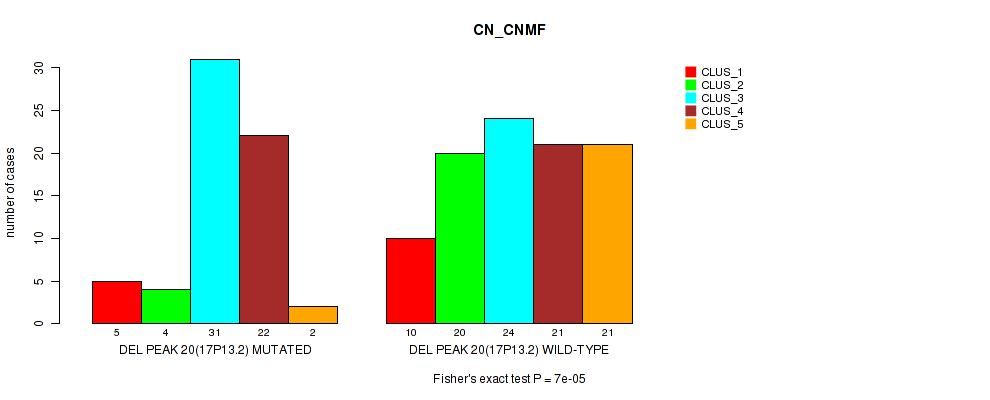
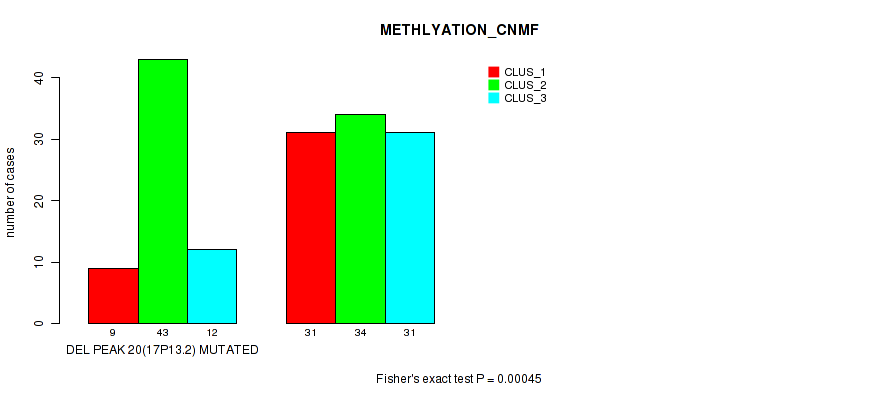
del_17p13.2 cnv correlated to 'CN_CNMF' and 'METHLYATION_CNMF'.
-
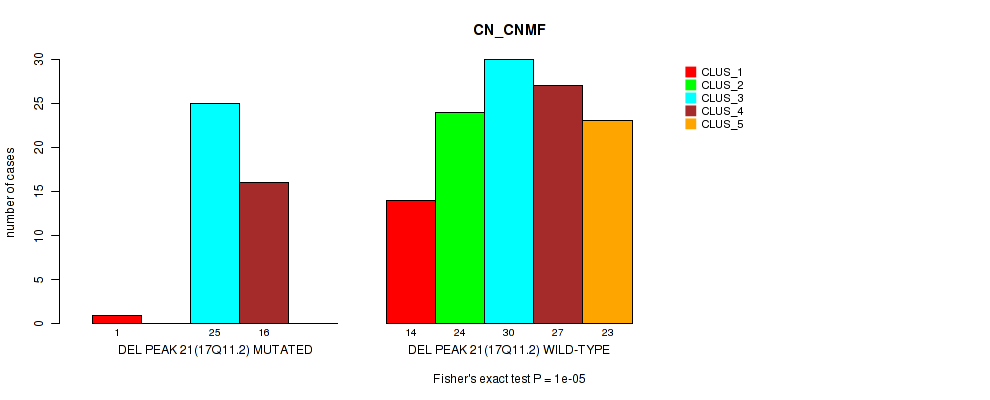
del_17q11.2 cnv correlated to 'CN_CNMF'.
-
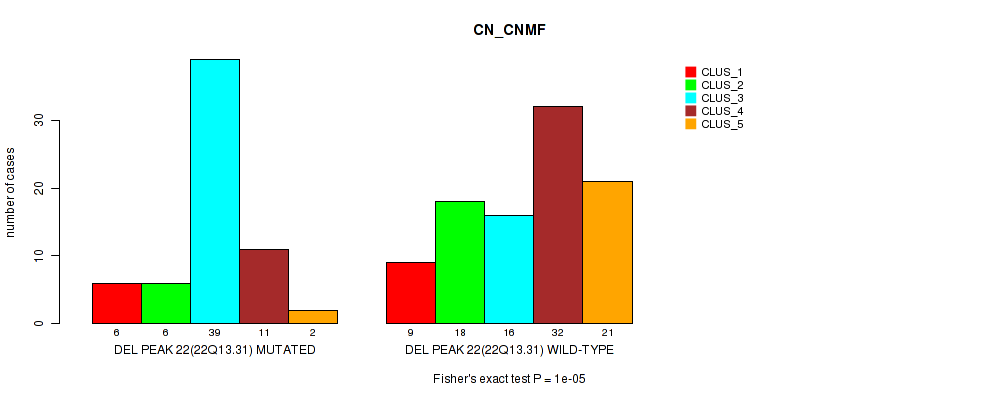
del_22q13.31 cnv correlated to 'CN_CNMF', 'MRNASEQ_CHIERARCHICAL', and 'MIRSEQ_MATURE_CHIERARCHICAL'.
-
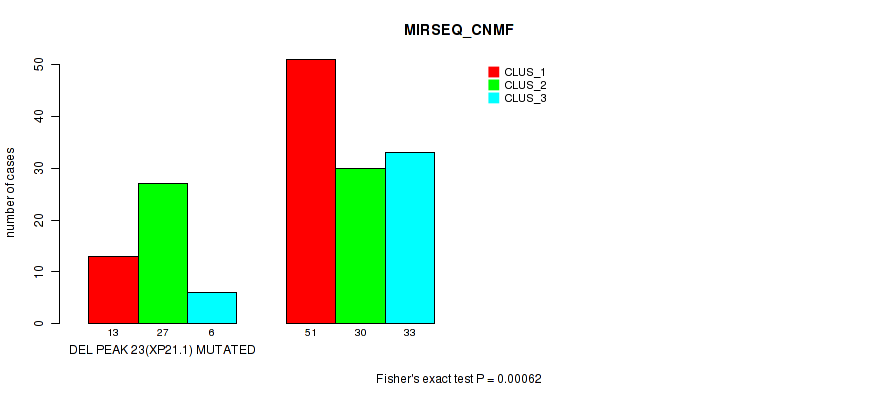
del_xp21.1 cnv correlated to 'MIRSEQ_CNMF'.
Table 1. Get Full Table Overview of the association between significant copy number variation of 30 focal events and 8 molecular subtypes. Shown in the table are P values (Q values). Thresholded by P value < 0.05 and Q value < 0.25, 35 significant findings detected.
|
Clinical Features |
CN CNMF |
METHLYATION CNMF |
MRNASEQ CNMF |
MRNASEQ CHIERARCHICAL |
MIRSEQ CNMF |
MIRSEQ CHIERARCHICAL |
MIRSEQ MATURE CNMF |
MIRSEQ MATURE CHIERARCHICAL |
||
| nCNV (%) | nWild-Type | Fisher's exact test | Fisher's exact test | Fisher's exact test | Fisher's exact test | Fisher's exact test | Fisher's exact test | Fisher's exact test | Fisher's exact test | |
| del 11p15 4 | 57 (36%) | 103 |
1e-05 (0.0024) |
3e-05 (0.00669) |
0.00024 (0.0516) |
1e-05 (0.0024) |
0.00012 (0.0263) |
1e-05 (0.0024) |
1e-05 (0.0024) |
4e-05 (0.00888) |
| del 1p12 | 111 (69%) | 49 |
1e-05 (0.0024) |
1e-05 (0.0024) |
1e-05 (0.0024) |
1e-05 (0.0024) |
0.00057 (0.121) |
0.0182 (1.00) |
0.00036 (0.077) |
0.00058 (0.122) |
| del 3p24 1 | 60 (38%) | 100 |
1e-05 (0.0024) |
0.00323 (0.623) |
0.00015 (0.0327) |
2e-05 (0.0045) |
2e-05 (0.0045) |
0.00022 (0.0475) |
8e-05 (0.0176) |
0.00086 (0.178) |
| del 22q13 31 | 64 (40%) | 96 |
1e-05 (0.0024) |
0.00962 (1.00) |
0.00312 (0.608) |
0.00018 (0.0391) |
0.00155 (0.316) |
0.0073 (1.00) |
0.00467 (0.873) |
0.0007 (0.146) |
| del 3q26 1 | 93 (58%) | 67 |
1e-05 (0.0024) |
0.573 (1.00) |
0.0199 (1.00) |
1e-05 (0.0024) |
0.0133 (1.00) |
0.006 (1.00) |
0.0957 (1.00) |
0.00362 (0.688) |
| del 11q22 1 | 44 (28%) | 116 |
1e-05 (0.0024) |
0.207 (1.00) |
0.00294 (0.576) |
0.00421 (0.791) |
0.00467 (0.873) |
0.00103 (0.212) |
0.00133 (0.273) |
0.00411 (0.777) |
| del 17p13 2 | 64 (40%) | 96 |
7e-05 (0.0155) |
0.00045 (0.0958) |
0.0128 (1.00) |
0.0053 (0.975) |
0.0241 (1.00) |
0.00707 (1.00) |
0.00213 (0.43) |
0.0194 (1.00) |
| amp 1q21 3 | 30 (19%) | 130 |
1e-05 (0.0024) |
0.608 (1.00) |
0.643 (1.00) |
0.958 (1.00) |
0.903 (1.00) |
0.442 (1.00) |
0.254 (1.00) |
0.842 (1.00) |
| amp 14q24 3 | 10 (6%) | 150 |
0.00076 (0.158) |
0.199 (1.00) |
0.853 (1.00) |
0.169 (1.00) |
0.457 (1.00) |
0.713 (1.00) |
0.0604 (1.00) |
0.598 (1.00) |
| del 17q11 2 | 42 (26%) | 118 |
1e-05 (0.0024) |
0.00335 (0.64) |
0.0222 (1.00) |
0.00254 (0.505) |
0.0924 (1.00) |
0.0682 (1.00) |
0.00251 (0.502) |
0.0321 (1.00) |
| del xp21 1 | 46 (29%) | 114 |
0.00263 (0.521) |
0.00569 (1.00) |
0.0323 (1.00) |
0.00313 (0.608) |
0.00062 (0.13) |
0.0417 (1.00) |
0.0495 (1.00) |
0.0133 (1.00) |
| amp 4q25 | 6 (4%) | 154 |
0.697 (1.00) |
0.762 (1.00) |
0.133 (1.00) |
0.382 (1.00) |
0.765 (1.00) |
0.63 (1.00) |
0.377 (1.00) |
0.762 (1.00) |
| amp 4q31 1 | 12 (8%) | 148 |
0.0809 (1.00) |
0.086 (1.00) |
0.749 (1.00) |
0.0189 (1.00) |
0.199 (1.00) |
0.185 (1.00) |
0.128 (1.00) |
0.747 (1.00) |
| amp 11p15 2 | 7 (4%) | 153 |
0.405 (1.00) |
0.141 (1.00) |
0.0909 (1.00) |
0.0924 (1.00) |
0.165 (1.00) |
0.178 (1.00) |
0.0483 (1.00) |
0.107 (1.00) |
| amp 12q13 3 | 16 (10%) | 144 |
0.079 (1.00) |
0.14 (1.00) |
0.615 (1.00) |
0.621 (1.00) |
0.047 (1.00) |
0.261 (1.00) |
0.00821 (1.00) |
0.101 (1.00) |
| amp 17q21 31 | 15 (9%) | 145 |
0.122 (1.00) |
0.83 (1.00) |
0.702 (1.00) |
0.00158 (0.321) |
0.888 (1.00) |
0.2 (1.00) |
0.194 (1.00) |
0.396 (1.00) |
| del 1q44 | 21 (13%) | 139 |
0.0554 (1.00) |
0.35 (1.00) |
0.0809 (1.00) |
0.27 (1.00) |
0.381 (1.00) |
0.716 (1.00) |
0.023 (1.00) |
0.185 (1.00) |
| del 2q34 | 13 (8%) | 147 |
0.0594 (1.00) |
0.447 (1.00) |
0.418 (1.00) |
0.143 (1.00) |
0.532 (1.00) |
0.0946 (1.00) |
0.617 (1.00) |
0.305 (1.00) |
| del 4q22 1 | 15 (9%) | 145 |
0.018 (1.00) |
0.225 (1.00) |
0.00778 (1.00) |
0.0793 (1.00) |
0.127 (1.00) |
0.29 (1.00) |
0.122 (1.00) |
0.2 (1.00) |
| del 4q35 2 | 16 (10%) | 144 |
0.00276 (0.544) |
0.521 (1.00) |
0.233 (1.00) |
0.369 (1.00) |
0.752 (1.00) |
0.641 (1.00) |
0.528 (1.00) |
0.53 (1.00) |
| del 5q15 | 12 (8%) | 148 |
0.277 (1.00) |
1 (1.00) |
0.973 (1.00) |
1 (1.00) |
0.928 (1.00) |
0.187 (1.00) |
0.866 (1.00) |
0.75 (1.00) |
| del 6p12 3 | 10 (6%) | 150 |
0.185 (1.00) |
0.265 (1.00) |
0.0205 (1.00) |
0.0926 (1.00) |
0.199 (1.00) |
0.169 (1.00) |
0.767 (1.00) |
0.199 (1.00) |
| del 6q16 1 | 24 (15%) | 136 |
0.357 (1.00) |
0.0742 (1.00) |
0.0255 (1.00) |
0.00736 (1.00) |
0.0167 (1.00) |
0.00523 (0.968) |
0.00624 (1.00) |
0.00329 (0.632) |
| del 7q33 | 8 (5%) | 152 |
0.031 (1.00) |
0.257 (1.00) |
0.00662 (1.00) |
0.0505 (1.00) |
0.0167 (1.00) |
0.00612 (1.00) |
0.525 (1.00) |
0.00927 (1.00) |
| del 8p22 | 24 (15%) | 136 |
0.0605 (1.00) |
0.124 (1.00) |
0.00247 (0.496) |
0.00657 (1.00) |
0.152 (1.00) |
0.155 (1.00) |
0.0251 (1.00) |
0.187 (1.00) |
| del 9p24 2 | 15 (9%) | 145 |
0.476 (1.00) |
0.339 (1.00) |
0.0839 (1.00) |
0.167 (1.00) |
0.514 (1.00) |
0.0729 (1.00) |
0.351 (1.00) |
0.542 (1.00) |
| del 9q21 12 | 14 (9%) | 146 |
0.562 (1.00) |
0.553 (1.00) |
0.362 (1.00) |
0.358 (1.00) |
0.723 (1.00) |
0.116 (1.00) |
0.826 (1.00) |
1 (1.00) |
| del 12q21 33 | 8 (5%) | 152 |
0.323 (1.00) |
0.893 (1.00) |
0.912 (1.00) |
0.876 (1.00) |
0.594 (1.00) |
0.702 (1.00) |
0.409 (1.00) |
0.527 (1.00) |
| del 13q22 3 | 7 (4%) | 153 |
0.726 (1.00) |
0.889 (1.00) |
0.368 (1.00) |
0.676 (1.00) |
0.794 (1.00) |
0.451 (1.00) |
0.541 (1.00) |
0.484 (1.00) |
| del 16q21 | 5 (3%) | 155 |
0.0144 (1.00) |
0.114 (1.00) |
0.554 (1.00) |
0.0146 (1.00) |
0.212 (1.00) |
0.592 (1.00) |
0.452 (1.00) |
0.851 (1.00) |
P value = 1e-05 (Fisher's exact test), Q value = 0.0024
Table S1. Gene #1: 'amp_1q21.3' versus Molecular Subtype #1: 'CN_CNMF'
| nPatients | CLUS_1 | CLUS_2 | CLUS_3 | CLUS_4 | CLUS_5 |
|---|---|---|---|---|---|
| ALL | 15 | 24 | 55 | 43 | 23 |
| AMP PEAK 1(1Q21.3) MUTATED | 15 | 3 | 5 | 2 | 5 |
| AMP PEAK 1(1Q21.3) WILD-TYPE | 0 | 21 | 50 | 41 | 18 |
Figure S1. Get High-res Image Gene #1: 'amp_1q21.3' versus Molecular Subtype #1: 'CN_CNMF'
P value = 0.00076 (Fisher's exact test), Q value = 0.16
Table S2. Gene #6: 'amp_14q24.3' versus Molecular Subtype #1: 'CN_CNMF'
| nPatients | CLUS_1 | CLUS_2 | CLUS_3 | CLUS_4 | CLUS_5 |
|---|---|---|---|---|---|
| ALL | 15 | 24 | 55 | 43 | 23 |
| AMP PEAK 6(14Q24.3) MUTATED | 0 | 0 | 1 | 9 | 0 |
| AMP PEAK 6(14Q24.3) WILD-TYPE | 15 | 24 | 54 | 34 | 23 |
Figure S2. Get High-res Image Gene #6: 'amp_14q24.3' versus Molecular Subtype #1: 'CN_CNMF'
P value = 1e-05 (Fisher's exact test), Q value = 0.0024
Table S3. Gene #8: 'del_1p12' versus Molecular Subtype #1: 'CN_CNMF'
| nPatients | CLUS_1 | CLUS_2 | CLUS_3 | CLUS_4 | CLUS_5 |
|---|---|---|---|---|---|
| ALL | 15 | 24 | 55 | 43 | 23 |
| DEL PEAK 1(1P12) MUTATED | 14 | 0 | 48 | 27 | 22 |
| DEL PEAK 1(1P12) WILD-TYPE | 1 | 24 | 7 | 16 | 1 |
Figure S3. Get High-res Image Gene #8: 'del_1p12' versus Molecular Subtype #1: 'CN_CNMF'
P value = 1e-05 (Fisher's exact test), Q value = 0.0024
Table S4. Gene #8: 'del_1p12' versus Molecular Subtype #2: 'METHLYATION_CNMF'
| nPatients | CLUS_1 | CLUS_2 | CLUS_3 |
|---|---|---|---|
| ALL | 40 | 77 | 43 |
| DEL PEAK 1(1P12) MUTATED | 24 | 67 | 20 |
| DEL PEAK 1(1P12) WILD-TYPE | 16 | 10 | 23 |
Figure S4. Get High-res Image Gene #8: 'del_1p12' versus Molecular Subtype #2: 'METHLYATION_CNMF'
P value = 1e-05 (Fisher's exact test), Q value = 0.0024
Table S5. Gene #8: 'del_1p12' versus Molecular Subtype #3: 'MRNASEQ_CNMF'
| nPatients | CLUS_1 | CLUS_2 | CLUS_3 | CLUS_4 |
|---|---|---|---|---|
| ALL | 33 | 63 | 43 | 21 |
| DEL PEAK 1(1P12) MUTATED | 24 | 57 | 20 | 10 |
| DEL PEAK 1(1P12) WILD-TYPE | 9 | 6 | 23 | 11 |
Figure S5. Get High-res Image Gene #8: 'del_1p12' versus Molecular Subtype #3: 'MRNASEQ_CNMF'

P value = 1e-05 (Fisher's exact test), Q value = 0.0024
Table S6. Gene #8: 'del_1p12' versus Molecular Subtype #4: 'MRNASEQ_CHIERARCHICAL'
| nPatients | CLUS_1 | CLUS_2 | CLUS_3 | CLUS_4 |
|---|---|---|---|---|
| ALL | 33 | 63 | 43 | 21 |
| DEL PEAK 1(1P12) MUTATED | 18 | 57 | 27 | 9 |
| DEL PEAK 1(1P12) WILD-TYPE | 15 | 6 | 16 | 12 |
Figure S6. Get High-res Image Gene #8: 'del_1p12' versus Molecular Subtype #4: 'MRNASEQ_CHIERARCHICAL'
P value = 0.00057 (Fisher's exact test), Q value = 0.12
Table S7. Gene #8: 'del_1p12' versus Molecular Subtype #5: 'MIRSEQ_CNMF'
| nPatients | CLUS_1 | CLUS_2 | CLUS_3 |
|---|---|---|---|
| ALL | 64 | 57 | 39 |
| DEL PEAK 1(1P12) MUTATED | 38 | 50 | 23 |
| DEL PEAK 1(1P12) WILD-TYPE | 26 | 7 | 16 |
Figure S7. Get High-res Image Gene #8: 'del_1p12' versus Molecular Subtype #5: 'MIRSEQ_CNMF'
P value = 0.00036 (Fisher's exact test), Q value = 0.077
Table S8. Gene #8: 'del_1p12' versus Molecular Subtype #7: 'MIRSEQ_MATURE_CNMF'
| nPatients | CLUS_1 | CLUS_2 | CLUS_3 |
|---|---|---|---|
| ALL | 37 | 66 | 57 |
| DEL PEAK 1(1P12) MUTATED | 21 | 57 | 33 |
| DEL PEAK 1(1P12) WILD-TYPE | 16 | 9 | 24 |
Figure S8. Get High-res Image Gene #8: 'del_1p12' versus Molecular Subtype #7: 'MIRSEQ_MATURE_CNMF'
P value = 0.00058 (Fisher's exact test), Q value = 0.12
Table S9. Gene #8: 'del_1p12' versus Molecular Subtype #8: 'MIRSEQ_MATURE_CHIERARCHICAL'
| nPatients | CLUS_1 | CLUS_2 | CLUS_3 |
|---|---|---|---|
| ALL | 68 | 53 | 39 |
| DEL PEAK 1(1P12) MUTATED | 41 | 47 | 23 |
| DEL PEAK 1(1P12) WILD-TYPE | 27 | 6 | 16 |
Figure S9. Get High-res Image Gene #8: 'del_1p12' versus Molecular Subtype #8: 'MIRSEQ_MATURE_CHIERARCHICAL'
P value = 1e-05 (Fisher's exact test), Q value = 0.0024
Table S10. Gene #11: 'del_3p24.1' versus Molecular Subtype #1: 'CN_CNMF'
| nPatients | CLUS_1 | CLUS_2 | CLUS_3 | CLUS_4 | CLUS_5 |
|---|---|---|---|---|---|
| ALL | 15 | 24 | 55 | 43 | 23 |
| DEL PEAK 4(3P24.1) MUTATED | 9 | 1 | 12 | 32 | 6 |
| DEL PEAK 4(3P24.1) WILD-TYPE | 6 | 23 | 43 | 11 | 17 |
Figure S10. Get High-res Image Gene #11: 'del_3p24.1' versus Molecular Subtype #1: 'CN_CNMF'
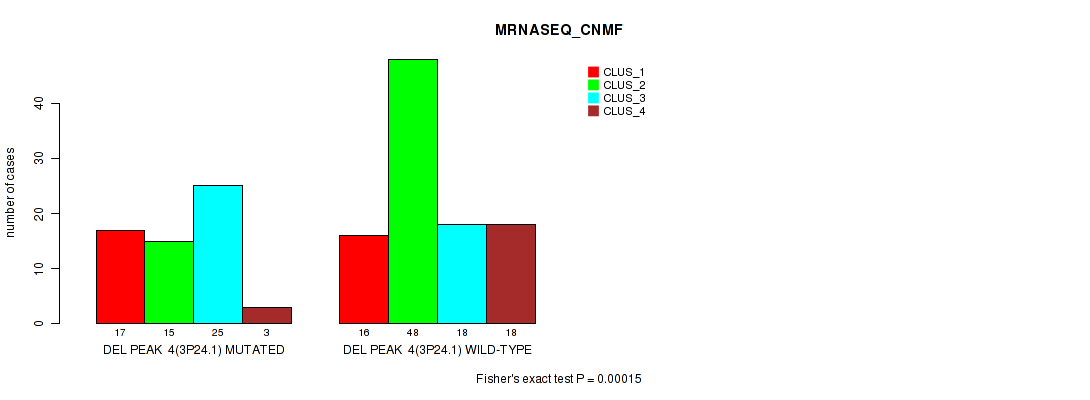
P value = 0.00015 (Fisher's exact test), Q value = 0.033
Table S11. Gene #11: 'del_3p24.1' versus Molecular Subtype #3: 'MRNASEQ_CNMF'
| nPatients | CLUS_1 | CLUS_2 | CLUS_3 | CLUS_4 |
|---|---|---|---|---|
| ALL | 33 | 63 | 43 | 21 |
| DEL PEAK 4(3P24.1) MUTATED | 17 | 15 | 25 | 3 |
| DEL PEAK 4(3P24.1) WILD-TYPE | 16 | 48 | 18 | 18 |
Figure S11. Get High-res Image Gene #11: 'del_3p24.1' versus Molecular Subtype #3: 'MRNASEQ_CNMF'
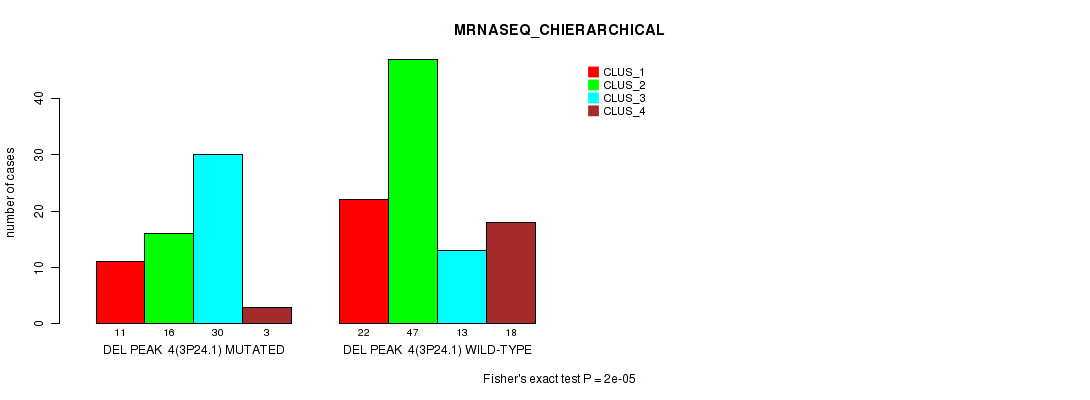
P value = 2e-05 (Fisher's exact test), Q value = 0.0045
Table S12. Gene #11: 'del_3p24.1' versus Molecular Subtype #4: 'MRNASEQ_CHIERARCHICAL'
| nPatients | CLUS_1 | CLUS_2 | CLUS_3 | CLUS_4 |
|---|---|---|---|---|
| ALL | 33 | 63 | 43 | 21 |
| DEL PEAK 4(3P24.1) MUTATED | 11 | 16 | 30 | 3 |
| DEL PEAK 4(3P24.1) WILD-TYPE | 22 | 47 | 13 | 18 |
Figure S12. Get High-res Image Gene #11: 'del_3p24.1' versus Molecular Subtype #4: 'MRNASEQ_CHIERARCHICAL'
P value = 2e-05 (Fisher's exact test), Q value = 0.0045
Table S13. Gene #11: 'del_3p24.1' versus Molecular Subtype #5: 'MIRSEQ_CNMF'
| nPatients | CLUS_1 | CLUS_2 | CLUS_3 |
|---|---|---|---|
| ALL | 64 | 57 | 39 |
| DEL PEAK 4(3P24.1) MUTATED | 37 | 17 | 6 |
| DEL PEAK 4(3P24.1) WILD-TYPE | 27 | 40 | 33 |
Figure S13. Get High-res Image Gene #11: 'del_3p24.1' versus Molecular Subtype #5: 'MIRSEQ_CNMF'

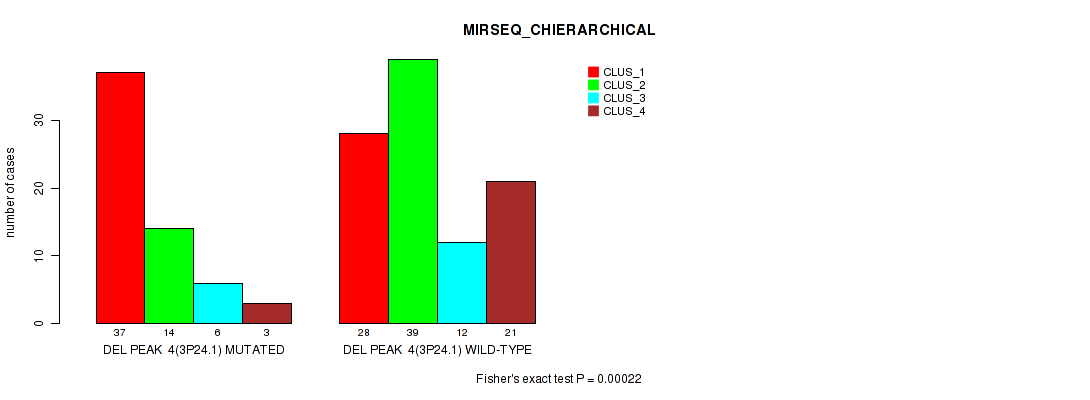
P value = 0.00022 (Fisher's exact test), Q value = 0.048
Table S14. Gene #11: 'del_3p24.1' versus Molecular Subtype #6: 'MIRSEQ_CHIERARCHICAL'
| nPatients | CLUS_1 | CLUS_2 | CLUS_3 | CLUS_4 |
|---|---|---|---|---|
| ALL | 65 | 53 | 18 | 24 |
| DEL PEAK 4(3P24.1) MUTATED | 37 | 14 | 6 | 3 |
| DEL PEAK 4(3P24.1) WILD-TYPE | 28 | 39 | 12 | 21 |
Figure S14. Get High-res Image Gene #11: 'del_3p24.1' versus Molecular Subtype #6: 'MIRSEQ_CHIERARCHICAL'
P value = 8e-05 (Fisher's exact test), Q value = 0.018
Table S15. Gene #11: 'del_3p24.1' versus Molecular Subtype #7: 'MIRSEQ_MATURE_CNMF'
| nPatients | CLUS_1 | CLUS_2 | CLUS_3 |
|---|---|---|---|
| ALL | 37 | 66 | 57 |
| DEL PEAK 4(3P24.1) MUTATED | 25 | 16 | 19 |
| DEL PEAK 4(3P24.1) WILD-TYPE | 12 | 50 | 38 |
Figure S15. Get High-res Image Gene #11: 'del_3p24.1' versus Molecular Subtype #7: 'MIRSEQ_MATURE_CNMF'
P value = 0.00086 (Fisher's exact test), Q value = 0.18
Table S16. Gene #11: 'del_3p24.1' versus Molecular Subtype #8: 'MIRSEQ_MATURE_CHIERARCHICAL'
| nPatients | CLUS_1 | CLUS_2 | CLUS_3 |
|---|---|---|---|
| ALL | 68 | 53 | 39 |
| DEL PEAK 4(3P24.1) MUTATED | 37 | 14 | 9 |
| DEL PEAK 4(3P24.1) WILD-TYPE | 31 | 39 | 30 |
Figure S16. Get High-res Image Gene #11: 'del_3p24.1' versus Molecular Subtype #8: 'MIRSEQ_MATURE_CHIERARCHICAL'
P value = 1e-05 (Fisher's exact test), Q value = 0.0024
Table S17. Gene #12: 'del_3q26.1' versus Molecular Subtype #1: 'CN_CNMF'
| nPatients | CLUS_1 | CLUS_2 | CLUS_3 | CLUS_4 | CLUS_5 |
|---|---|---|---|---|---|
| ALL | 15 | 24 | 55 | 43 | 23 |
| DEL PEAK 5(3Q26.1) MUTATED | 8 | 0 | 38 | 33 | 14 |
| DEL PEAK 5(3Q26.1) WILD-TYPE | 7 | 24 | 17 | 10 | 9 |
Figure S17. Get High-res Image Gene #12: 'del_3q26.1' versus Molecular Subtype #1: 'CN_CNMF'

P value = 1e-05 (Fisher's exact test), Q value = 0.0024
Table S18. Gene #12: 'del_3q26.1' versus Molecular Subtype #4: 'MRNASEQ_CHIERARCHICAL'
| nPatients | CLUS_1 | CLUS_2 | CLUS_3 | CLUS_4 |
|---|---|---|---|---|
| ALL | 33 | 63 | 43 | 21 |
| DEL PEAK 5(3Q26.1) MUTATED | 6 | 47 | 33 | 7 |
| DEL PEAK 5(3Q26.1) WILD-TYPE | 27 | 16 | 10 | 14 |
Figure S18. Get High-res Image Gene #12: 'del_3q26.1' versus Molecular Subtype #4: 'MRNASEQ_CHIERARCHICAL'
P value = 1e-05 (Fisher's exact test), Q value = 0.0024
Table S19. Gene #22: 'del_11p15.4' versus Molecular Subtype #1: 'CN_CNMF'
| nPatients | CLUS_1 | CLUS_2 | CLUS_3 | CLUS_4 | CLUS_5 |
|---|---|---|---|---|---|
| ALL | 15 | 24 | 55 | 43 | 23 |
| DEL PEAK 15(11P15.4) MUTATED | 5 | 5 | 0 | 36 | 11 |
| DEL PEAK 15(11P15.4) WILD-TYPE | 10 | 19 | 55 | 7 | 12 |
Figure S19. Get High-res Image Gene #22: 'del_11p15.4' versus Molecular Subtype #1: 'CN_CNMF'
P value = 3e-05 (Fisher's exact test), Q value = 0.0067
Table S20. Gene #22: 'del_11p15.4' versus Molecular Subtype #2: 'METHLYATION_CNMF'
| nPatients | CLUS_1 | CLUS_2 | CLUS_3 |
|---|---|---|---|
| ALL | 40 | 77 | 43 |
| DEL PEAK 15(11P15.4) MUTATED | 23 | 14 | 20 |
| DEL PEAK 15(11P15.4) WILD-TYPE | 17 | 63 | 23 |
Figure S20. Get High-res Image Gene #22: 'del_11p15.4' versus Molecular Subtype #2: 'METHLYATION_CNMF'
P value = 0.00024 (Fisher's exact test), Q value = 0.052
Table S21. Gene #22: 'del_11p15.4' versus Molecular Subtype #3: 'MRNASEQ_CNMF'
| nPatients | CLUS_1 | CLUS_2 | CLUS_3 | CLUS_4 |
|---|---|---|---|---|
| ALL | 33 | 63 | 43 | 21 |
| DEL PEAK 15(11P15.4) MUTATED | 13 | 12 | 26 | 6 |
| DEL PEAK 15(11P15.4) WILD-TYPE | 20 | 51 | 17 | 15 |
Figure S21. Get High-res Image Gene #22: 'del_11p15.4' versus Molecular Subtype #3: 'MRNASEQ_CNMF'
P value = 1e-05 (Fisher's exact test), Q value = 0.0024
Table S22. Gene #22: 'del_11p15.4' versus Molecular Subtype #4: 'MRNASEQ_CHIERARCHICAL'
| nPatients | CLUS_1 | CLUS_2 | CLUS_3 | CLUS_4 |
|---|---|---|---|---|
| ALL | 33 | 63 | 43 | 21 |
| DEL PEAK 15(11P15.4) MUTATED | 11 | 9 | 31 | 6 |
| DEL PEAK 15(11P15.4) WILD-TYPE | 22 | 54 | 12 | 15 |
Figure S22. Get High-res Image Gene #22: 'del_11p15.4' versus Molecular Subtype #4: 'MRNASEQ_CHIERARCHICAL'
P value = 0.00012 (Fisher's exact test), Q value = 0.026
Table S23. Gene #22: 'del_11p15.4' versus Molecular Subtype #5: 'MIRSEQ_CNMF'
| nPatients | CLUS_1 | CLUS_2 | CLUS_3 |
|---|---|---|---|
| ALL | 64 | 57 | 39 |
| DEL PEAK 15(11P15.4) MUTATED | 36 | 11 | 10 |
| DEL PEAK 15(11P15.4) WILD-TYPE | 28 | 46 | 29 |
Figure S23. Get High-res Image Gene #22: 'del_11p15.4' versus Molecular Subtype #5: 'MIRSEQ_CNMF'
P value = 1e-05 (Fisher's exact test), Q value = 0.0024
Table S24. Gene #22: 'del_11p15.4' versus Molecular Subtype #6: 'MIRSEQ_CHIERARCHICAL'
| nPatients | CLUS_1 | CLUS_2 | CLUS_3 | CLUS_4 |
|---|---|---|---|---|
| ALL | 65 | 53 | 18 | 24 |
| DEL PEAK 15(11P15.4) MUTATED | 39 | 7 | 5 | 6 |
| DEL PEAK 15(11P15.4) WILD-TYPE | 26 | 46 | 13 | 18 |
Figure S24. Get High-res Image Gene #22: 'del_11p15.4' versus Molecular Subtype #6: 'MIRSEQ_CHIERARCHICAL'
P value = 1e-05 (Fisher's exact test), Q value = 0.0024
Table S25. Gene #22: 'del_11p15.4' versus Molecular Subtype #7: 'MIRSEQ_MATURE_CNMF'
| nPatients | CLUS_1 | CLUS_2 | CLUS_3 |
|---|---|---|---|
| ALL | 37 | 66 | 57 |
| DEL PEAK 15(11P15.4) MUTATED | 26 | 13 | 18 |
| DEL PEAK 15(11P15.4) WILD-TYPE | 11 | 53 | 39 |
Figure S25. Get High-res Image Gene #22: 'del_11p15.4' versus Molecular Subtype #7: 'MIRSEQ_MATURE_CNMF'
P value = 4e-05 (Fisher's exact test), Q value = 0.0089
Table S26. Gene #22: 'del_11p15.4' versus Molecular Subtype #8: 'MIRSEQ_MATURE_CHIERARCHICAL'
| nPatients | CLUS_1 | CLUS_2 | CLUS_3 |
|---|---|---|---|
| ALL | 68 | 53 | 39 |
| DEL PEAK 15(11P15.4) MUTATED | 38 | 9 | 10 |
| DEL PEAK 15(11P15.4) WILD-TYPE | 30 | 44 | 29 |
Figure S26. Get High-res Image Gene #22: 'del_11p15.4' versus Molecular Subtype #8: 'MIRSEQ_MATURE_CHIERARCHICAL'
P value = 1e-05 (Fisher's exact test), Q value = 0.0024
Table S27. Gene #23: 'del_11q22.1' versus Molecular Subtype #1: 'CN_CNMF'
| nPatients | CLUS_1 | CLUS_2 | CLUS_3 | CLUS_4 | CLUS_5 |
|---|---|---|---|---|---|
| ALL | 15 | 24 | 55 | 43 | 23 |
| DEL PEAK 16(11Q22.1) MUTATED | 3 | 3 | 3 | 33 | 2 |
| DEL PEAK 16(11Q22.1) WILD-TYPE | 12 | 21 | 52 | 10 | 21 |
Figure S27. Get High-res Image Gene #23: 'del_11q22.1' versus Molecular Subtype #1: 'CN_CNMF'
P value = 0.00103 (Fisher's exact test), Q value = 0.21
Table S28. Gene #23: 'del_11q22.1' versus Molecular Subtype #6: 'MIRSEQ_CHIERARCHICAL'
| nPatients | CLUS_1 | CLUS_2 | CLUS_3 | CLUS_4 |
|---|---|---|---|---|
| ALL | 65 | 53 | 18 | 24 |
| DEL PEAK 16(11Q22.1) MUTATED | 28 | 7 | 2 | 7 |
| DEL PEAK 16(11Q22.1) WILD-TYPE | 37 | 46 | 16 | 17 |
Figure S28. Get High-res Image Gene #23: 'del_11q22.1' versus Molecular Subtype #6: 'MIRSEQ_CHIERARCHICAL'
P value = 7e-05 (Fisher's exact test), Q value = 0.015
Table S29. Gene #27: 'del_17p13.2' versus Molecular Subtype #1: 'CN_CNMF'
| nPatients | CLUS_1 | CLUS_2 | CLUS_3 | CLUS_4 | CLUS_5 |
|---|---|---|---|---|---|
| ALL | 15 | 24 | 55 | 43 | 23 |
| DEL PEAK 20(17P13.2) MUTATED | 5 | 4 | 31 | 22 | 2 |
| DEL PEAK 20(17P13.2) WILD-TYPE | 10 | 20 | 24 | 21 | 21 |
Figure S29. Get High-res Image Gene #27: 'del_17p13.2' versus Molecular Subtype #1: 'CN_CNMF'
P value = 0.00045 (Fisher's exact test), Q value = 0.096
Table S30. Gene #27: 'del_17p13.2' versus Molecular Subtype #2: 'METHLYATION_CNMF'
| nPatients | CLUS_1 | CLUS_2 | CLUS_3 |
|---|---|---|---|
| ALL | 40 | 77 | 43 |
| DEL PEAK 20(17P13.2) MUTATED | 9 | 43 | 12 |
| DEL PEAK 20(17P13.2) WILD-TYPE | 31 | 34 | 31 |
Figure S30. Get High-res Image Gene #27: 'del_17p13.2' versus Molecular Subtype #2: 'METHLYATION_CNMF'
P value = 1e-05 (Fisher's exact test), Q value = 0.0024
Table S31. Gene #28: 'del_17q11.2' versus Molecular Subtype #1: 'CN_CNMF'
| nPatients | CLUS_1 | CLUS_2 | CLUS_3 | CLUS_4 | CLUS_5 |
|---|---|---|---|---|---|
| ALL | 15 | 24 | 55 | 43 | 23 |
| DEL PEAK 21(17Q11.2) MUTATED | 1 | 0 | 25 | 16 | 0 |
| DEL PEAK 21(17Q11.2) WILD-TYPE | 14 | 24 | 30 | 27 | 23 |
Figure S31. Get High-res Image Gene #28: 'del_17q11.2' versus Molecular Subtype #1: 'CN_CNMF'
P value = 1e-05 (Fisher's exact test), Q value = 0.0024
Table S32. Gene #29: 'del_22q13.31' versus Molecular Subtype #1: 'CN_CNMF'
| nPatients | CLUS_1 | CLUS_2 | CLUS_3 | CLUS_4 | CLUS_5 |
|---|---|---|---|---|---|
| ALL | 15 | 24 | 55 | 43 | 23 |
| DEL PEAK 22(22Q13.31) MUTATED | 6 | 6 | 39 | 11 | 2 |
| DEL PEAK 22(22Q13.31) WILD-TYPE | 9 | 18 | 16 | 32 | 21 |
Figure S32. Get High-res Image Gene #29: 'del_22q13.31' versus Molecular Subtype #1: 'CN_CNMF'
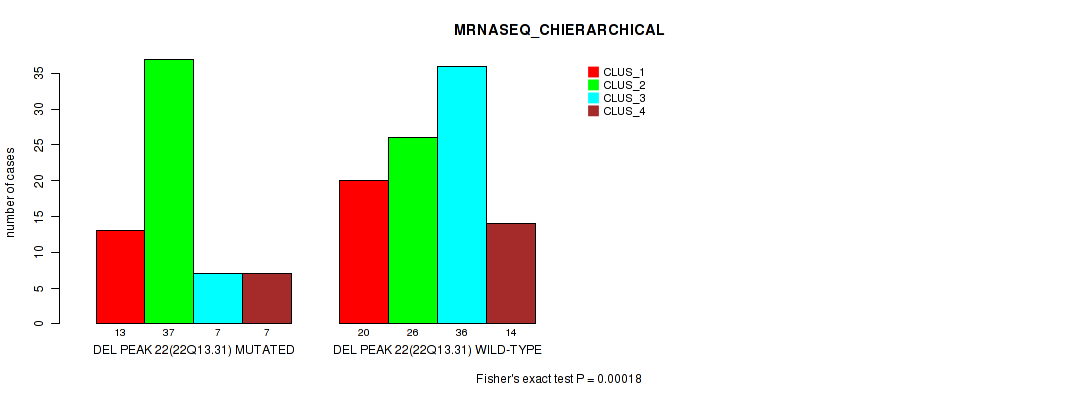
P value = 0.00018 (Fisher's exact test), Q value = 0.039
Table S33. Gene #29: 'del_22q13.31' versus Molecular Subtype #4: 'MRNASEQ_CHIERARCHICAL'
| nPatients | CLUS_1 | CLUS_2 | CLUS_3 | CLUS_4 |
|---|---|---|---|---|
| ALL | 33 | 63 | 43 | 21 |
| DEL PEAK 22(22Q13.31) MUTATED | 13 | 37 | 7 | 7 |
| DEL PEAK 22(22Q13.31) WILD-TYPE | 20 | 26 | 36 | 14 |
Figure S33. Get High-res Image Gene #29: 'del_22q13.31' versus Molecular Subtype #4: 'MRNASEQ_CHIERARCHICAL'
P value = 7e-04 (Fisher's exact test), Q value = 0.15
Table S34. Gene #29: 'del_22q13.31' versus Molecular Subtype #8: 'MIRSEQ_MATURE_CHIERARCHICAL'
| nPatients | CLUS_1 | CLUS_2 | CLUS_3 |
|---|---|---|---|
| ALL | 68 | 53 | 39 |
| DEL PEAK 22(22Q13.31) MUTATED | 16 | 30 | 18 |
| DEL PEAK 22(22Q13.31) WILD-TYPE | 52 | 23 | 21 |
Figure S34. Get High-res Image Gene #29: 'del_22q13.31' versus Molecular Subtype #8: 'MIRSEQ_MATURE_CHIERARCHICAL'

P value = 0.00062 (Fisher's exact test), Q value = 0.13
Table S35. Gene #30: 'del_xp21.1' versus Molecular Subtype #5: 'MIRSEQ_CNMF'
| nPatients | CLUS_1 | CLUS_2 | CLUS_3 |
|---|---|---|---|
| ALL | 64 | 57 | 39 |
| DEL PEAK 23(XP21.1) MUTATED | 13 | 27 | 6 |
| DEL PEAK 23(XP21.1) WILD-TYPE | 51 | 30 | 33 |
Figure S35. Get High-res Image Gene #30: 'del_xp21.1' versus Molecular Subtype #5: 'MIRSEQ_CNMF'
-
Copy number data file = transformed.cor.cli.txt
-
Molecular subtype file = PCPG-TP.transferedmergedcluster.txt
-
Number of patients = 160
-
Number of significantly focal cnvs = 30
-
Number of molecular subtypes = 8
-
Exclude genes that fewer than K tumors have alterations, K = 3
For binary or multi-class clinical features (nominal or ordinal), two-tailed Fisher's exact tests (Fisher 1922) were used to estimate the P values using the 'fisher.test' function in R
For multiple hypothesis correction, Q value is the False Discovery Rate (FDR) analogue of the P value (Benjamini and Hochberg 1995), defined as the minimum FDR at which the test may be called significant. We used the 'Benjamini and Hochberg' method of 'p.adjust' function in R to convert P values into Q values.
In addition to the links below, the full results of the analysis summarized in this report can also be downloaded programmatically using firehose_get, or interactively from either the Broad GDAC website or TCGA Data Coordination Center Portal.