This pipeline computes the correlation between significant arm-level copy number variations (cnvs) and molecular subtypes.
Testing the association between copy number variation 77 arm-level events and 8 molecular subtypes across 56 patients, one significant finding detected with P value < 0.05 and Q value < 0.25.
-
4q loss cnv correlated to 'MIRSEQ_CNMF'.
Table 1. Get Full Table Overview of the association between significant copy number variation of 77 arm-level events and 8 molecular subtypes. Shown in the table are P values (Q values). Thresholded by P value < 0.05 and Q value < 0.25, one significant finding detected.
|
Clinical Features |
CN CNMF |
METHLYATION CNMF |
MRNASEQ CNMF |
MRNASEQ CHIERARCHICAL |
MIRSEQ CNMF |
MIRSEQ CHIERARCHICAL |
MIRSEQ MATURE CNMF |
MIRSEQ MATURE CHIERARCHICAL |
||
| nCNV (%) | nWild-Type | Fisher's exact test | Fisher's exact test | Fisher's exact test | Fisher's exact test | Fisher's exact test | Fisher's exact test | Fisher's exact test | Fisher's exact test | |
| 4q loss | 33 (59%) | 23 |
0.0656 (1.00) |
0.0176 (1.00) |
0.00516 (1.00) |
0.0387 (1.00) |
0.0002 (0.123) |
0.249 (1.00) |
0.0184 (1.00) |
0.105 (1.00) |
| 1p gain | 24 (43%) | 32 |
0.0485 (1.00) |
0.754 (1.00) |
0.817 (1.00) |
0.902 (1.00) |
0.523 (1.00) |
0.281 (1.00) |
0.613 (1.00) |
0.719 (1.00) |
| 1q gain | 31 (55%) | 25 |
0.332 (1.00) |
0.766 (1.00) |
0.763 (1.00) |
0.621 (1.00) |
0.703 (1.00) |
0.462 (1.00) |
0.977 (1.00) |
0.322 (1.00) |
| 2p gain | 23 (41%) | 33 |
0.726 (1.00) |
0.00784 (1.00) |
0.0186 (1.00) |
0.0578 (1.00) |
0.492 (1.00) |
0.0724 (1.00) |
0.295 (1.00) |
0.159 (1.00) |
| 2q gain | 21 (38%) | 35 |
0.667 (1.00) |
0.0183 (1.00) |
0.012 (1.00) |
0.113 (1.00) |
0.622 (1.00) |
0.0486 (1.00) |
0.37 (1.00) |
0.172 (1.00) |
| 3p gain | 12 (21%) | 44 |
0.388 (1.00) |
0.263 (1.00) |
0.437 (1.00) |
0.2 (1.00) |
0.861 (1.00) |
0.265 (1.00) |
0.96 (1.00) |
0.639 (1.00) |
| 3q gain | 23 (41%) | 33 |
0.221 (1.00) |
0.0486 (1.00) |
0.194 (1.00) |
0.121 (1.00) |
0.496 (1.00) |
0.188 (1.00) |
0.514 (1.00) |
0.182 (1.00) |
| 4p gain | 9 (16%) | 47 |
1 (1.00) |
0.703 (1.00) |
0.824 (1.00) |
0.865 (1.00) |
0.775 (1.00) |
0.326 (1.00) |
0.822 (1.00) |
0.486 (1.00) |
| 4q gain | 3 (5%) | 53 |
0.581 (1.00) |
0.258 (1.00) |
0.514 (1.00) |
0.792 (1.00) |
0.676 (1.00) |
0.569 (1.00) |
0.687 (1.00) |
0.595 (1.00) |
| 5p gain | 23 (41%) | 33 |
0.396 (1.00) |
0.378 (1.00) |
0.451 (1.00) |
0.242 (1.00) |
0.741 (1.00) |
0.028 (1.00) |
0.912 (1.00) |
0.12 (1.00) |
| 5q gain | 8 (14%) | 48 |
0.78 (1.00) |
0.565 (1.00) |
0.308 (1.00) |
0.248 (1.00) |
0.0792 (1.00) |
0.154 (1.00) |
0.239 (1.00) |
0.164 (1.00) |
| 6p gain | 30 (54%) | 26 |
0.334 (1.00) |
0.522 (1.00) |
0.601 (1.00) |
0.416 (1.00) |
1 (1.00) |
0.474 (1.00) |
0.938 (1.00) |
0.32 (1.00) |
| 6q gain | 27 (48%) | 29 |
0.366 (1.00) |
0.209 (1.00) |
0.22 (1.00) |
0.163 (1.00) |
1 (1.00) |
0.19 (1.00) |
0.842 (1.00) |
0.196 (1.00) |
| 7p gain | 21 (38%) | 35 |
0.548 (1.00) |
0.558 (1.00) |
0.154 (1.00) |
0.28 (1.00) |
0.59 (1.00) |
0.128 (1.00) |
0.354 (1.00) |
0.367 (1.00) |
| 7q gain | 17 (30%) | 39 |
0.465 (1.00) |
0.841 (1.00) |
0.34 (1.00) |
0.808 (1.00) |
0.743 (1.00) |
0.166 (1.00) |
0.59 (1.00) |
0.47 (1.00) |
| 8p gain | 19 (34%) | 37 |
0.0127 (1.00) |
0.743 (1.00) |
0.442 (1.00) |
0.873 (1.00) |
0.971 (1.00) |
0.556 (1.00) |
0.835 (1.00) |
0.341 (1.00) |
| 8q gain | 30 (54%) | 26 |
0.00509 (1.00) |
0.196 (1.00) |
0.0491 (1.00) |
0.505 (1.00) |
0.218 (1.00) |
0.326 (1.00) |
0.215 (1.00) |
0.453 (1.00) |
| 9p gain | 6 (11%) | 50 |
0.466 (1.00) |
0.703 (1.00) |
0.936 (1.00) |
0.665 (1.00) |
0.833 (1.00) |
0.804 (1.00) |
0.8 (1.00) |
0.668 (1.00) |
| 10p gain | 21 (38%) | 35 |
0.935 (1.00) |
0.0198 (1.00) |
0.0404 (1.00) |
0.118 (1.00) |
0.326 (1.00) |
0.106 (1.00) |
0.516 (1.00) |
0.438 (1.00) |
| 10q gain | 17 (30%) | 39 |
1 (1.00) |
0.339 (1.00) |
0.553 (1.00) |
0.0475 (1.00) |
0.223 (1.00) |
0.181 (1.00) |
0.42 (1.00) |
0.263 (1.00) |
| 11p gain | 5 (9%) | 51 |
0.483 (1.00) |
0.441 (1.00) |
0.265 (1.00) |
0.85 (1.00) |
0.495 (1.00) |
0.119 (1.00) |
0.354 (1.00) |
0.352 (1.00) |
| 11q gain | 7 (12%) | 49 |
0.17 (1.00) |
0.386 (1.00) |
0.227 (1.00) |
0.379 (1.00) |
0.752 (1.00) |
0.0352 (1.00) |
0.726 (1.00) |
0.098 (1.00) |
| 12p gain | 22 (39%) | 34 |
0.478 (1.00) |
0.00457 (1.00) |
0.372 (1.00) |
0.042 (1.00) |
0.812 (1.00) |
0.977 (1.00) |
0.806 (1.00) |
0.716 (1.00) |
| 12q gain | 11 (20%) | 45 |
0.553 (1.00) |
0.533 (1.00) |
0.807 (1.00) |
0.522 (1.00) |
1 (1.00) |
0.295 (1.00) |
0.53 (1.00) |
0.632 (1.00) |
| 13q gain | 15 (27%) | 41 |
0.669 (1.00) |
0.0712 (1.00) |
0.0212 (1.00) |
0.0236 (1.00) |
0.223 (1.00) |
0.046 (1.00) |
0.0655 (1.00) |
0.192 (1.00) |
| 14q gain | 7 (12%) | 49 |
0.366 (1.00) |
0.575 (1.00) |
0.259 (1.00) |
0.26 (1.00) |
0.206 (1.00) |
0.733 (1.00) |
0.213 (1.00) |
0.457 (1.00) |
| 15q gain | 4 (7%) | 52 |
0.386 (1.00) |
0.256 (1.00) |
0.579 (1.00) |
0.325 (1.00) |
0.757 (1.00) |
0.348 (1.00) |
0.529 (1.00) |
0.413 (1.00) |
| 16p gain | 10 (18%) | 46 |
0.0397 (1.00) |
0.279 (1.00) |
0.195 (1.00) |
0.278 (1.00) |
1 (1.00) |
0.482 (1.00) |
0.718 (1.00) |
0.531 (1.00) |
| 16q gain | 6 (11%) | 50 |
0.267 (1.00) |
0.849 (1.00) |
0.548 (1.00) |
0.968 (1.00) |
0.77 (1.00) |
0.926 (1.00) |
0.916 (1.00) |
0.91 (1.00) |
| 17p gain | 9 (16%) | 47 |
0.216 (1.00) |
0.895 (1.00) |
0.568 (1.00) |
0.561 (1.00) |
0.284 (1.00) |
0.06 (1.00) |
0.271 (1.00) |
0.331 (1.00) |
| 17q gain | 18 (32%) | 38 |
0.93 (1.00) |
0.272 (1.00) |
0.701 (1.00) |
0.516 (1.00) |
0.392 (1.00) |
0.304 (1.00) |
0.731 (1.00) |
0.421 (1.00) |
| 18p gain | 18 (32%) | 38 |
1 (1.00) |
0.0495 (1.00) |
0.0927 (1.00) |
0.343 (1.00) |
0.146 (1.00) |
0.198 (1.00) |
0.422 (1.00) |
0.654 (1.00) |
| 18q gain | 14 (25%) | 42 |
0.659 (1.00) |
0.0806 (1.00) |
0.153 (1.00) |
0.241 (1.00) |
0.203 (1.00) |
0.0882 (1.00) |
0.211 (1.00) |
0.449 (1.00) |
| 19p gain | 24 (43%) | 32 |
0.523 (1.00) |
0.177 (1.00) |
0.268 (1.00) |
0.371 (1.00) |
0.537 (1.00) |
0.23 (1.00) |
0.422 (1.00) |
0.746 (1.00) |
| 19q gain | 28 (50%) | 28 |
0.385 (1.00) |
0.0771 (1.00) |
0.377 (1.00) |
0.396 (1.00) |
0.929 (1.00) |
0.899 (1.00) |
0.578 (1.00) |
1 (1.00) |
| 20p gain | 37 (66%) | 19 |
0.933 (1.00) |
0.504 (1.00) |
0.922 (1.00) |
0.761 (1.00) |
0.878 (1.00) |
0.695 (1.00) |
0.863 (1.00) |
0.824 (1.00) |
| 20q gain | 44 (79%) | 12 |
0.52 (1.00) |
0.918 (1.00) |
0.969 (1.00) |
0.996 (1.00) |
0.586 (1.00) |
0.575 (1.00) |
0.43 (1.00) |
0.739 (1.00) |
| 21q gain | 18 (32%) | 38 |
0.232 (1.00) |
0.377 (1.00) |
0.9 (1.00) |
0.892 (1.00) |
0.915 (1.00) |
0.574 (1.00) |
1 (1.00) |
0.969 (1.00) |
| 22q gain | 8 (14%) | 48 |
0.535 (1.00) |
0.96 (1.00) |
0.802 (1.00) |
0.926 (1.00) |
0.885 (1.00) |
0.943 (1.00) |
0.852 (1.00) |
0.989 (1.00) |
| xq gain | 14 (25%) | 42 |
0.922 (1.00) |
0.425 (1.00) |
0.879 (1.00) |
0.824 (1.00) |
0.961 (1.00) |
0.582 (1.00) |
1 (1.00) |
0.785 (1.00) |
| 1p loss | 9 (16%) | 47 |
0.052 (1.00) |
0.6 (1.00) |
0.921 (1.00) |
0.12 (1.00) |
0.11 (1.00) |
0.0301 (1.00) |
0.127 (1.00) |
0.0176 (1.00) |
| 1q loss | 9 (16%) | 47 |
0.0232 (1.00) |
0.515 (1.00) |
0.517 (1.00) |
0.0799 (1.00) |
0.42 (1.00) |
0.154 (1.00) |
0.385 (1.00) |
0.0308 (1.00) |
| 3p loss | 20 (36%) | 36 |
0.0711 (1.00) |
0.423 (1.00) |
0.0495 (1.00) |
0.229 (1.00) |
0.374 (1.00) |
0.928 (1.00) |
0.6 (1.00) |
0.406 (1.00) |
| 3q loss | 14 (25%) | 42 |
0.56 (1.00) |
0.46 (1.00) |
0.138 (1.00) |
0.604 (1.00) |
0.526 (1.00) |
0.881 (1.00) |
0.655 (1.00) |
0.075 (1.00) |
| 4p loss | 31 (55%) | 25 |
0.0586 (1.00) |
0.0625 (1.00) |
0.258 (1.00) |
0.202 (1.00) |
0.0372 (1.00) |
0.714 (1.00) |
0.287 (1.00) |
0.386 (1.00) |
| 5p loss | 9 (16%) | 47 |
0.713 (1.00) |
0.475 (1.00) |
0.884 (1.00) |
0.135 (1.00) |
1 (1.00) |
0.3 (1.00) |
1 (1.00) |
0.0452 (1.00) |
| 5q loss | 18 (32%) | 38 |
0.929 (1.00) |
0.304 (1.00) |
0.267 (1.00) |
0.232 (1.00) |
0.362 (1.00) |
0.948 (1.00) |
0.147 (1.00) |
0.841 (1.00) |
| 6p loss | 5 (9%) | 51 |
0.316 (1.00) |
0.956 (1.00) |
0.755 (1.00) |
0.956 (1.00) |
0.543 (1.00) |
0.912 (1.00) |
0.743 (1.00) |
0.615 (1.00) |
| 6q loss | 7 (12%) | 49 |
0.019 (1.00) |
0.696 (1.00) |
0.641 (1.00) |
0.901 (1.00) |
0.704 (1.00) |
0.617 (1.00) |
0.726 (1.00) |
0.449 (1.00) |
| 7p loss | 13 (23%) | 43 |
0.412 (1.00) |
0.666 (1.00) |
0.734 (1.00) |
0.501 (1.00) |
0.314 (1.00) |
0.455 (1.00) |
0.481 (1.00) |
0.761 (1.00) |
| 7q loss | 13 (23%) | 43 |
0.0861 (1.00) |
0.854 (1.00) |
0.921 (1.00) |
0.823 (1.00) |
0.711 (1.00) |
0.223 (1.00) |
0.639 (1.00) |
0.77 (1.00) |
| 8p loss | 23 (41%) | 33 |
0.0327 (1.00) |
0.982 (1.00) |
0.827 (1.00) |
0.746 (1.00) |
0.688 (1.00) |
0.514 (1.00) |
0.839 (1.00) |
0.854 (1.00) |
| 8q loss | 9 (16%) | 47 |
0.185 (1.00) |
0.76 (1.00) |
0.297 (1.00) |
0.714 (1.00) |
0.949 (1.00) |
0.757 (1.00) |
1 (1.00) |
0.856 (1.00) |
| 9p loss | 34 (61%) | 22 |
0.036 (1.00) |
0.00791 (1.00) |
0.673 (1.00) |
0.137 (1.00) |
0.864 (1.00) |
0.291 (1.00) |
0.869 (1.00) |
0.117 (1.00) |
| 9q loss | 39 (70%) | 17 |
0.0615 (1.00) |
0.0014 (0.86) |
0.494 (1.00) |
0.0384 (1.00) |
0.664 (1.00) |
0.117 (1.00) |
0.918 (1.00) |
0.382 (1.00) |
| 10p loss | 23 (41%) | 33 |
0.827 (1.00) |
0.0137 (1.00) |
0.0287 (1.00) |
0.185 (1.00) |
0.244 (1.00) |
0.788 (1.00) |
0.444 (1.00) |
0.855 (1.00) |
| 10q loss | 21 (38%) | 35 |
1 (1.00) |
0.298 (1.00) |
0.177 (1.00) |
0.172 (1.00) |
0.125 (1.00) |
0.473 (1.00) |
0.205 (1.00) |
0.847 (1.00) |
| 11p loss | 26 (46%) | 30 |
0.881 (1.00) |
0.00375 (1.00) |
0.379 (1.00) |
0.518 (1.00) |
0.27 (1.00) |
0.58 (1.00) |
0.238 (1.00) |
0.229 (1.00) |
| 11q loss | 24 (43%) | 32 |
0.774 (1.00) |
0.00808 (1.00) |
0.805 (1.00) |
0.896 (1.00) |
0.295 (1.00) |
0.59 (1.00) |
0.416 (1.00) |
0.375 (1.00) |
| 12p loss | 13 (23%) | 43 |
0.193 (1.00) |
0.277 (1.00) |
0.581 (1.00) |
0.732 (1.00) |
0.547 (1.00) |
0.582 (1.00) |
0.275 (1.00) |
0.491 (1.00) |
| 12q loss | 14 (25%) | 42 |
0.519 (1.00) |
0.88 (1.00) |
0.82 (1.00) |
0.917 (1.00) |
0.963 (1.00) |
0.908 (1.00) |
0.45 (1.00) |
0.959 (1.00) |
| 13q loss | 26 (46%) | 30 |
0.779 (1.00) |
0.00113 (0.695) |
0.058 (1.00) |
0.0276 (1.00) |
0.353 (1.00) |
0.121 (1.00) |
0.26 (1.00) |
0.248 (1.00) |
| 14q loss | 27 (48%) | 29 |
1 (1.00) |
0.092 (1.00) |
0.123 (1.00) |
0.124 (1.00) |
0.618 (1.00) |
0.899 (1.00) |
0.631 (1.00) |
0.947 (1.00) |
| 15q loss | 32 (57%) | 24 |
0.00528 (1.00) |
0.711 (1.00) |
0.931 (1.00) |
0.981 (1.00) |
0.931 (1.00) |
0.978 (1.00) |
0.892 (1.00) |
0.81 (1.00) |
| 16p loss | 32 (57%) | 24 |
0.404 (1.00) |
0.494 (1.00) |
0.345 (1.00) |
0.1 (1.00) |
0.81 (1.00) |
0.914 (1.00) |
0.894 (1.00) |
0.925 (1.00) |
| 16q loss | 37 (66%) | 19 |
0.32 (1.00) |
0.794 (1.00) |
0.45 (1.00) |
0.0894 (1.00) |
0.686 (1.00) |
0.922 (1.00) |
0.379 (1.00) |
0.915 (1.00) |
| 17p loss | 34 (61%) | 22 |
0.402 (1.00) |
0.286 (1.00) |
0.981 (1.00) |
0.757 (1.00) |
0.806 (1.00) |
0.891 (1.00) |
0.414 (1.00) |
0.784 (1.00) |
| 17q loss | 17 (30%) | 39 |
0.928 (1.00) |
0.357 (1.00) |
0.713 (1.00) |
0.384 (1.00) |
0.968 (1.00) |
0.213 (1.00) |
0.793 (1.00) |
0.622 (1.00) |
| 18p loss | 18 (32%) | 38 |
0.602 (1.00) |
0.0169 (1.00) |
0.0553 (1.00) |
0.0906 (1.00) |
0.0673 (1.00) |
0.0799 (1.00) |
0.326 (1.00) |
0.305 (1.00) |
| 18q loss | 20 (36%) | 36 |
0.215 (1.00) |
0.0707 (1.00) |
0.186 (1.00) |
0.119 (1.00) |
0.012 (1.00) |
0.0054 (1.00) |
0.063 (1.00) |
0.0309 (1.00) |
| 19p loss | 15 (27%) | 41 |
0.926 (1.00) |
0.466 (1.00) |
0.204 (1.00) |
0.356 (1.00) |
0.35 (1.00) |
0.718 (1.00) |
0.715 (1.00) |
0.362 (1.00) |
| 19q loss | 13 (23%) | 43 |
1 (1.00) |
0.152 (1.00) |
0.945 (1.00) |
0.616 (1.00) |
0.228 (1.00) |
0.872 (1.00) |
0.692 (1.00) |
0.35 (1.00) |
| 20p loss | 7 (12%) | 49 |
0.427 (1.00) |
0.207 (1.00) |
0.0829 (1.00) |
0.0751 (1.00) |
0.619 (1.00) |
0.693 (1.00) |
0.727 (1.00) |
0.758 (1.00) |
| 20q loss | 4 (7%) | 52 |
1 (1.00) |
0.602 (1.00) |
0.118 (1.00) |
0.471 (1.00) |
1 (1.00) |
0.885 (1.00) |
1 (1.00) |
0.854 (1.00) |
| 21q loss | 17 (30%) | 39 |
0.861 (1.00) |
0.178 (1.00) |
0.633 (1.00) |
0.748 (1.00) |
0.683 (1.00) |
0.972 (1.00) |
1 (1.00) |
0.946 (1.00) |
| 22q loss | 33 (59%) | 23 |
0.825 (1.00) |
0.969 (1.00) |
0.962 (1.00) |
0.901 (1.00) |
0.707 (1.00) |
0.29 (1.00) |
0.639 (1.00) |
0.616 (1.00) |
| xq loss | 19 (34%) | 37 |
0.457 (1.00) |
0.325 (1.00) |
0.323 (1.00) |
0.873 (1.00) |
0.53 (1.00) |
0.973 (1.00) |
0.548 (1.00) |
0.626 (1.00) |
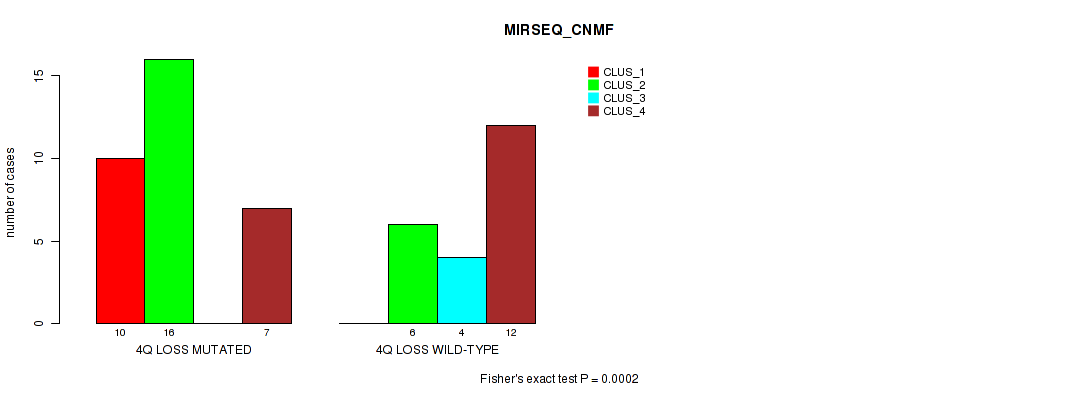
P value = 2e-04 (Fisher's exact test), Q value = 0.12
Table S1. Gene #45: '4q loss' versus Molecular Subtype #5: 'MIRSEQ_CNMF'
| nPatients | CLUS_1 | CLUS_2 | CLUS_3 | CLUS_4 |
|---|---|---|---|---|
| ALL | 10 | 22 | 4 | 19 |
| 4Q LOSS MUTATED | 10 | 16 | 0 | 7 |
| 4Q LOSS WILD-TYPE | 0 | 6 | 4 | 12 |
Figure S1. Get High-res Image Gene #45: '4q loss' versus Molecular Subtype #5: 'MIRSEQ_CNMF'
-
Copy number data file = transformed.cor.cli.txt
-
Molecular subtypes file = UCS-TP.transferedmergedcluster.txt
-
Number of patients = 56
-
Number of significantly arm-level cnvs = 77
-
Number of molecular subtypes = 8
-
Exclude genes that fewer than K tumors have mutations, K = 3
For binary or multi-class clinical features (nominal or ordinal), two-tailed Fisher's exact tests (Fisher 1922) were used to estimate the P values using the 'fisher.test' function in R
For multiple hypothesis correction, Q value is the False Discovery Rate (FDR) analogue of the P value (Benjamini and Hochberg 1995), defined as the minimum FDR at which the test may be called significant. We used the 'Benjamini and Hochberg' method of 'p.adjust' function in R to convert P values into Q values.
In addition to the links below, the full results of the analysis summarized in this report can also be downloaded programmatically using firehose_get, or interactively from either the Broad GDAC website or TCGA Data Coordination Center Portal.