This pipeline computes the correlation between significant arm-level copy number variations (cnvs) and molecular subtypes.
Testing the association between copy number variation 65 arm-level events and 7 molecular subtypes across 36 patients, one significant finding detected with P value < 0.05 and Q value < 0.25.
-
6q loss cnv correlated to 'CN_CNMF'.
Table 1. Get Full Table Overview of the association between significant copy number variation of 65 arm-level events and 7 molecular subtypes. Shown in the table are P values (Q values). Thresholded by P value < 0.05 and Q value < 0.25, one significant finding detected.
|
Clinical Features |
CN CNMF |
MRNASEQ CNMF |
MRNASEQ CHIERARCHICAL |
MIRSEQ CNMF |
MIRSEQ CHIERARCHICAL |
MIRSEQ MATURE CNMF |
MIRSEQ MATURE CHIERARCHICAL |
||
| nCNV (%) | nWild-Type | Fisher's exact test | Fisher's exact test | Fisher's exact test | Fisher's exact test | Fisher's exact test | Fisher's exact test | Fisher's exact test | |
| 6q loss | 20 (56%) | 16 |
0.000242 (0.11) |
0.189 (1.00) |
0.143 (1.00) |
0.21 (1.00) |
0.254 (1.00) |
0.32 (1.00) |
0.411 (1.00) |
| 1p gain | 10 (28%) | 26 |
0.139 (1.00) |
0.637 (1.00) |
0.555 (1.00) |
0.11 (1.00) |
0.263 (1.00) |
0.26 (1.00) |
0.685 (1.00) |
| 1q gain | 21 (58%) | 15 |
0.516 (1.00) |
0.692 (1.00) |
0.236 (1.00) |
0.112 (1.00) |
0.179 (1.00) |
0.736 (1.00) |
0.591 (1.00) |
| 2p gain | 6 (17%) | 30 |
0.662 (1.00) |
1 (1.00) |
0.923 (1.00) |
0.366 (1.00) |
0.546 (1.00) |
1 (1.00) |
0.6 (1.00) |
| 2q gain | 6 (17%) | 30 |
0.182 (1.00) |
0.523 (1.00) |
0.503 (1.00) |
0.37 (1.00) |
0.399 (1.00) |
1 (1.00) |
0.599 (1.00) |
| 3p gain | 3 (8%) | 33 |
0.231 (1.00) |
0.324 (1.00) |
0.157 (1.00) |
0.336 (1.00) |
0.237 (1.00) |
0.0637 (1.00) |
0.578 (1.00) |
| 3q gain | 8 (22%) | 28 |
0.236 (1.00) |
0.0997 (1.00) |
0.0979 (1.00) |
0.538 (1.00) |
0.667 (1.00) |
1 (1.00) |
0.397 (1.00) |
| 4p gain | 3 (8%) | 33 |
1 (1.00) |
1 (1.00) |
0.792 (1.00) |
0.767 (1.00) |
0.422 (1.00) |
0.559 (1.00) |
1 (1.00) |
| 5p gain | 12 (33%) | 24 |
1 (1.00) |
0.612 (1.00) |
0.977 (1.00) |
0.767 (1.00) |
1 (1.00) |
1 (1.00) |
0.762 (1.00) |
| 5q gain | 12 (33%) | 24 |
1 (1.00) |
0.614 (1.00) |
0.977 (1.00) |
0.763 (1.00) |
1 (1.00) |
1 (1.00) |
0.763 (1.00) |
| 6p gain | 7 (19%) | 29 |
0.684 (1.00) |
0.367 (1.00) |
0.894 (1.00) |
0.187 (1.00) |
0.317 (1.00) |
0.674 (1.00) |
0.239 (1.00) |
| 7p gain | 7 (19%) | 29 |
0.684 (1.00) |
0.208 (1.00) |
0.387 (1.00) |
0.372 (1.00) |
0.567 (1.00) |
0.674 (1.00) |
0.0189 (1.00) |
| 7q gain | 6 (17%) | 30 |
1 (1.00) |
0.449 (1.00) |
0.535 (1.00) |
0.686 (1.00) |
0.821 (1.00) |
1 (1.00) |
0.00763 (1.00) |
| 8p gain | 6 (17%) | 30 |
1 (1.00) |
0.332 (1.00) |
0.167 (1.00) |
0.204 (1.00) |
0.366 (1.00) |
0.367 (1.00) |
0.116 (1.00) |
| 8q gain | 12 (33%) | 24 |
1 (1.00) |
0.172 (1.00) |
0.541 (1.00) |
0.182 (1.00) |
0.167 (1.00) |
0.721 (1.00) |
0.131 (1.00) |
| 10p gain | 5 (14%) | 31 |
1 (1.00) |
0.834 (1.00) |
0.0755 (1.00) |
0.788 (1.00) |
0.933 (1.00) |
0.63 (1.00) |
0.862 (1.00) |
| 11p gain | 4 (11%) | 32 |
0.605 (1.00) |
0.202 (1.00) |
0.0052 (1.00) |
0.741 (1.00) |
0.745 (1.00) |
0.287 (1.00) |
0.187 (1.00) |
| 11q gain | 4 (11%) | 32 |
0.605 (1.00) |
0.202 (1.00) |
0.00541 (1.00) |
0.74 (1.00) |
0.748 (1.00) |
0.287 (1.00) |
0.188 (1.00) |
| 12p gain | 9 (25%) | 27 |
1 (1.00) |
1 (1.00) |
0.907 (1.00) |
0.462 (1.00) |
0.84 (1.00) |
0.443 (1.00) |
0.335 (1.00) |
| 12q gain | 8 (22%) | 28 |
1 (1.00) |
0.88 (1.00) |
0.983 (1.00) |
0.437 (1.00) |
0.825 (1.00) |
0.236 (1.00) |
0.629 (1.00) |
| 13q gain | 3 (8%) | 33 |
0.231 (1.00) |
0.0428 (1.00) |
0.0397 (1.00) |
0.395 (1.00) |
0.889 (1.00) |
1 (1.00) |
0.0243 (1.00) |
| 15q gain | 6 (17%) | 30 |
0.662 (1.00) |
0.863 (1.00) |
0.659 (1.00) |
0.193 (1.00) |
0.437 (1.00) |
0.677 (1.00) |
0.00928 (1.00) |
| 16p gain | 7 (19%) | 29 |
0.0918 (1.00) |
0.661 (1.00) |
0.64 (1.00) |
0.374 (1.00) |
0.915 (1.00) |
0.674 (1.00) |
0.297 (1.00) |
| 16q gain | 5 (14%) | 31 |
0.342 (1.00) |
1 (1.00) |
0.623 (1.00) |
0.921 (1.00) |
0.933 (1.00) |
1 (1.00) |
0.927 (1.00) |
| 17p gain | 3 (8%) | 33 |
1 (1.00) |
0.774 (1.00) |
0.214 (1.00) |
0.683 (1.00) |
0.611 (1.00) |
0.559 (1.00) |
0.578 (1.00) |
| 17q gain | 7 (19%) | 29 |
1 (1.00) |
0.496 (1.00) |
0.255 (1.00) |
0.936 (1.00) |
1 (1.00) |
0.418 (1.00) |
0.521 (1.00) |
| 18p gain | 7 (19%) | 29 |
1 (1.00) |
0.663 (1.00) |
0.762 (1.00) |
0.482 (1.00) |
0.88 (1.00) |
0.418 (1.00) |
0.846 (1.00) |
| 18q gain | 6 (17%) | 30 |
0.391 (1.00) |
0.0708 (1.00) |
0.569 (1.00) |
0.194 (1.00) |
0.437 (1.00) |
0.677 (1.00) |
0.391 (1.00) |
| 19p gain | 6 (17%) | 30 |
0.662 (1.00) |
0.627 (1.00) |
0.659 (1.00) |
0.58 (1.00) |
0.437 (1.00) |
0.0628 (1.00) |
1 (1.00) |
| 19q gain | 6 (17%) | 30 |
0.662 (1.00) |
0.625 (1.00) |
0.659 (1.00) |
0.583 (1.00) |
0.435 (1.00) |
0.0628 (1.00) |
1 (1.00) |
| 20p gain | 11 (31%) | 25 |
1 (1.00) |
0.724 (1.00) |
0.423 (1.00) |
0.237 (1.00) |
0.281 (1.00) |
0.465 (1.00) |
0.343 (1.00) |
| 20q gain | 12 (33%) | 24 |
0.732 (1.00) |
0.754 (1.00) |
0.284 (1.00) |
0.142 (1.00) |
0.149 (1.00) |
0.499 (1.00) |
0.225 (1.00) |
| 21q gain | 3 (8%) | 33 |
1 (1.00) |
0.458 (1.00) |
0.886 (1.00) |
0.184 (1.00) |
0.708 (1.00) |
0.25 (1.00) |
0.133 (1.00) |
| 22q gain | 5 (14%) | 31 |
0.342 (1.00) |
0.0864 (1.00) |
0.284 (1.00) |
0.851 (1.00) |
0.935 (1.00) |
1 (1.00) |
0.926 (1.00) |
| 1p loss | 4 (11%) | 32 |
1 (1.00) |
0.656 (1.00) |
0.613 (1.00) |
0.816 (1.00) |
0.796 (1.00) |
0.626 (1.00) |
0.81 (1.00) |
| 3p loss | 22 (61%) | 14 |
0.00222 (1.00) |
0.616 (1.00) |
0.0119 (1.00) |
0.774 (1.00) |
0.585 (1.00) |
0.499 (1.00) |
0.991 (1.00) |
| 3q loss | 3 (8%) | 33 |
0.593 (1.00) |
0.167 (1.00) |
0.0219 (1.00) |
0.683 (1.00) |
0.611 (1.00) |
0.559 (1.00) |
0.396 (1.00) |
| 4p loss | 10 (28%) | 26 |
0.274 (1.00) |
0.223 (1.00) |
0.323 (1.00) |
0.783 (1.00) |
0.647 (1.00) |
0.709 (1.00) |
0.288 (1.00) |
| 4q loss | 13 (36%) | 23 |
1 (1.00) |
0.37 (1.00) |
0.388 (1.00) |
0.459 (1.00) |
0.837 (1.00) |
0.736 (1.00) |
0.363 (1.00) |
| 6p loss | 5 (14%) | 31 |
0.65 (1.00) |
0.703 (1.00) |
0.982 (1.00) |
0.371 (1.00) |
0.241 (1.00) |
0.63 (1.00) |
0.982 (1.00) |
| 7p loss | 4 (11%) | 32 |
0.605 (1.00) |
0.43 (1.00) |
0.283 (1.00) |
0.516 (1.00) |
0.905 (1.00) |
1 (1.00) |
0.859 (1.00) |
| 7q loss | 4 (11%) | 32 |
1 (1.00) |
0.429 (1.00) |
0.283 (1.00) |
0.321 (1.00) |
0.276 (1.00) |
0.287 (1.00) |
0.391 (1.00) |
| 8p loss | 10 (28%) | 26 |
0.717 (1.00) |
0.0176 (1.00) |
0.0777 (1.00) |
0.0944 (1.00) |
0.0365 (1.00) |
0.26 (1.00) |
0.173 (1.00) |
| 8q loss | 3 (8%) | 33 |
0.593 (1.00) |
0.244 (1.00) |
0.792 (1.00) |
0.769 (1.00) |
0.0761 (1.00) |
1 (1.00) |
0.135 (1.00) |
| 9p loss | 18 (50%) | 18 |
1 (1.00) |
0.694 (1.00) |
0.296 (1.00) |
0.188 (1.00) |
0.126 (1.00) |
0.5 (1.00) |
0.591 (1.00) |
| 9q loss | 19 (53%) | 17 |
1 (1.00) |
0.579 (1.00) |
0.133 (1.00) |
0.708 (1.00) |
0.367 (1.00) |
0.192 (1.00) |
0.604 (1.00) |
| 10p loss | 6 (17%) | 30 |
1 (1.00) |
0.732 (1.00) |
0.36 (1.00) |
0.579 (1.00) |
0.774 (1.00) |
0.677 (1.00) |
0.0147 (1.00) |
| 10q loss | 5 (14%) | 31 |
0.167 (1.00) |
0.41 (1.00) |
0.982 (1.00) |
0.849 (1.00) |
0.695 (1.00) |
1 (1.00) |
0.555 (1.00) |
| 11p loss | 8 (22%) | 28 |
0.434 (1.00) |
0.207 (1.00) |
0.532 (1.00) |
1 (1.00) |
0.84 (1.00) |
0.694 (1.00) |
0.393 (1.00) |
| 11q loss | 9 (25%) | 27 |
0.255 (1.00) |
0.0738 (1.00) |
0.473 (1.00) |
0.765 (1.00) |
0.583 (1.00) |
0.705 (1.00) |
0.759 (1.00) |
| 12q loss | 3 (8%) | 33 |
0.231 (1.00) |
0.325 (1.00) |
0.157 (1.00) |
0.607 (1.00) |
1 (1.00) |
1 (1.00) |
0.396 (1.00) |
| 13q loss | 15 (42%) | 21 |
1 (1.00) |
0.629 (1.00) |
0.745 (1.00) |
0.753 (1.00) |
0.313 (1.00) |
0.736 (1.00) |
0.331 (1.00) |
| 14q loss | 13 (36%) | 23 |
0.014 (1.00) |
1 (1.00) |
0.044 (1.00) |
1 (1.00) |
0.909 (1.00) |
0.484 (1.00) |
0.279 (1.00) |
| 15q loss | 5 (14%) | 31 |
0.342 (1.00) |
0.0857 (1.00) |
0.287 (1.00) |
0.51 (1.00) |
0.756 (1.00) |
0.63 (1.00) |
0.982 (1.00) |
| 16p loss | 4 (11%) | 32 |
1 (1.00) |
0.806 (1.00) |
1 (1.00) |
0.74 (1.00) |
0.966 (1.00) |
0.626 (1.00) |
0.186 (1.00) |
| 16q loss | 7 (19%) | 29 |
0.684 (1.00) |
0.662 (1.00) |
0.412 (1.00) |
0.66 (1.00) |
0.0191 (1.00) |
1 (1.00) |
0.664 (1.00) |
| 17p loss | 10 (28%) | 26 |
0.717 (1.00) |
0.114 (1.00) |
0.352 (1.00) |
0.254 (1.00) |
0.29 (1.00) |
1 (1.00) |
0.14 (1.00) |
| 18p loss | 6 (17%) | 30 |
1 (1.00) |
0.448 (1.00) |
0.604 (1.00) |
0.239 (1.00) |
0.571 (1.00) |
0.367 (1.00) |
0.31 (1.00) |
| 18q loss | 8 (22%) | 28 |
0.236 (1.00) |
0.101 (1.00) |
0.612 (1.00) |
0.134 (1.00) |
0.251 (1.00) |
0.424 (1.00) |
0.0645 (1.00) |
| 19p loss | 4 (11%) | 32 |
0.605 (1.00) |
0.145 (1.00) |
0.683 (1.00) |
0.0504 (1.00) |
0.241 (1.00) |
0.125 (1.00) |
0.00844 (1.00) |
| 19q loss | 3 (8%) | 33 |
1 (1.00) |
0.326 (1.00) |
0.73 (1.00) |
0.862 (1.00) |
1 (1.00) |
1 (1.00) |
0.579 (1.00) |
| 20p loss | 5 (14%) | 31 |
1 (1.00) |
0.0315 (1.00) |
0.522 (1.00) |
0.0963 (1.00) |
0.415 (1.00) |
0.376 (1.00) |
0.0114 (1.00) |
| 21q loss | 15 (42%) | 21 |
0.311 (1.00) |
0.133 (1.00) |
0.288 (1.00) |
0.336 (1.00) |
0.63 (1.00) |
0.31 (1.00) |
0.688 (1.00) |
| 22q loss | 5 (14%) | 31 |
0.65 (1.00) |
0.329 (1.00) |
0.154 (1.00) |
0.674 (1.00) |
0.805 (1.00) |
0.376 (1.00) |
0.401 (1.00) |
| xq loss | 15 (42%) | 21 |
0.00185 (0.84) |
1 (1.00) |
0.266 (1.00) |
0.574 (1.00) |
0.962 (1.00) |
0.501 (1.00) |
0.996 (1.00) |
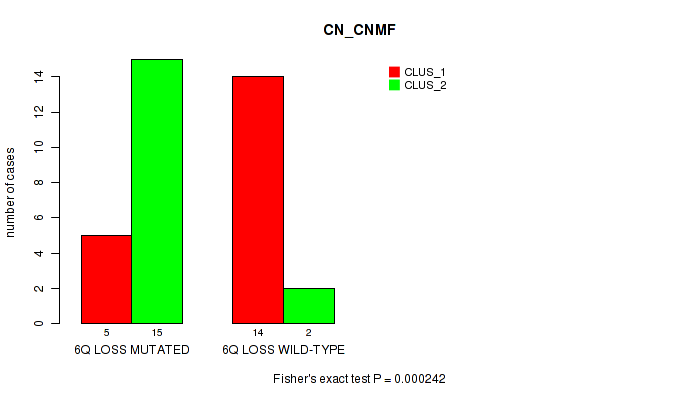
P value = 0.000242 (Fisher's exact test), Q value = 0.11
Table S1. Gene #40: '6q loss' versus Molecular Subtype #1: 'CN_CNMF'
| nPatients | CLUS_1 | CLUS_2 |
|---|---|---|
| ALL | 19 | 17 |
| 6Q LOSS MUTATED | 5 | 15 |
| 6Q LOSS WILD-TYPE | 14 | 2 |
Figure S1. Get High-res Image Gene #40: '6q loss' versus Molecular Subtype #1: 'CN_CNMF'
-
Copy number data file = transformed.cor.cli.txt
-
Molecular subtypes file = CHOL-TP.transferedmergedcluster.txt
-
Number of patients = 36
-
Number of significantly arm-level cnvs = 65
-
Number of molecular subtypes = 7
-
Exclude genes that fewer than K tumors have mutations, K = 3
For binary or multi-class clinical features (nominal or ordinal), two-tailed Fisher's exact tests (Fisher 1922) were used to estimate the P values using the 'fisher.test' function in R
For multiple hypothesis correction, Q value is the False Discovery Rate (FDR) analogue of the P value (Benjamini and Hochberg 1995), defined as the minimum FDR at which the test may be called significant. We used the 'Benjamini and Hochberg' method of 'p.adjust' function in R to convert P values into Q values.
In addition to the links below, the full results of the analysis summarized in this report can also be downloaded programmatically using firehose_get, or interactively from either the Broad GDAC website or TCGA Data Coordination Center Portal.