This pipeline computes the correlation between significant copy number variation (cnv focal) genes and molecular subtypes.
Testing the association between copy number variation 40 focal events and 8 molecular subtypes across 48 patients, 3 significant findings detected with P value < 0.05 and Q value < 0.25.
-
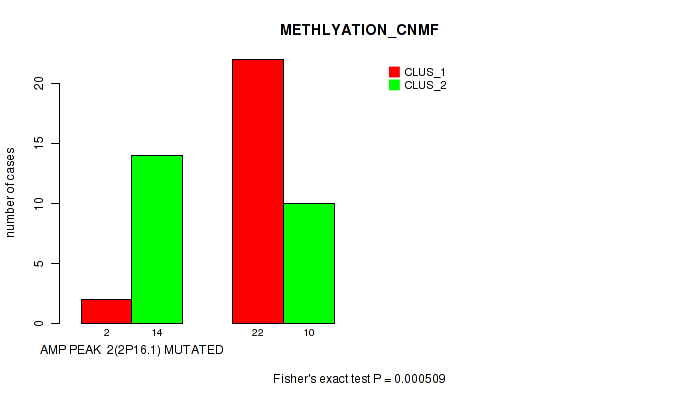
amp_2p16.1 cnv correlated to 'METHLYATION_CNMF'.
-
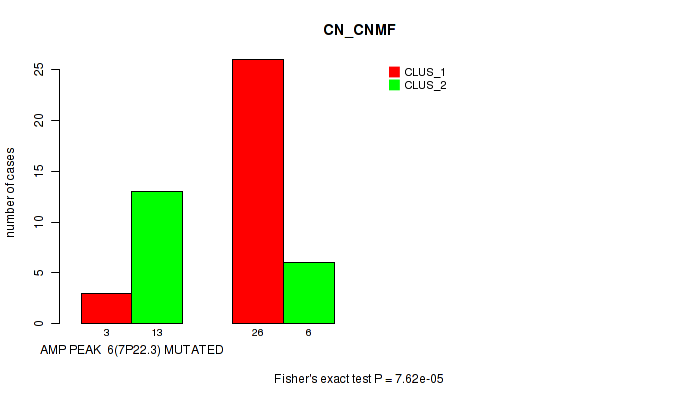
amp_7p22.3 cnv correlated to 'CN_CNMF'.
-
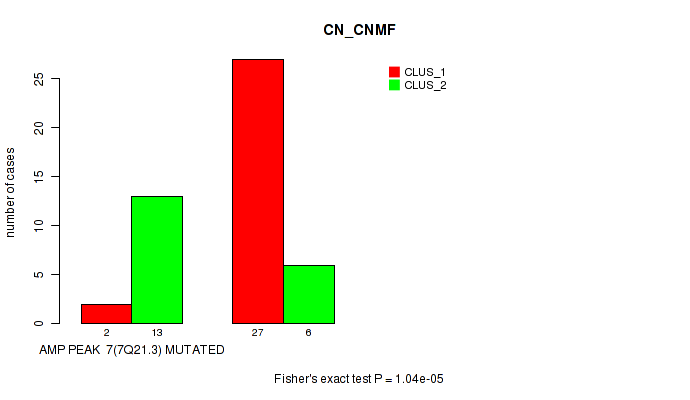
amp_7q21.3 cnv correlated to 'CN_CNMF'.
Table 1. Get Full Table Overview of the association between significant copy number variation of 40 focal events and 8 molecular subtypes. Shown in the table are P values (Q values). Thresholded by P value < 0.05 and Q value < 0.25, 3 significant findings detected.
|
Clinical Features |
CN CNMF |
METHLYATION CNMF |
MRNASEQ CNMF |
MRNASEQ CHIERARCHICAL |
MIRSEQ CNMF |
MIRSEQ CHIERARCHICAL |
MIRSEQ MATURE CNMF |
MIRSEQ MATURE CHIERARCHICAL |
||
| nCNV (%) | nWild-Type | Fisher's exact test | Fisher's exact test | Fisher's exact test | Fisher's exact test | Fisher's exact test | Fisher's exact test | Fisher's exact test | Fisher's exact test | |
| amp 2p16 1 | 16 (33%) | 32 |
0.124 (1.00) |
0.000509 (0.158) |
0.686 (1.00) |
0.75 (1.00) |
0.0574 (1.00) |
0.0126 (1.00) |
0.335 (1.00) |
0.469 (1.00) |
| amp 7p22 3 | 16 (33%) | 32 |
7.62e-05 (0.0238) |
0.359 (1.00) |
1 (1.00) |
0.652 (1.00) |
0.924 (1.00) |
0.887 (1.00) |
1 (1.00) |
0.124 (1.00) |
| amp 7q21 3 | 15 (31%) | 33 |
1.04e-05 (0.00325) |
1 (1.00) |
0.67 (1.00) |
0.121 (1.00) |
0.513 (1.00) |
0.888 (1.00) |
0.742 (1.00) |
0.44 (1.00) |
| amp 1q24 2 | 16 (33%) | 32 |
0.00524 (1.00) |
1 (1.00) |
0.41 (1.00) |
0.226 (1.00) |
0.776 (1.00) |
0.458 (1.00) |
1 (1.00) |
1 (1.00) |
| amp 3q27 3 | 14 (29%) | 34 |
0.008 (1.00) |
0.341 (1.00) |
0.396 (1.00) |
0.72 (1.00) |
0.71 (1.00) |
0.291 (1.00) |
0.516 (1.00) |
0.373 (1.00) |
| amp 3q29 | 15 (31%) | 33 |
0.00324 (0.998) |
0.212 (1.00) |
0.655 (1.00) |
1 (1.00) |
0.88 (1.00) |
0.296 (1.00) |
1 (1.00) |
0.204 (1.00) |
| amp 5p13 1 | 8 (17%) | 40 |
1 (1.00) |
0.701 (1.00) |
1 (1.00) |
0.451 (1.00) |
0.591 (1.00) |
0.673 (1.00) |
0.187 (1.00) |
|
| amp 8q24 23 | 14 (29%) | 34 |
1 (1.00) |
0.752 (1.00) |
0.639 (1.00) |
0.676 (1.00) |
0.49 (1.00) |
0.197 (1.00) |
0.726 (1.00) |
0.344 (1.00) |
| amp 12q21 1 | 14 (29%) | 34 |
0.517 (1.00) |
0.0243 (1.00) |
1 (1.00) |
0.123 (1.00) |
0.68 (1.00) |
0.0725 (1.00) |
0.323 (1.00) |
0.729 (1.00) |
| amp 16p12 2 | 10 (21%) | 38 |
0.00818 (1.00) |
0.0723 (1.00) |
0.173 (1.00) |
0.342 (1.00) |
0.0693 (1.00) |
0.0479 (1.00) |
1 (1.00) |
0.616 (1.00) |
| amp 18q21 2 | 16 (33%) | 32 |
0.0306 (1.00) |
0.76 (1.00) |
0.655 (1.00) |
1 (1.00) |
0.215 (1.00) |
0.0296 (1.00) |
0.335 (1.00) |
0.112 (1.00) |
| amp 19q13 43 | 10 (21%) | 38 |
1 (1.00) |
0.286 (1.00) |
0.583 (1.00) |
1 (1.00) |
0.269 (1.00) |
0.278 (1.00) |
0.709 (1.00) |
0.0551 (1.00) |
| amp xq27 3 | 7 (15%) | 41 |
0.0967 (1.00) |
0.0971 (1.00) |
0.655 (1.00) |
0.704 (1.00) |
0.328 (1.00) |
0.0812 (1.00) |
0.682 (1.00) |
0.328 (1.00) |
| del 1p36 32 | 11 (23%) | 37 |
0.0155 (1.00) |
1 (1.00) |
1 (1.00) |
0.518 (1.00) |
0.554 (1.00) |
0.703 (1.00) |
1 (1.00) |
0.44 (1.00) |
| del 1p13 1 | 12 (25%) | 36 |
0.501 (1.00) |
0.74 (1.00) |
0.67 (1.00) |
0.275 (1.00) |
0.56 (1.00) |
0.763 (1.00) |
1 (1.00) |
0.577 (1.00) |
| del 1q43 | 10 (21%) | 38 |
0.0363 (1.00) |
0.724 (1.00) |
1 (1.00) |
1 (1.00) |
0.717 (1.00) |
0.841 (1.00) |
1 (1.00) |
0.612 (1.00) |
| del 2q23 1 | 8 (17%) | 40 |
0.236 (1.00) |
1 (1.00) |
1 (1.00) |
0.516 (1.00) |
0.779 (1.00) |
0.526 (1.00) |
0.673 (1.00) |
0.62 (1.00) |
| del 3p21 31 | 8 (17%) | 40 |
0.451 (1.00) |
0.701 (1.00) |
0.484 (1.00) |
0.234 (1.00) |
0.775 (1.00) |
0.214 (1.00) |
0.444 (1.00) |
|
| del 4q35 1 | 10 (21%) | 38 |
0.487 (1.00) |
0.724 (1.00) |
0.639 (1.00) |
0.544 (1.00) |
0.349 (1.00) |
0.153 (1.00) |
0.149 (1.00) |
0.371 (1.00) |
| del 5q33 3 | 4 (8%) | 44 |
0.286 (1.00) |
0.609 (1.00) |
1 (1.00) |
0.033 (1.00) |
0.255 (1.00) |
0.00756 (1.00) |
0.313 (1.00) |
0.742 (1.00) |
| del 6p21 32 | 6 (12%) | 42 |
1 (1.00) |
1 (1.00) |
0.583 (1.00) |
0.761 (1.00) |
0.699 (1.00) |
0.522 (1.00) |
0.644 (1.00) |
0.325 (1.00) |
| del 6q14 1 | 17 (35%) | 31 |
0.221 (1.00) |
0.547 (1.00) |
0.435 (1.00) |
0.325 (1.00) |
0.195 (1.00) |
0.178 (1.00) |
0.00321 (0.993) |
0.121 (1.00) |
| del 6q22 32 | 16 (33%) | 32 |
0.759 (1.00) |
0.0305 (1.00) |
0.396 (1.00) |
0.389 (1.00) |
0.37 (1.00) |
0.368 (1.00) |
0.0494 (1.00) |
0.107 (1.00) |
| del 6q23 3 | 16 (33%) | 32 |
1 (1.00) |
0.0305 (1.00) |
0.0836 (1.00) |
0.0221 (1.00) |
0.174 (1.00) |
0.168 (1.00) |
0.0231 (1.00) |
0.258 (1.00) |
| del 7q33 | 5 (10%) | 43 |
0.372 (1.00) |
1 (1.00) |
0.464 (1.00) |
0.431 (1.00) |
0.18 (1.00) |
0.644 (1.00) |
0.346 (1.00) |
|
| del 8p23 2 | 12 (25%) | 36 |
0.00616 (1.00) |
0.74 (1.00) |
0.311 (1.00) |
0.354 (1.00) |
0.601 (1.00) |
0.0811 (1.00) |
0.707 (1.00) |
0.928 (1.00) |
| del 8q12 1 | 9 (19%) | 39 |
0.127 (1.00) |
0.461 (1.00) |
0.311 (1.00) |
0.357 (1.00) |
0.498 (1.00) |
0.407 (1.00) |
1 (1.00) |
0.576 (1.00) |
| del 9p21 3 | 17 (35%) | 31 |
0.221 (1.00) |
0.0145 (1.00) |
0.114 (1.00) |
0.328 (1.00) |
0.00944 (1.00) |
0.0297 (1.00) |
0.0547 (1.00) |
0.108 (1.00) |
| del 10q23 31 | 8 (17%) | 40 |
0.236 (1.00) |
1 (1.00) |
0.639 (1.00) |
0.0381 (1.00) |
0.0627 (1.00) |
0.678 (1.00) |
0.428 (1.00) |
0.0231 (1.00) |
| del 12p13 2 | 8 (17%) | 40 |
0.0446 (1.00) |
0.701 (1.00) |
1 (1.00) |
1 (1.00) |
0.662 (1.00) |
0.956 (1.00) |
1 (1.00) |
0.845 (1.00) |
| del 13q14 2 | 7 (15%) | 41 |
0.0967 (1.00) |
0.416 (1.00) |
1 (1.00) |
0.762 (1.00) |
0.19 (1.00) |
0.249 (1.00) |
1 (1.00) |
0.652 (1.00) |
| del 15q21 1 | 13 (27%) | 35 |
0.741 (1.00) |
0.517 (1.00) |
1 (1.00) |
0.653 (1.00) |
0.49 (1.00) |
0.666 (1.00) |
0.726 (1.00) |
0.333 (1.00) |
| del 16p13 13 | 6 (12%) | 42 |
0.197 (1.00) |
0.666 (1.00) |
0.311 (1.00) |
0.81 (1.00) |
0.327 (1.00) |
0.0281 (1.00) |
0.613 (1.00) |
0.63 (1.00) |
| del 16q23 1 | 5 (10%) | 43 |
0.0724 (1.00) |
1 (1.00) |
0.639 (1.00) |
0.448 (1.00) |
0.0915 (1.00) |
0.165 (1.00) |
0.114 (1.00) |
0.761 (1.00) |
| del 17p13 1 | 13 (27%) | 35 |
0.00227 (0.703) |
0.517 (1.00) |
1 (1.00) |
1 (1.00) |
0.648 (1.00) |
0.509 (1.00) |
1 (1.00) |
0.613 (1.00) |
| del 17q24 1 | 8 (17%) | 40 |
0.236 (1.00) |
0.0479 (1.00) |
1 (1.00) |
0.0437 (1.00) |
0.637 (1.00) |
0.0289 (1.00) |
0.214 (1.00) |
0.149 (1.00) |
| del 19p13 2 | 4 (8%) | 44 |
1 (1.00) |
1 (1.00) |
0.484 (1.00) |
1 (1.00) |
0.427 (1.00) |
1 (1.00) |
0.663 (1.00) |
|
| del 19q13 2 | 5 (10%) | 43 |
1 (1.00) |
0.348 (1.00) |
0.484 (1.00) |
1 (1.00) |
0.66 (1.00) |
0.581 (1.00) |
0.723 (1.00) |
|
| del 22q13 31 | 7 (15%) | 41 |
0.0967 (1.00) |
1 (1.00) |
1 (1.00) |
1 (1.00) |
0.947 (1.00) |
0.906 (1.00) |
1 (1.00) |
0.619 (1.00) |
| del xq28 | 3 (6%) | 45 |
0.056 (1.00) |
0.234 (1.00) |
0.464 (1.00) |
0.474 (1.00) |
0.441 (1.00) |
1 (1.00) |
P value = 0.000509 (Fisher's exact test), Q value = 0.16
Table S1. Gene #2: 'amp_2p16.1' versus Molecular Subtype #2: 'METHLYATION_CNMF'
| nPatients | CLUS_1 | CLUS_2 |
|---|---|---|
| ALL | 24 | 24 |
| AMP PEAK 2(2P16.1) MUTATED | 2 | 14 |
| AMP PEAK 2(2P16.1) WILD-TYPE | 22 | 10 |
Figure S1. Get High-res Image Gene #2: 'amp_2p16.1' versus Molecular Subtype #2: 'METHLYATION_CNMF'
P value = 7.62e-05 (Fisher's exact test), Q value = 0.024
Table S2. Gene #6: 'amp_7p22.3' versus Molecular Subtype #1: 'CN_CNMF'
| nPatients | CLUS_1 | CLUS_2 |
|---|---|---|
| ALL | 29 | 19 |
| AMP PEAK 6(7P22.3) MUTATED | 3 | 13 |
| AMP PEAK 6(7P22.3) WILD-TYPE | 26 | 6 |
Figure S2. Get High-res Image Gene #6: 'amp_7p22.3' versus Molecular Subtype #1: 'CN_CNMF'
P value = 1.04e-05 (Fisher's exact test), Q value = 0.0033
Table S3. Gene #7: 'amp_7q21.3' versus Molecular Subtype #1: 'CN_CNMF'
| nPatients | CLUS_1 | CLUS_2 |
|---|---|---|
| ALL | 29 | 19 |
| AMP PEAK 7(7Q21.3) MUTATED | 2 | 13 |
| AMP PEAK 7(7Q21.3) WILD-TYPE | 27 | 6 |
Figure S3. Get High-res Image Gene #7: 'amp_7q21.3' versus Molecular Subtype #1: 'CN_CNMF'
-
Copy number data file = transformed.cor.cli.txt
-
Molecular subtype file = DLBC-TP.transferedmergedcluster.txt
-
Number of patients = 48
-
Number of significantly focal cnvs = 40
-
Number of molecular subtypes = 8
-
Exclude genes that fewer than K tumors have alterations, K = 3
For binary or multi-class clinical features (nominal or ordinal), two-tailed Fisher's exact tests (Fisher 1922) were used to estimate the P values using the 'fisher.test' function in R
For multiple hypothesis correction, Q value is the False Discovery Rate (FDR) analogue of the P value (Benjamini and Hochberg 1995), defined as the minimum FDR at which the test may be called significant. We used the 'Benjamini and Hochberg' method of 'p.adjust' function in R to convert P values into Q values.
In addition to the links below, the full results of the analysis summarized in this report can also be downloaded programmatically using firehose_get, or interactively from either the Broad GDAC website or TCGA Data Coordination Center Portal.