This pipeline computes the correlation between significant arm-level copy number variations (cnvs) and selected clinical features.
Testing the association between copy number variation 61 arm-level events and 11 clinical features across 66 patients, 3 significant findings detected with Q value < 0.25.
-
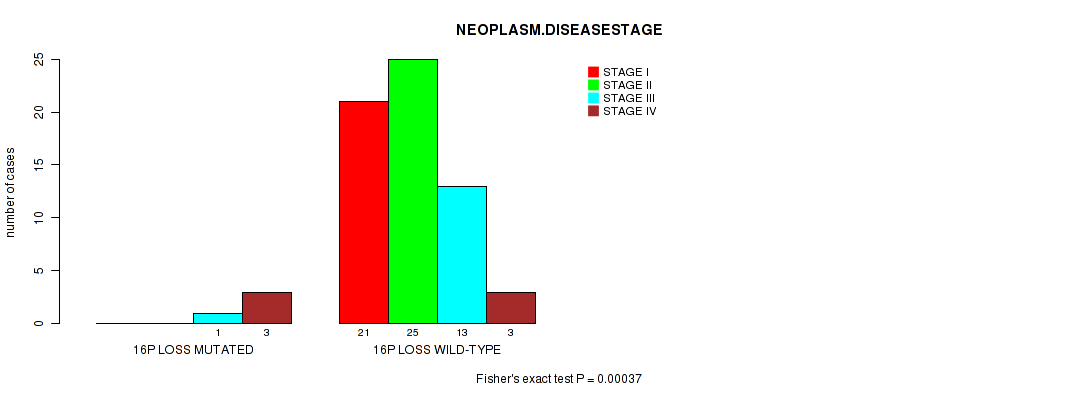
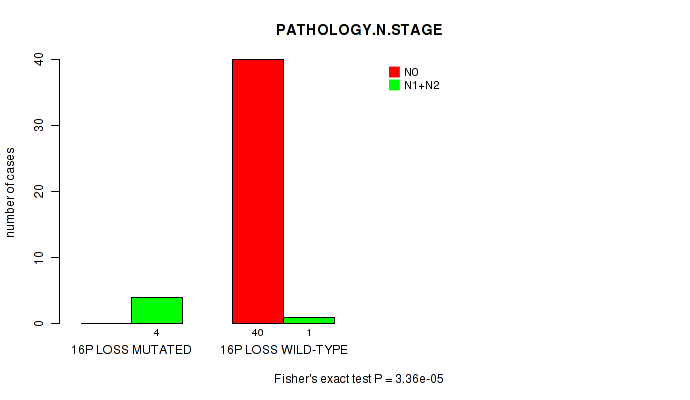
16p loss cnv correlated to 'NEOPLASM.DISEASESTAGE' and 'PATHOLOGY.N.STAGE'.
-
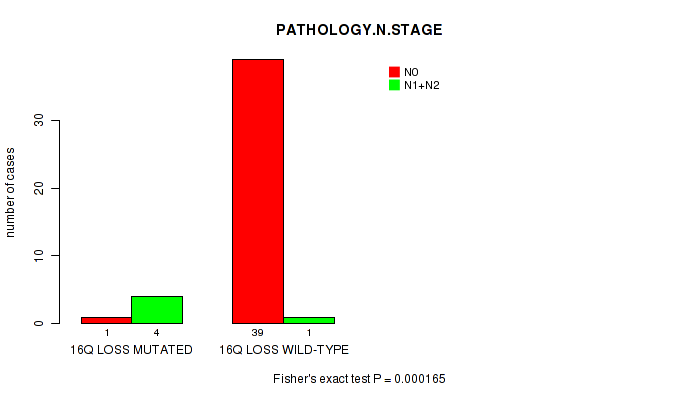
16q loss cnv correlated to 'PATHOLOGY.N.STAGE'.
Table 1. Get Full Table Overview of the association between significant copy number variation of 61 arm-level events and 11 clinical features. Shown in the table are P values (Q values). Thresholded by Q value < 0.25, 3 significant findings detected.
|
Clinical Features |
Time to Death |
AGE |
NEOPLASM DISEASESTAGE |
PATHOLOGY T STAGE |
PATHOLOGY N STAGE |
PATHOLOGY M STAGE |
GENDER |
KARNOFSKY PERFORMANCE SCORE |
NUMBERPACKYEARSSMOKED | RACE | ETHNICITY | ||
| nCNV (%) | nWild-Type | logrank test | Wilcoxon-test | Fisher's exact test | Fisher's exact test | Fisher's exact test | Fisher's exact test | Fisher's exact test | Wilcoxon-test | Wilcoxon-test | Fisher's exact test | Fisher's exact test | |
| 16p loss | 4 (6%) | 62 |
0.519 (1.00) |
0.00037 (0.22) |
0.00668 (1.00) |
3.36e-05 (0.02) |
0.639 (1.00) |
1 (1.00) |
1 (1.00) |
||||
| 16q loss | 5 (8%) | 61 |
0.221 (1.00) |
0.0041 (1.00) |
0.0493 (1.00) |
0.000165 (0.0979) |
0.641 (1.00) |
1 (1.00) |
1 (1.00) |
||||
| 3p gain | 8 (12%) | 58 |
100 (1.00) |
0.0837 (1.00) |
0.0159 (1.00) |
0.466 (1.00) |
0.0327 (1.00) |
0.256 (1.00) |
0.128 (1.00) |
0.296 (1.00) |
1 (1.00) |
||
| 3q gain | 8 (12%) | 58 |
100 (1.00) |
0.0837 (1.00) |
0.0158 (1.00) |
0.465 (1.00) |
0.0327 (1.00) |
0.254 (1.00) |
0.128 (1.00) |
0.294 (1.00) |
1 (1.00) |
||
| 4p gain | 24 (36%) | 42 |
100 (1.00) |
0.265 (1.00) |
0.143 (1.00) |
0.811 (1.00) |
1 (1.00) |
0.112 (1.00) |
1 (1.00) |
1 (1.00) |
0.0467 (1.00) |
1 (1.00) |
0.287 (1.00) |
| 4q gain | 24 (36%) | 42 |
100 (1.00) |
0.265 (1.00) |
0.141 (1.00) |
0.808 (1.00) |
1 (1.00) |
0.113 (1.00) |
1 (1.00) |
1 (1.00) |
0.0467 (1.00) |
1 (1.00) |
0.287 (1.00) |
| 5p gain | 8 (12%) | 58 |
100 (1.00) |
0.0661 (1.00) |
0.00148 (0.876) |
0.363 (1.00) |
0.0874 (1.00) |
0.008 (1.00) |
0.455 (1.00) |
1 (1.00) |
1 (1.00) |
||
| 5q gain | 8 (12%) | 58 |
100 (1.00) |
0.0661 (1.00) |
0.00146 (0.866) |
0.363 (1.00) |
0.0874 (1.00) |
0.008 (1.00) |
0.455 (1.00) |
1 (1.00) |
1 (1.00) |
||
| 7p gain | 24 (36%) | 42 |
100 (1.00) |
0.172 (1.00) |
0.361 (1.00) |
0.691 (1.00) |
0.636 (1.00) |
0.112 (1.00) |
0.195 (1.00) |
1 (1.00) |
0.784 (1.00) |
1 (1.00) |
0.303 (1.00) |
| 7q gain | 24 (36%) | 42 |
100 (1.00) |
0.172 (1.00) |
0.362 (1.00) |
0.691 (1.00) |
0.636 (1.00) |
0.112 (1.00) |
0.195 (1.00) |
1 (1.00) |
0.784 (1.00) |
1 (1.00) |
0.303 (1.00) |
| 8p gain | 17 (26%) | 49 |
100 (1.00) |
0.142 (1.00) |
0.389 (1.00) |
0.41 (1.00) |
1 (1.00) |
0.664 (1.00) |
0.776 (1.00) |
1 (1.00) |
0.394 (1.00) |
1 (1.00) |
0.588 (1.00) |
| 8q gain | 18 (27%) | 48 |
100 (1.00) |
0.15 (1.00) |
0.228 (1.00) |
0.448 (1.00) |
1 (1.00) |
0.123 (1.00) |
0.577 (1.00) |
1 (1.00) |
0.394 (1.00) |
1 (1.00) |
0.588 (1.00) |
| 9p gain | 10 (15%) | 56 |
100 (1.00) |
0.979 (1.00) |
0.124 (1.00) |
0.193 (1.00) |
0.306 (1.00) |
1 (1.00) |
1 (1.00) |
0.759 (1.00) |
0.376 (1.00) |
0.535 (1.00) |
|
| 9q gain | 10 (15%) | 56 |
100 (1.00) |
0.979 (1.00) |
0.122 (1.00) |
0.196 (1.00) |
0.306 (1.00) |
1 (1.00) |
1 (1.00) |
0.759 (1.00) |
0.376 (1.00) |
0.535 (1.00) |
|
| 10p gain | 4 (6%) | 62 |
100 (1.00) |
0.34 (1.00) |
0.267 (1.00) |
0.454 (1.00) |
1 (1.00) |
1 (1.00) |
1 (1.00) |
||||
| 11p gain | 15 (23%) | 51 |
100 (1.00) |
0.812 (1.00) |
0.739 (1.00) |
0.812 (1.00) |
0.617 (1.00) |
0.385 (1.00) |
1 (1.00) |
0.0467 (1.00) |
0.559 (1.00) |
0.0756 (1.00) |
|
| 11q gain | 15 (23%) | 51 |
100 (1.00) |
0.945 (1.00) |
0.742 (1.00) |
0.809 (1.00) |
1 (1.00) |
0.384 (1.00) |
1 (1.00) |
0.0467 (1.00) |
0.561 (1.00) |
0.0756 (1.00) |
|
| 12p gain | 19 (29%) | 47 |
100 (1.00) |
0.0137 (1.00) |
0.0771 (1.00) |
0.318 (1.00) |
1 (1.00) |
0.136 (1.00) |
0.412 (1.00) |
1 (1.00) |
0.357 (1.00) |
1 (1.00) |
1 (1.00) |
| 12q gain | 20 (30%) | 46 |
100 (1.00) |
0.0696 (1.00) |
0.111 (1.00) |
0.71 (1.00) |
0.33 (1.00) |
0.134 (1.00) |
0.593 (1.00) |
1 (1.00) |
0.234 (1.00) |
0.806 (1.00) |
1 (1.00) |
| 14q gain | 21 (32%) | 45 |
100 (1.00) |
0.144 (1.00) |
0.0951 (1.00) |
0.382 (1.00) |
1 (1.00) |
0.155 (1.00) |
0.794 (1.00) |
1 (1.00) |
0.234 (1.00) |
1 (1.00) |
0.609 (1.00) |
| 15q gain | 21 (32%) | 45 |
100 (1.00) |
0.283 (1.00) |
0.412 (1.00) |
0.48 (1.00) |
0.35 (1.00) |
0.152 (1.00) |
0.794 (1.00) |
1 (1.00) |
1 (1.00) |
0.816 (1.00) |
0.124 (1.00) |
| 16p gain | 21 (32%) | 45 |
100 (1.00) |
0.995 (1.00) |
0.477 (1.00) |
0.402 (1.00) |
0.635 (1.00) |
0.722 (1.00) |
1 (1.00) |
1 (1.00) |
0.0467 (1.00) |
1 (1.00) |
0.124 (1.00) |
| 16q gain | 21 (32%) | 45 |
100 (1.00) |
0.995 (1.00) |
0.475 (1.00) |
0.402 (1.00) |
0.635 (1.00) |
0.721 (1.00) |
1 (1.00) |
1 (1.00) |
0.0467 (1.00) |
1 (1.00) |
0.124 (1.00) |
| 18p gain | 17 (26%) | 49 |
100 (1.00) |
0.278 (1.00) |
0.294 (1.00) |
0.434 (1.00) |
0.303 (1.00) |
0.508 (1.00) |
0.776 (1.00) |
0.298 (1.00) |
1 (1.00) |
0.57 (1.00) |
|
| 18q gain | 16 (24%) | 50 |
100 (1.00) |
0.525 (1.00) |
0.311 (1.00) |
0.2 (1.00) |
0.303 (1.00) |
0.508 (1.00) |
1 (1.00) |
0.298 (1.00) |
1 (1.00) |
0.305 (1.00) |
|
| 19p gain | 19 (29%) | 47 |
100 (1.00) |
0.0291 (1.00) |
0.0158 (1.00) |
0.519 (1.00) |
0.00246 (1.00) |
0.0836 (1.00) |
0.412 (1.00) |
0.784 (1.00) |
0.258 (1.00) |
0.29 (1.00) |
|
| 19q gain | 17 (26%) | 49 |
100 (1.00) |
0.0137 (1.00) |
0.295 (1.00) |
0.643 (1.00) |
0.136 (1.00) |
0.0618 (1.00) |
0.776 (1.00) |
1 (1.00) |
0.594 (1.00) |
0.29 (1.00) |
|
| 20p gain | 20 (30%) | 46 |
100 (1.00) |
0.128 (1.00) |
0.368 (1.00) |
0.791 (1.00) |
0.35 (1.00) |
0.708 (1.00) |
0.593 (1.00) |
1 (1.00) |
0.234 (1.00) |
0.367 (1.00) |
0.588 (1.00) |
| 20q gain | 21 (32%) | 45 |
100 (1.00) |
0.053 (1.00) |
0.136 (1.00) |
0.845 (1.00) |
0.35 (1.00) |
0.709 (1.00) |
0.433 (1.00) |
1 (1.00) |
0.234 (1.00) |
0.368 (1.00) |
0.609 (1.00) |
| 21q gain | 4 (6%) | 62 |
100 (1.00) |
0.591 (1.00) |
1 (1.00) |
1 (1.00) |
1 (1.00) |
1 (1.00) |
1 (1.00) |
||||
| 22q gain | 19 (29%) | 47 |
100 (1.00) |
0.415 (1.00) |
0.489 (1.00) |
0.521 (1.00) |
0.166 (1.00) |
0.355 (1.00) |
0.412 (1.00) |
0.784 (1.00) |
0.794 (1.00) |
0.588 (1.00) |
|
| xq gain | 6 (9%) | 60 |
100 (1.00) |
0.815 (1.00) |
0.379 (1.00) |
0.661 (1.00) |
1 (1.00) |
0.191 (1.00) |
0.388 (1.00) |
0.458 (1.00) |
0.39 (1.00) |
||
| 1p loss | 53 (80%) | 13 |
100 (1.00) |
0.478 (1.00) |
0.0281 (1.00) |
0.0401 (1.00) |
1 (1.00) |
0.00651 (1.00) |
0.534 (1.00) |
0.438 (1.00) |
0.609 (1.00) |
1 (1.00) |
1 (1.00) |
| 1q loss | 52 (79%) | 14 |
100 (1.00) |
0.456 (1.00) |
0.00616 (1.00) |
0.0132 (1.00) |
0.529 (1.00) |
0.0212 (1.00) |
0.367 (1.00) |
0.438 (1.00) |
1 (1.00) |
1 (1.00) |
|
| 2p loss | 46 (70%) | 20 |
100 (1.00) |
0.241 (1.00) |
0.145 (1.00) |
0.113 (1.00) |
1 (1.00) |
0.195 (1.00) |
0.284 (1.00) |
0.438 (1.00) |
1 (1.00) |
1 (1.00) |
|
| 2q loss | 46 (70%) | 20 |
100 (1.00) |
0.241 (1.00) |
0.143 (1.00) |
0.113 (1.00) |
1 (1.00) |
0.193 (1.00) |
0.284 (1.00) |
0.438 (1.00) |
1 (1.00) |
1 (1.00) |
|
| 3p loss | 9 (14%) | 57 |
100 (1.00) |
0.0465 (1.00) |
0.0762 (1.00) |
0.0231 (1.00) |
1 (1.00) |
0.658 (1.00) |
0.469 (1.00) |
1 (1.00) |
0.535 (1.00) |
||
| 3q loss | 8 (12%) | 58 |
100 (1.00) |
0.107 (1.00) |
0.142 (1.00) |
0.0529 (1.00) |
1 (1.00) |
0.64 (1.00) |
0.256 (1.00) |
1 (1.00) |
0.535 (1.00) |
||
| 5p loss | 10 (15%) | 56 |
100 (1.00) |
0.642 (1.00) |
0.132 (1.00) |
0.0837 (1.00) |
1 (1.00) |
1 (1.00) |
1 (1.00) |
0.155 (1.00) |
0.159 (1.00) |
0.121 (1.00) |
|
| 5q loss | 10 (15%) | 56 |
100 (1.00) |
0.642 (1.00) |
0.132 (1.00) |
0.0858 (1.00) |
1 (1.00) |
1 (1.00) |
1 (1.00) |
0.155 (1.00) |
0.16 (1.00) |
0.121 (1.00) |
|
| 6p loss | 51 (77%) | 15 |
100 (1.00) |
0.379 (1.00) |
0.0811 (1.00) |
0.056 (1.00) |
0.568 (1.00) |
0.169 (1.00) |
0.244 (1.00) |
0.438 (1.00) |
1 (1.00) |
1 (1.00) |
|
| 6q loss | 51 (77%) | 15 |
100 (1.00) |
0.379 (1.00) |
0.083 (1.00) |
0.0546 (1.00) |
0.568 (1.00) |
0.17 (1.00) |
0.244 (1.00) |
0.438 (1.00) |
1 (1.00) |
1 (1.00) |
|
| 8p loss | 9 (14%) | 57 |
100 (1.00) |
0.779 (1.00) |
0.741 (1.00) |
0.436 (1.00) |
1 (1.00) |
1 (1.00) |
0.727 (1.00) |
0.614 (1.00) |
0.566 (1.00) |
||
| 8q loss | 8 (12%) | 58 |
100 (1.00) |
0.575 (1.00) |
0.703 (1.00) |
0.412 (1.00) |
1 (1.00) |
1 (1.00) |
1 (1.00) |
0.57 (1.00) |
1 (1.00) |
||
| 9p loss | 10 (15%) | 56 |
100 (1.00) |
0.0116 (1.00) |
1 (1.00) |
1 (1.00) |
0.529 (1.00) |
0.488 (1.00) |
0.508 (1.00) |
1 (1.00) |
0.535 (1.00) |
||
| 9q loss | 10 (15%) | 56 |
100 (1.00) |
0.0116 (1.00) |
1 (1.00) |
1 (1.00) |
0.529 (1.00) |
0.487 (1.00) |
0.508 (1.00) |
1 (1.00) |
0.535 (1.00) |
||
| 10p loss | 48 (73%) | 18 |
100 (1.00) |
0.762 (1.00) |
0.547 (1.00) |
0.393 (1.00) |
1 (1.00) |
0.02 (1.00) |
1 (1.00) |
0.146 (1.00) |
0.26 (1.00) |
1 (1.00) |
1 (1.00) |
| 10q loss | 49 (74%) | 17 |
100 (1.00) |
0.953 (1.00) |
0.348 (1.00) |
0.213 (1.00) |
1 (1.00) |
0.0189 (1.00) |
1 (1.00) |
0.146 (1.00) |
0.26 (1.00) |
1 (1.00) |
1 (1.00) |
| 11p loss | 7 (11%) | 59 |
100 (1.00) |
0.0527 (1.00) |
0.0959 (1.00) |
0.0802 (1.00) |
0.461 (1.00) |
1 (1.00) |
0.691 (1.00) |
1 (1.00) |
1 (1.00) |
||
| 11q loss | 7 (11%) | 59 |
100 (1.00) |
0.0527 (1.00) |
0.0948 (1.00) |
0.0802 (1.00) |
0.461 (1.00) |
1 (1.00) |
0.691 (1.00) |
1 (1.00) |
1 (1.00) |
||
| 13q loss | 43 (65%) | 23 |
100 (1.00) |
0.0641 (1.00) |
0.448 (1.00) |
0.356 (1.00) |
0.301 (1.00) |
0.536 (1.00) |
0.294 (1.00) |
1 (1.00) |
0.474 (1.00) |
0.818 (1.00) |
1 (1.00) |
| 17p loss | 50 (76%) | 16 |
100 (1.00) |
0.149 (1.00) |
0.0737 (1.00) |
0.042 (1.00) |
0.568 (1.00) |
0.17 (1.00) |
0.158 (1.00) |
0.438 (1.00) |
1 (1.00) |
1 (1.00) |
|
| 17q loss | 50 (76%) | 16 |
100 (1.00) |
0.149 (1.00) |
0.0736 (1.00) |
0.0418 (1.00) |
0.568 (1.00) |
0.172 (1.00) |
0.158 (1.00) |
0.438 (1.00) |
1 (1.00) |
1 (1.00) |
|
| 18p loss | 8 (12%) | 58 |
100 (1.00) |
0.455 (1.00) |
0.446 (1.00) |
0.899 (1.00) |
0.211 (1.00) |
0.658 (1.00) |
0.256 (1.00) |
0.295 (1.00) |
1 (1.00) |
||
| 18q loss | 10 (15%) | 56 |
100 (1.00) |
0.343 (1.00) |
0.138 (1.00) |
0.834 (1.00) |
0.258 (1.00) |
0.659 (1.00) |
0.295 (1.00) |
0.375 (1.00) |
1 (1.00) |
||
| 19q loss | 3 (5%) | 63 |
100 (1.00) |
0.423 (1.00) |
0.0121 (1.00) |
0.191 (1.00) |
0.0289 (1.00) |
1 (1.00) |
0.101 (1.00) |
0.111 (1.00) |
|||
| 20p loss | 4 (6%) | 62 |
100 (1.00) |
0.237 (1.00) |
0.14 (1.00) |
0.142 (1.00) |
0.304 (1.00) |
1 (1.00) |
1 (1.00) |
1 (1.00) |
1 (1.00) |
||
| 20q loss | 3 (5%) | 63 |
0.432 (1.00) |
0.0405 (1.00) |
0.0258 (1.00) |
0.304 (1.00) |
1 (1.00) |
1 (1.00) |
1 (1.00) |
||||
| 21q loss | 35 (53%) | 31 |
100 (1.00) |
0.375 (1.00) |
0.908 (1.00) |
0.781 (1.00) |
0.0731 (1.00) |
0.0767 (1.00) |
0.805 (1.00) |
0.448 (1.00) |
0.705 (1.00) |
0.543 (1.00) |
0.613 (1.00) |
| 22q loss | 8 (12%) | 58 |
100 (1.00) |
0.783 (1.00) |
0.177 (1.00) |
1 (1.00) |
0.211 (1.00) |
0.323 (1.00) |
0.0553 (1.00) |
0.566 (1.00) |
0.39 (1.00) |
||
| xq loss | 39 (59%) | 27 |
100 (1.00) |
0.0923 (1.00) |
0.303 (1.00) |
0.363 (1.00) |
1 (1.00) |
0.148 (1.00) |
0.136 (1.00) |
0.132 (1.00) |
0.17 (1.00) |
0.818 (1.00) |
1 (1.00) |
P value = 0.00037 (Fisher's exact test), Q value = 0.22
Table S1. Gene #50: '16p loss' versus Clinical Feature #3: 'NEOPLASM.DISEASESTAGE'
| nPatients | STAGE I | STAGE II | STAGE III | STAGE IV |
|---|---|---|---|---|
| ALL | 21 | 25 | 14 | 6 |
| 16P LOSS MUTATED | 0 | 0 | 1 | 3 |
| 16P LOSS WILD-TYPE | 21 | 25 | 13 | 3 |
Figure S1. Get High-res Image Gene #50: '16p loss' versus Clinical Feature #3: 'NEOPLASM.DISEASESTAGE'
P value = 3.36e-05 (Fisher's exact test), Q value = 0.02
Table S2. Gene #50: '16p loss' versus Clinical Feature #5: 'PATHOLOGY.N.STAGE'
| nPatients | N0 | N1+N2 |
|---|---|---|
| ALL | 40 | 5 |
| 16P LOSS MUTATED | 0 | 4 |
| 16P LOSS WILD-TYPE | 40 | 1 |
Figure S2. Get High-res Image Gene #50: '16p loss' versus Clinical Feature #5: 'PATHOLOGY.N.STAGE'
P value = 0.000165 (Fisher's exact test), Q value = 0.098
Table S3. Gene #51: '16q loss' versus Clinical Feature #5: 'PATHOLOGY.N.STAGE'
| nPatients | N0 | N1+N2 |
|---|---|---|
| ALL | 40 | 5 |
| 16Q LOSS MUTATED | 1 | 4 |
| 16Q LOSS WILD-TYPE | 39 | 1 |
Figure S3. Get High-res Image Gene #51: '16q loss' versus Clinical Feature #5: 'PATHOLOGY.N.STAGE'
-
Copy number data file = transformed.cor.cli.txt
-
Clinical data file = KICH-TP.merged_data.txt
-
Number of patients = 66
-
Number of significantly arm-level cnvs = 61
-
Number of selected clinical features = 11
-
Exclude regions that fewer than K tumors have mutations, K = 3
For survival clinical features, the Kaplan-Meier survival curves of tumors with and without gene mutations were plotted and the statistical significance P values were estimated by logrank test (Bland and Altman 2004) using the 'survdiff' function in R
For binary or multi-class clinical features (nominal or ordinal), two-tailed Fisher's exact tests (Fisher 1922) were used to estimate the P values using the 'fisher.test' function in R
For multiple hypothesis correction, Q value is the False Discovery Rate (FDR) analogue of the P value (Benjamini and Hochberg 1995), defined as the minimum FDR at which the test may be called significant. We used the 'Benjamini and Hochberg' method of 'p.adjust' function in R to convert P values into Q values.
In addition to the links below, the full results of the analysis summarized in this report can also be downloaded programmatically using firehose_get, or interactively from either the Broad GDAC website or TCGA Data Coordination Center Portal.