This pipeline computes the correlation between significant arm-level copy number variations (cnvs) and selected clinical features.
Testing the association between copy number variation 79 arm-level events and 11 clinical features across 516 patients, 21 significant findings detected with Q value < 0.25.
-
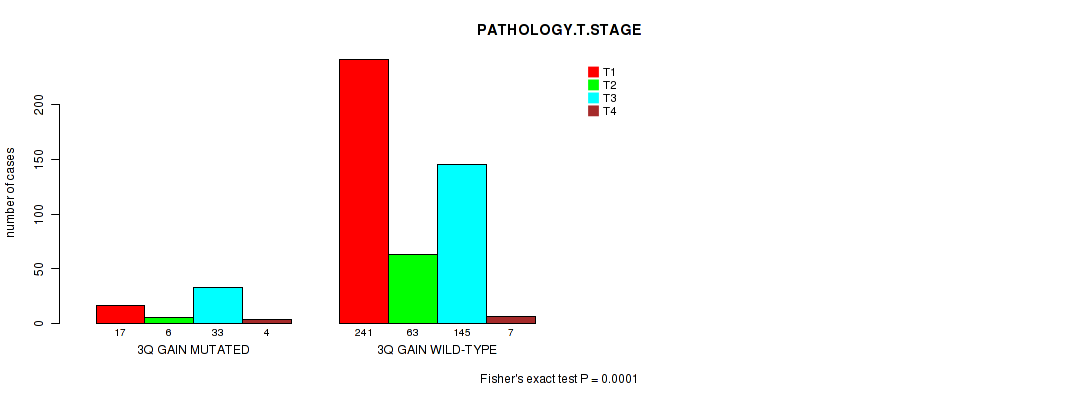
3q gain cnv correlated to 'PATHOLOGY.T.STAGE'.
-
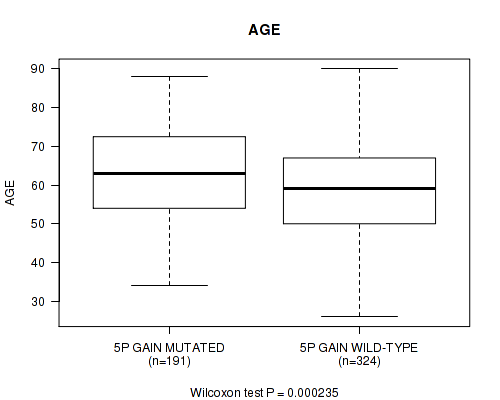
5p gain cnv correlated to 'AGE'.
-
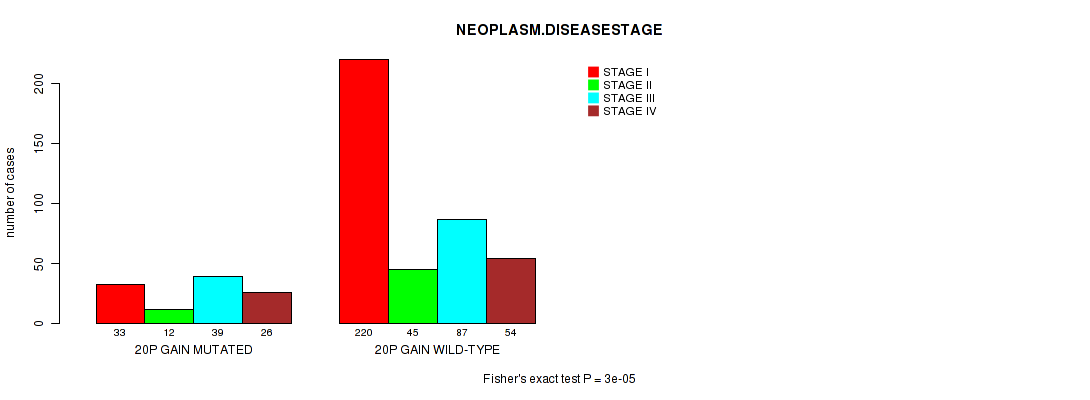
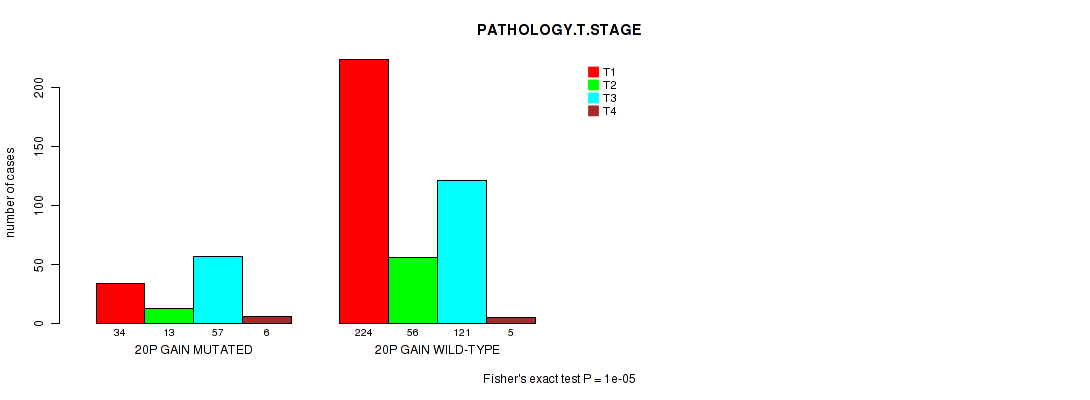
20p gain cnv correlated to 'NEOPLASM.DISEASESTAGE' and 'PATHOLOGY.T.STAGE'.
-
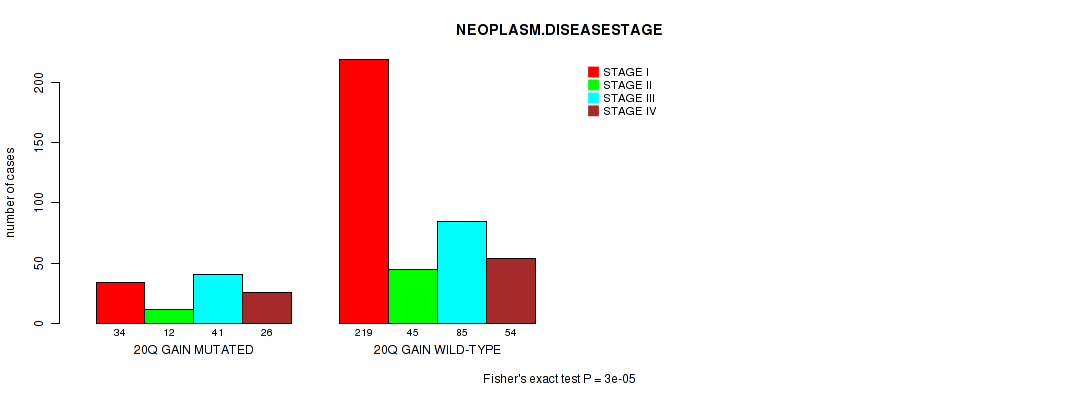
20q gain cnv correlated to 'NEOPLASM.DISEASESTAGE' and 'PATHOLOGY.T.STAGE'.
-
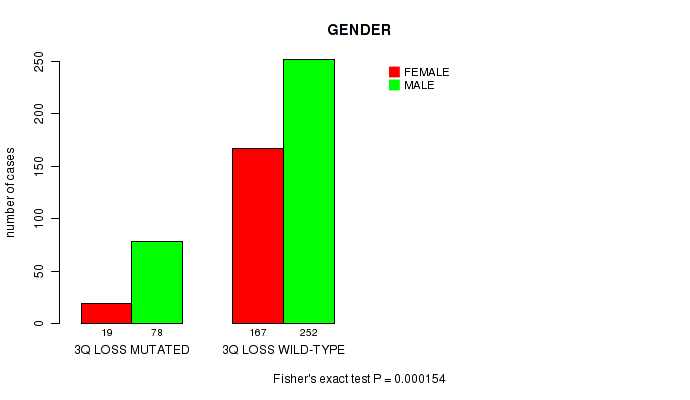
3q loss cnv correlated to 'GENDER'.
-
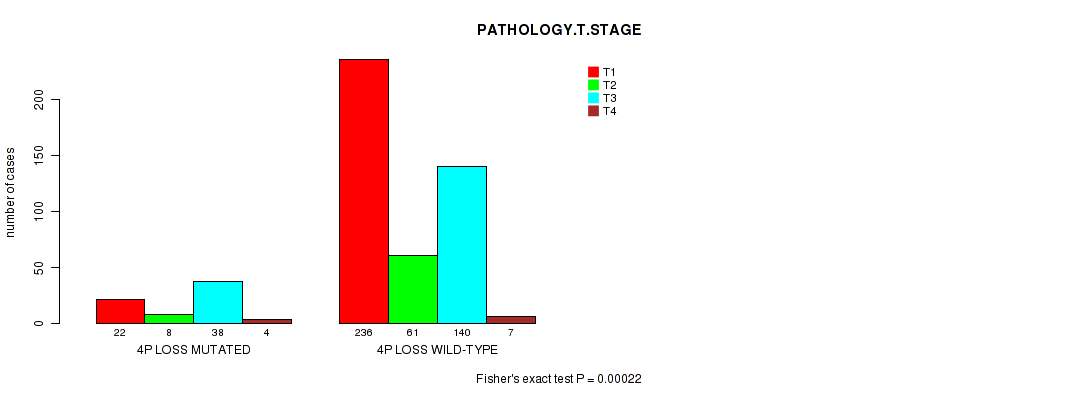
4p loss cnv correlated to 'PATHOLOGY.T.STAGE'.
-
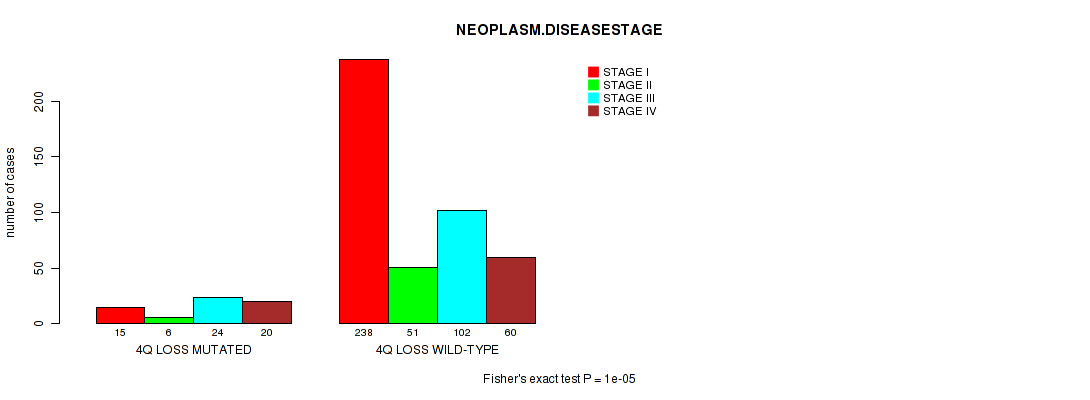
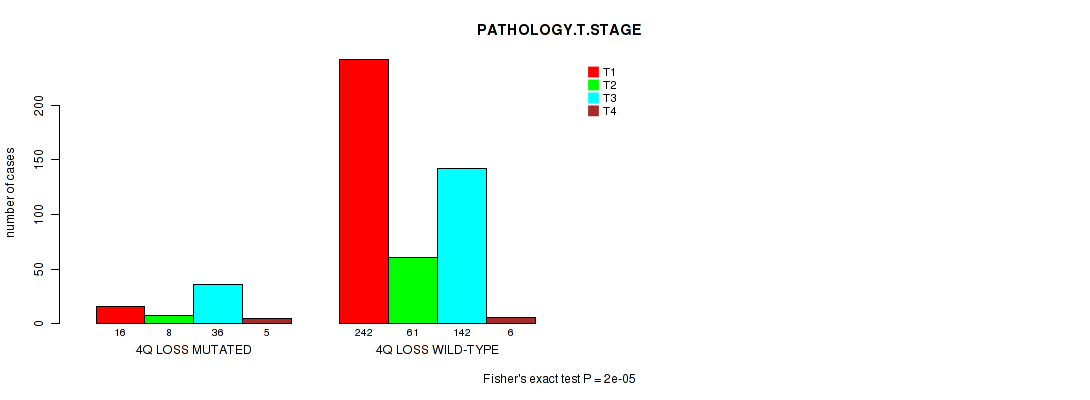
4q loss cnv correlated to 'NEOPLASM.DISEASESTAGE' and 'PATHOLOGY.T.STAGE'.
-
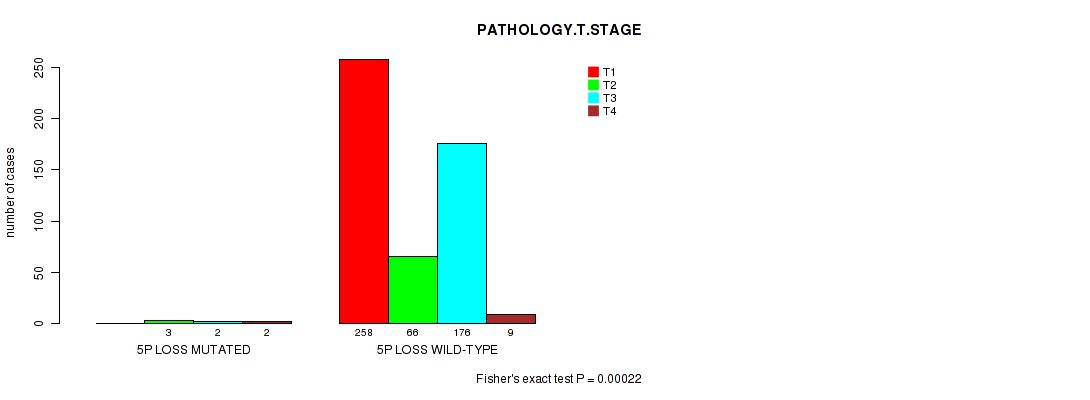
5p loss cnv correlated to 'PATHOLOGY.T.STAGE'.
-
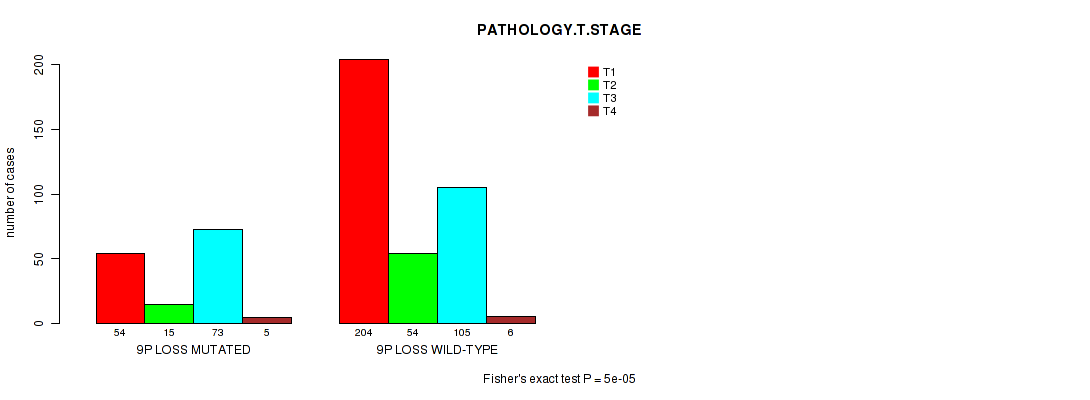
9p loss cnv correlated to 'NEOPLASM.DISEASESTAGE' and 'PATHOLOGY.T.STAGE'.
-
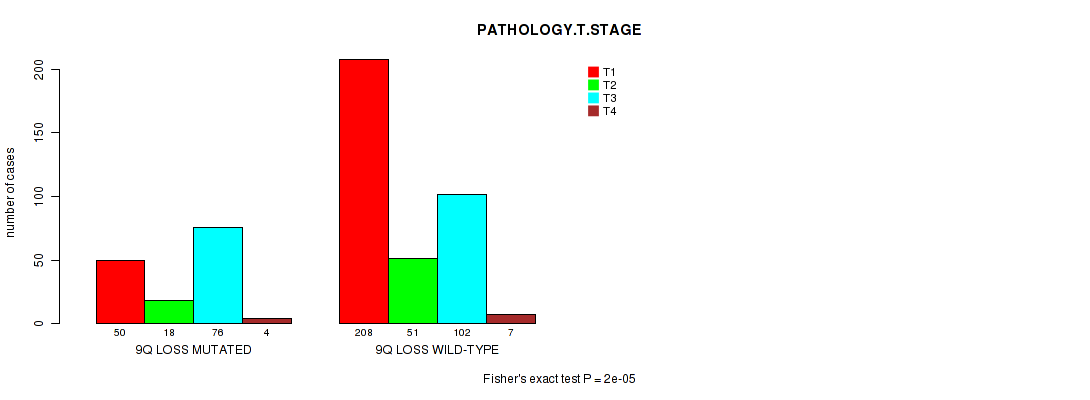
9q loss cnv correlated to 'NEOPLASM.DISEASESTAGE' and 'PATHOLOGY.T.STAGE'.
-
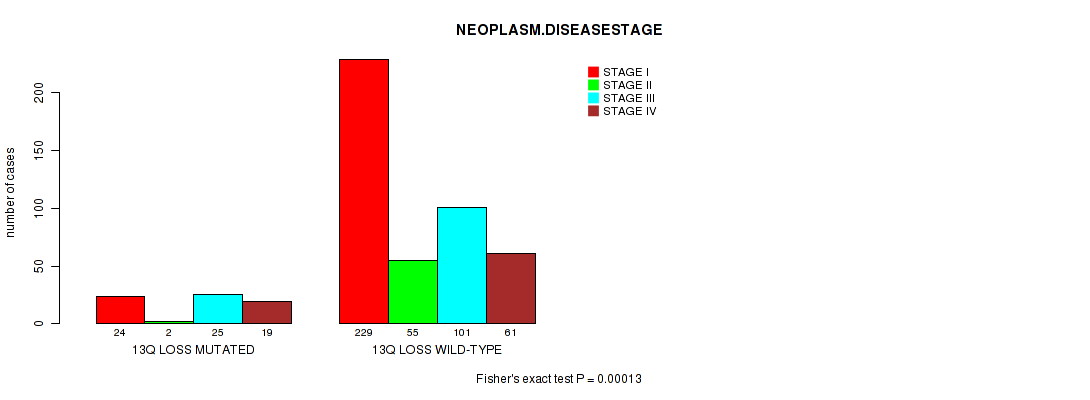
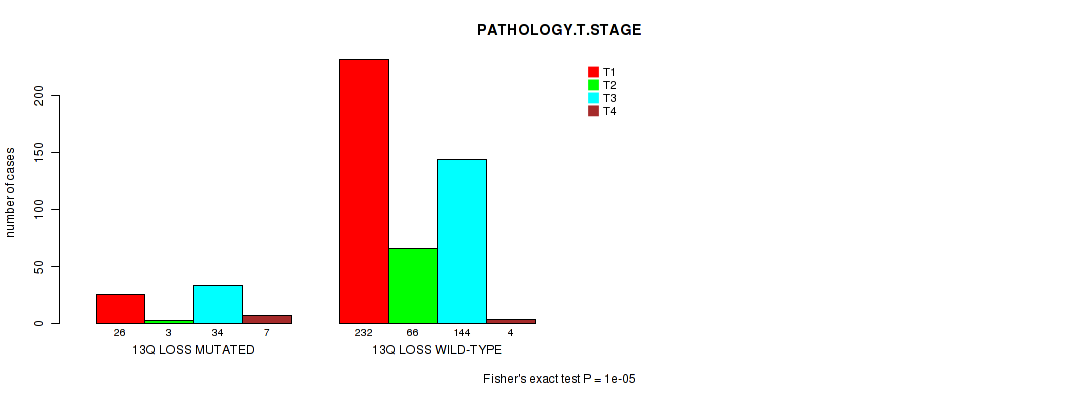
13q loss cnv correlated to 'NEOPLASM.DISEASESTAGE' and 'PATHOLOGY.T.STAGE'.
-
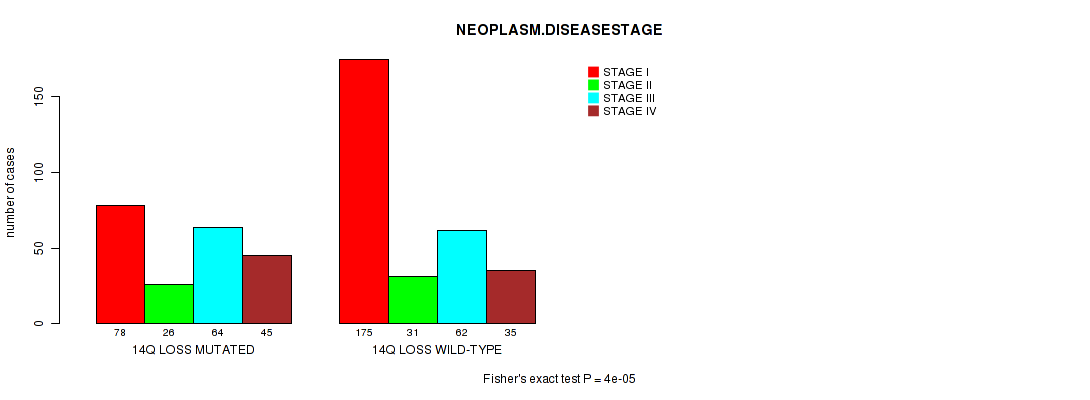
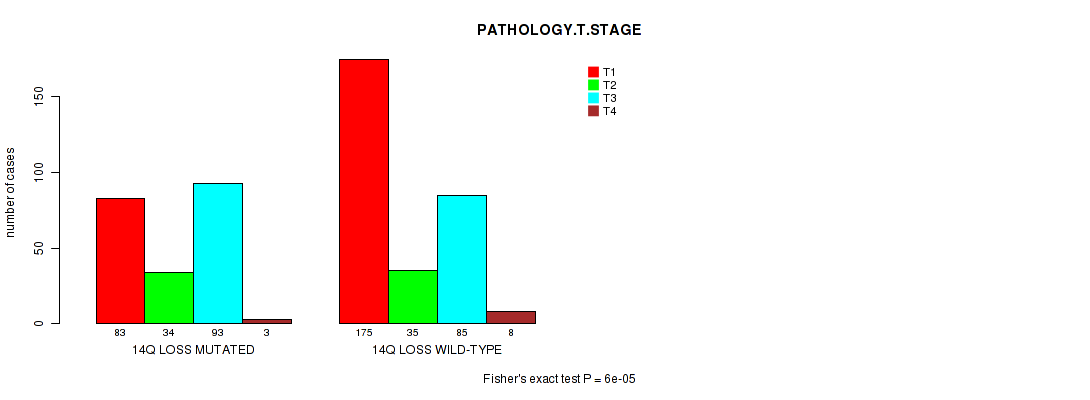
14q loss cnv correlated to 'NEOPLASM.DISEASESTAGE' and 'PATHOLOGY.T.STAGE'.
-
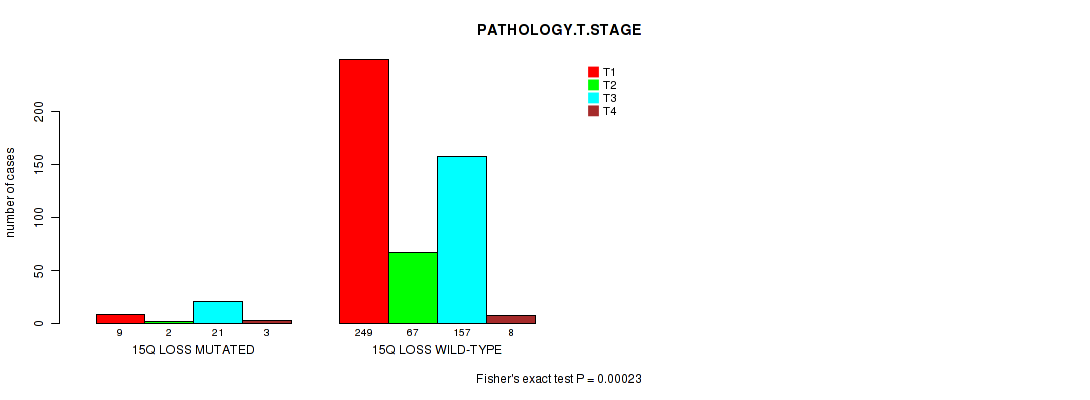
15q loss cnv correlated to 'PATHOLOGY.T.STAGE'.
-
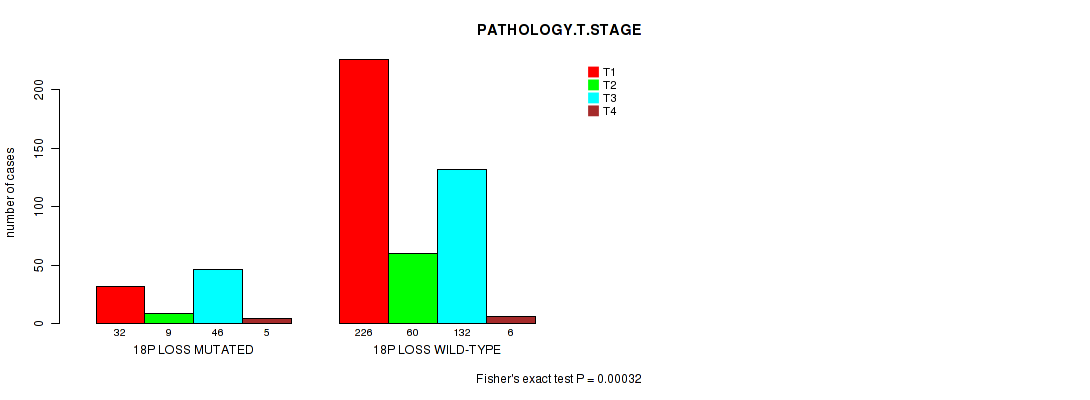
18p loss cnv correlated to 'PATHOLOGY.T.STAGE'.
Table 1. Get Full Table Overview of the association between significant copy number variation of 79 arm-level events and 11 clinical features. Shown in the table are P values (Q values). Thresholded by Q value < 0.25, 21 significant findings detected.
|
Clinical Features |
Time to Death |
AGE |
NEOPLASM DISEASESTAGE |
PATHOLOGY T STAGE |
PATHOLOGY N STAGE |
PATHOLOGY M STAGE |
GENDER |
KARNOFSKY PERFORMANCE SCORE |
NUMBERPACKYEARSSMOKED | RACE | ETHNICITY | ||
| nCNV (%) | nWild-Type | logrank test | Wilcoxon-test | Fisher's exact test | Fisher's exact test | Fisher's exact test | Fisher's exact test | Fisher's exact test | Wilcoxon-test | Wilcoxon-test | Fisher's exact test | Fisher's exact test | |
| 20p gain | 110 (21%) | 406 |
0.256 (1.00) |
0.264 (1.00) |
3e-05 (0.0227) |
1e-05 (0.00766) |
0.546 (1.00) |
0.00686 (1.00) |
0.00048 (0.355) |
0.973 (1.00) |
0.378 (1.00) |
0.442 (1.00) |
|
| 20q gain | 113 (22%) | 403 |
0.12 (1.00) |
0.0911 (1.00) |
3e-05 (0.0227) |
2e-05 (0.0152) |
0.236 (1.00) |
0.00964 (1.00) |
0.00265 (1.00) |
0.973 (1.00) |
0.363 (1.00) |
0.318 (1.00) |
|
| 4q loss | 65 (13%) | 451 |
0.905 (1.00) |
0.836 (1.00) |
1e-05 (0.00766) |
2e-05 (0.0152) |
0.463 (1.00) |
0.00185 (1.00) |
0.269 (1.00) |
0.477 (1.00) |
0.0531 (1.00) |
0.76 (1.00) |
|
| 9p loss | 147 (28%) | 369 |
0.414 (1.00) |
0.0656 (1.00) |
2e-05 (0.0152) |
5e-05 (0.0377) |
0.103 (1.00) |
0.00215 (1.00) |
0.00054 (0.399) |
0.546 (1.00) |
0.797 (1.00) |
0.215 (1.00) |
0.654 (1.00) |
| 9q loss | 148 (29%) | 368 |
0.86 (1.00) |
0.0465 (1.00) |
1e-05 (0.00766) |
2e-05 (0.0152) |
0.172 (1.00) |
0.00585 (1.00) |
0.000388 (0.288) |
0.317 (1.00) |
0.779 (1.00) |
0.187 (1.00) |
0.824 (1.00) |
| 13q loss | 70 (14%) | 446 |
0.00637 (1.00) |
0.942 (1.00) |
0.00013 (0.0978) |
1e-05 (0.00766) |
0.492 (1.00) |
0.0559 (1.00) |
0.286 (1.00) |
0.949 (1.00) |
0.274 (1.00) |
0.228 (1.00) |
|
| 14q loss | 213 (41%) | 303 |
0.0851 (1.00) |
0.254 (1.00) |
4e-05 (0.0302) |
6e-05 (0.0452) |
0.00233 (1.00) |
0.00186 (1.00) |
0.0199 (1.00) |
0.184 (1.00) |
0.251 (1.00) |
0.0471 (1.00) |
0.838 (1.00) |
| 3q gain | 60 (12%) | 456 |
0.837 (1.00) |
0.918 (1.00) |
0.00103 (0.756) |
0.0001 (0.0753) |
0.00848 (1.00) |
0.00572 (1.00) |
0.671 (1.00) |
0.477 (1.00) |
0.535 (1.00) |
1 (1.00) |
|
| 5p gain | 191 (37%) | 325 |
0.238 (1.00) |
0.000235 (0.176) |
0.108 (1.00) |
0.196 (1.00) |
0.621 (1.00) |
1 (1.00) |
0.0175 (1.00) |
0.505 (1.00) |
0.119 (1.00) |
0.835 (1.00) |
|
| 3q loss | 97 (19%) | 419 |
0.105 (1.00) |
0.0141 (1.00) |
0.481 (1.00) |
0.239 (1.00) |
0.747 (1.00) |
0.971 (1.00) |
0.000154 (0.115) |
0.38 (1.00) |
0.664 (1.00) |
0.783 (1.00) |
|
| 4p loss | 72 (14%) | 444 |
0.559 (1.00) |
0.75 (1.00) |
0.00036 (0.268) |
0.00022 (0.165) |
0.731 (1.00) |
0.0357 (1.00) |
0.895 (1.00) |
0.609 (1.00) |
0.152 (1.00) |
0.564 (1.00) |
|
| 5p loss | 7 (1%) | 509 |
0.251 (1.00) |
0.00167 (1.00) |
0.00022 (0.165) |
1 (1.00) |
0.138 (1.00) |
0.259 (1.00) |
1 (1.00) |
1 (1.00) |
|||
| 15q loss | 35 (7%) | 481 |
0.975 (1.00) |
0.992 (1.00) |
0.00067 (0.493) |
0.00023 (0.172) |
1 (1.00) |
0.0228 (1.00) |
0.045 (1.00) |
0.943 (1.00) |
0.0776 (1.00) |
0.383 (1.00) |
|
| 18p loss | 92 (18%) | 424 |
0.0341 (1.00) |
0.123 (1.00) |
0.00038 (0.283) |
0.00032 (0.239) |
1 (1.00) |
0.0747 (1.00) |
0.152 (1.00) |
0.826 (1.00) |
0.383 (1.00) |
0.0987 (1.00) |
|
| 1p gain | 24 (5%) | 492 |
0.179 (1.00) |
0.168 (1.00) |
0.174 (1.00) |
0.286 (1.00) |
0.212 (1.00) |
0.464 (1.00) |
0.832 (1.00) |
0.482 (1.00) |
0.495 (1.00) |
1 (1.00) |
|
| 1q gain | 51 (10%) | 465 |
0.577 (1.00) |
0.0301 (1.00) |
0.0627 (1.00) |
0.0998 (1.00) |
0.425 (1.00) |
0.815 (1.00) |
0.54 (1.00) |
0.763 (1.00) |
0.912 (1.00) |
0.733 (1.00) |
|
| 2p gain | 75 (15%) | 441 |
0.402 (1.00) |
0.154 (1.00) |
0.124 (1.00) |
0.517 (1.00) |
0.743 (1.00) |
0.445 (1.00) |
1 (1.00) |
0.329 (1.00) |
0.281 (1.00) |
0.76 (1.00) |
|
| 2q gain | 77 (15%) | 439 |
0.81 (1.00) |
0.246 (1.00) |
0.301 (1.00) |
0.65 (1.00) |
1 (1.00) |
0.629 (1.00) |
0.441 (1.00) |
0.703 (1.00) |
0.248 (1.00) |
0.371 (1.00) |
|
| 3p gain | 19 (4%) | 497 |
0.666 (1.00) |
0.518 (1.00) |
0.153 (1.00) |
0.211 (1.00) |
0.0464 (1.00) |
0.15 (1.00) |
0.333 (1.00) |
1 (1.00) |
1 (1.00) |
1 (1.00) |
|
| 4p gain | 13 (3%) | 503 |
0.00921 (1.00) |
0.773 (1.00) |
0.419 (1.00) |
0.18 (1.00) |
0.497 (1.00) |
1 (1.00) |
0.394 (1.00) |
1 (1.00) |
1 (1.00) |
||
| 4q gain | 13 (3%) | 503 |
0.0116 (1.00) |
0.773 (1.00) |
0.551 (1.00) |
0.717 (1.00) |
0.456 (1.00) |
0.821 (1.00) |
0.778 (1.00) |
1 (1.00) |
1 (1.00) |
||
| 5q gain | 204 (40%) | 312 |
0.154 (1.00) |
0.000636 (0.469) |
0.346 (1.00) |
0.358 (1.00) |
1 (1.00) |
1 (1.00) |
0.0193 (1.00) |
0.505 (1.00) |
0.046 (1.00) |
0.837 (1.00) |
|
| 6p gain | 11 (2%) | 505 |
0.423 (1.00) |
0.796 (1.00) |
0.344 (1.00) |
0.236 (1.00) |
1 (1.00) |
0.796 (1.00) |
0.342 (1.00) |
1 (1.00) |
1 (1.00) |
||
| 6q gain | 9 (2%) | 507 |
0.299 (1.00) |
0.361 (1.00) |
0.236 (1.00) |
0.292 (1.00) |
1 (1.00) |
1 (1.00) |
0.167 (1.00) |
0.627 (1.00) |
1 (1.00) |
||
| 7p gain | 170 (33%) | 346 |
0.904 (1.00) |
0.283 (1.00) |
0.0779 (1.00) |
0.133 (1.00) |
0.45 (1.00) |
0.0513 (1.00) |
0.00337 (1.00) |
0.394 (1.00) |
0.345 (1.00) |
0.104 (1.00) |
0.51 (1.00) |
| 7q gain | 171 (33%) | 345 |
0.437 (1.00) |
0.321 (1.00) |
0.0195 (1.00) |
0.0651 (1.00) |
0.444 (1.00) |
0.00776 (1.00) |
0.00854 (1.00) |
0.174 (1.00) |
0.345 (1.00) |
0.0955 (1.00) |
0.269 (1.00) |
| 8p gain | 30 (6%) | 486 |
0.576 (1.00) |
0.162 (1.00) |
0.0018 (1.00) |
0.00183 (1.00) |
1 (1.00) |
0.35 (1.00) |
0.56 (1.00) |
0.491 (1.00) |
0.481 (1.00) |
0.381 (1.00) |
|
| 8q gain | 61 (12%) | 455 |
0.4 (1.00) |
0.0424 (1.00) |
0.00695 (1.00) |
0.0106 (1.00) |
0.449 (1.00) |
0.201 (1.00) |
0.118 (1.00) |
0.897 (1.00) |
0.923 (1.00) |
0.497 (1.00) |
|
| 9p gain | 13 (3%) | 503 |
0.349 (1.00) |
0.679 (1.00) |
0.947 (1.00) |
0.0539 (1.00) |
1 (1.00) |
0.353 (1.00) |
0.0172 (1.00) |
0.446 (1.00) |
0.563 (1.00) |
||
| 9q gain | 12 (2%) | 504 |
0.728 (1.00) |
0.34 (1.00) |
0.237 (1.00) |
0.00252 (1.00) |
1 (1.00) |
1 (1.00) |
0.13 (1.00) |
1 (1.00) |
0.563 (1.00) |
||
| 10p gain | 17 (3%) | 499 |
0.174 (1.00) |
0.0962 (1.00) |
0.355 (1.00) |
0.12 (1.00) |
0.107 (1.00) |
0.863 (1.00) |
0.619 (1.00) |
0.244 (1.00) |
0.533 (1.00) |
1 (1.00) |
|
| 10q gain | 12 (2%) | 504 |
0.0509 (1.00) |
0.0152 (1.00) |
0.847 (1.00) |
0.883 (1.00) |
0.261 (1.00) |
1 (1.00) |
0.366 (1.00) |
0.626 (1.00) |
0.679 (1.00) |
1 (1.00) |
|
| 11p gain | 31 (6%) | 485 |
0.211 (1.00) |
0.996 (1.00) |
0.0341 (1.00) |
0.0164 (1.00) |
1 (1.00) |
0.205 (1.00) |
0.704 (1.00) |
0.943 (1.00) |
1 (1.00) |
1 (1.00) |
|
| 11q gain | 29 (6%) | 487 |
0.689 (1.00) |
0.938 (1.00) |
0.195 (1.00) |
0.1 (1.00) |
1 (1.00) |
0.592 (1.00) |
1 (1.00) |
1 (1.00) |
1 (1.00) |
||
| 12p gain | 119 (23%) | 397 |
0.297 (1.00) |
0.142 (1.00) |
0.00057 (0.421) |
0.00201 (1.00) |
0.0885 (1.00) |
0.0237 (1.00) |
0.447 (1.00) |
0.0246 (1.00) |
0.127 (1.00) |
0.224 (1.00) |
|
| 12q gain | 120 (23%) | 396 |
0.324 (1.00) |
0.269 (1.00) |
0.00043 (0.319) |
0.00135 (0.987) |
0.0885 (1.00) |
0.0278 (1.00) |
0.386 (1.00) |
0.0246 (1.00) |
0.112 (1.00) |
0.225 (1.00) |
|
| 13q gain | 22 (4%) | 494 |
0.119 (1.00) |
0.253 (1.00) |
0.15 (1.00) |
0.218 (1.00) |
1 (1.00) |
0.48 (1.00) |
0.257 (1.00) |
0.129 (1.00) |
0.0972 (1.00) |
||
| 14q gain | 16 (3%) | 500 |
0.585 (1.00) |
0.472 (1.00) |
0.244 (1.00) |
0.00652 (1.00) |
1 (1.00) |
0.442 (1.00) |
0.796 (1.00) |
1 (1.00) |
1 (1.00) |
||
| 15q gain | 26 (5%) | 490 |
0.682 (1.00) |
0.459 (1.00) |
0.594 (1.00) |
0.425 (1.00) |
0.212 (1.00) |
0.619 (1.00) |
0.677 (1.00) |
0.0304 (1.00) |
0.814 (1.00) |
1 (1.00) |
|
| 16p gain | 105 (20%) | 411 |
0.953 (1.00) |
0.216 (1.00) |
0.178 (1.00) |
0.0944 (1.00) |
0.134 (1.00) |
0.526 (1.00) |
0.733 (1.00) |
0.835 (1.00) |
0.253 (1.00) |
1 (1.00) |
|
| 16q gain | 97 (19%) | 419 |
0.651 (1.00) |
0.299 (1.00) |
0.187 (1.00) |
0.064 (1.00) |
0.211 (1.00) |
0.766 (1.00) |
1 (1.00) |
0.988 (1.00) |
0.428 (1.00) |
0.786 (1.00) |
|
| 17p gain | 25 (5%) | 491 |
0.966 (1.00) |
0.399 (1.00) |
0.0852 (1.00) |
0.836 (1.00) |
0.212 (1.00) |
0.0387 (1.00) |
0.831 (1.00) |
0.159 (1.00) |
0.0405 (1.00) |
0.611 (1.00) |
|
| 17q gain | 32 (6%) | 484 |
0.789 (1.00) |
0.238 (1.00) |
0.509 (1.00) |
0.69 (1.00) |
0.325 (1.00) |
0.312 (1.00) |
0.851 (1.00) |
0.461 (1.00) |
0.058 (1.00) |
0.629 (1.00) |
|
| 18p gain | 25 (5%) | 491 |
0.235 (1.00) |
0.811 (1.00) |
0.686 (1.00) |
0.873 (1.00) |
1 (1.00) |
0.482 (1.00) |
0.133 (1.00) |
0.809 (1.00) |
0.347 (1.00) |
||
| 18q gain | 25 (5%) | 491 |
0.249 (1.00) |
0.624 (1.00) |
0.513 (1.00) |
0.771 (1.00) |
0.602 (1.00) |
0.483 (1.00) |
0.133 (1.00) |
0.811 (1.00) |
0.347 (1.00) |
||
| 19p gain | 51 (10%) | 465 |
0.624 (1.00) |
0.681 (1.00) |
0.00687 (1.00) |
0.0173 (1.00) |
0.404 (1.00) |
0.00852 (1.00) |
0.219 (1.00) |
0.369 (1.00) |
0.135 (1.00) |
0.733 (1.00) |
|
| 19q gain | 57 (11%) | 459 |
0.713 (1.00) |
0.396 (1.00) |
0.00162 (1.00) |
0.00668 (1.00) |
0.436 (1.00) |
0.00312 (1.00) |
0.242 (1.00) |
0.369 (1.00) |
0.107 (1.00) |
1 (1.00) |
|
| 21q gain | 49 (9%) | 467 |
0.595 (1.00) |
0.0959 (1.00) |
0.217 (1.00) |
0.104 (1.00) |
1 (1.00) |
0.724 (1.00) |
0.438 (1.00) |
0.765 (1.00) |
0.179 (1.00) |
0.719 (1.00) |
|
| 22q gain | 40 (8%) | 476 |
0.456 (1.00) |
0.566 (1.00) |
0.749 (1.00) |
0.0986 (1.00) |
1 (1.00) |
0.527 (1.00) |
0.304 (1.00) |
0.304 (1.00) |
0.332 (1.00) |
1 (1.00) |
|
| xq gain | 30 (6%) | 486 |
0.265 (1.00) |
0.797 (1.00) |
0.106 (1.00) |
0.182 (1.00) |
1 (1.00) |
0.0337 (1.00) |
0.696 (1.00) |
1 (1.00) |
0.49 (1.00) |
0.629 (1.00) |
|
| 1p loss | 55 (11%) | 461 |
0.0728 (1.00) |
0.0944 (1.00) |
0.593 (1.00) |
0.0177 (1.00) |
0.702 (1.00) |
0.221 (1.00) |
0.182 (1.00) |
0.765 (1.00) |
0.502 (1.00) |
0.203 (1.00) |
|
| 1q loss | 36 (7%) | 480 |
0.666 (1.00) |
0.661 (1.00) |
0.813 (1.00) |
0.0778 (1.00) |
1 (1.00) |
0.307 (1.00) |
0.59 (1.00) |
0.943 (1.00) |
0.552 (1.00) |
0.462 (1.00) |
|
| 2p loss | 14 (3%) | 502 |
0.00654 (1.00) |
0.834 (1.00) |
0.455 (1.00) |
0.131 (1.00) |
1 (1.00) |
0.828 (1.00) |
0.779 (1.00) |
0.0397 (1.00) |
1 (1.00) |
||
| 2q loss | 14 (3%) | 502 |
0.102 (1.00) |
0.81 (1.00) |
0.562 (1.00) |
0.229 (1.00) |
1 (1.00) |
0.831 (1.00) |
0.779 (1.00) |
0.0982 (1.00) |
1 (1.00) |
||
| 3p loss | 371 (72%) | 145 |
0.894 (1.00) |
0.683 (1.00) |
0.0243 (1.00) |
0.032 (1.00) |
0.792 (1.00) |
0.254 (1.00) |
0.0108 (1.00) |
0.43 (1.00) |
0.251 (1.00) |
0.108 (1.00) |
0.654 (1.00) |
| 5q loss | 6 (1%) | 510 |
0.15 (1.00) |
0.0059 (1.00) |
0.00039 (0.289) |
1 (1.00) |
0.396 (1.00) |
0.672 (1.00) |
1 (1.00) |
1 (1.00) |
|||
| 6p loss | 100 (19%) | 416 |
0.207 (1.00) |
0.276 (1.00) |
0.0765 (1.00) |
0.0283 (1.00) |
0.00564 (1.00) |
0.371 (1.00) |
0.0011 (0.807) |
0.033 (1.00) |
0.779 (1.00) |
0.166 (1.00) |
1 (1.00) |
| 6q loss | 128 (25%) | 388 |
0.563 (1.00) |
0.679 (1.00) |
0.423 (1.00) |
0.245 (1.00) |
0.00134 (0.981) |
0.844 (1.00) |
0.0564 (1.00) |
0.444 (1.00) |
0.0591 (1.00) |
0.381 (1.00) |
0.485 (1.00) |
| 7q loss | 3 (1%) | 513 |
0.597 (1.00) |
0.122 (1.00) |
0.0103 (1.00) |
0.0723 (1.00) |
1 (1.00) |
0.556 (1.00) |
1 (1.00) |
0.138 (1.00) |
|||
| 8p loss | 135 (26%) | 381 |
0.387 (1.00) |
0.806 (1.00) |
0.308 (1.00) |
0.175 (1.00) |
0.775 (1.00) |
0.152 (1.00) |
0.0285 (1.00) |
0.377 (1.00) |
0.731 (1.00) |
0.18 (1.00) |
0.0566 (1.00) |
| 8q loss | 63 (12%) | 453 |
0.971 (1.00) |
0.648 (1.00) |
0.536 (1.00) |
0.234 (1.00) |
0.436 (1.00) |
0.745 (1.00) |
0.0168 (1.00) |
0.41 (1.00) |
0.213 (1.00) |
0.0519 (1.00) |
|
| 10p loss | 65 (13%) | 451 |
0.821 (1.00) |
0.481 (1.00) |
0.0511 (1.00) |
0.00642 (1.00) |
0.141 (1.00) |
0.196 (1.00) |
0.269 (1.00) |
0.0408 (1.00) |
0.462 (1.00) |
0.203 (1.00) |
|
| 10q loss | 87 (17%) | 429 |
0.851 (1.00) |
0.676 (1.00) |
0.0807 (1.00) |
0.00167 (1.00) |
0.322 (1.00) |
0.0961 (1.00) |
0.0862 (1.00) |
0.231 (1.00) |
0.196 (1.00) |
0.276 (1.00) |
|
| 11p loss | 18 (3%) | 498 |
0.46 (1.00) |
0.0541 (1.00) |
0.386 (1.00) |
0.435 (1.00) |
0.157 (1.00) |
0.566 (1.00) |
1 (1.00) |
0.626 (1.00) |
1 (1.00) |
0.611 (1.00) |
|
| 11q loss | 23 (4%) | 493 |
0.119 (1.00) |
0.00592 (1.00) |
0.66 (1.00) |
0.566 (1.00) |
0.24 (1.00) |
0.507 (1.00) |
0.378 (1.00) |
0.244 (1.00) |
0.797 (1.00) |
1 (1.00) |
|
| 12p loss | 3 (1%) | 513 |
0.675 (1.00) |
0.812 (1.00) |
0.481 (1.00) |
0.741 (1.00) |
1 (1.00) |
1 (1.00) |
1 (1.00) |
1 (1.00) |
1 (1.00) |
||
| 12q loss | 4 (1%) | 512 |
0.675 (1.00) |
0.315 (1.00) |
0.167 (1.00) |
0.417 (1.00) |
1 (1.00) |
1 (1.00) |
1 (1.00) |
1 (1.00) |
1 (1.00) |
||
| 16p loss | 9 (2%) | 507 |
0.624 (1.00) |
0.984 (1.00) |
0.244 (1.00) |
0.00813 (1.00) |
0.366 (1.00) |
1 (1.00) |
1 (1.00) |
0.625 (1.00) |
1 (1.00) |
||
| 16q loss | 14 (3%) | 502 |
0.522 (1.00) |
0.559 (1.00) |
0.165 (1.00) |
0.00252 (1.00) |
0.456 (1.00) |
0.559 (1.00) |
0.779 (1.00) |
0.479 (1.00) |
1 (1.00) |
||
| 17p loss | 45 (9%) | 471 |
0.0287 (1.00) |
0.286 (1.00) |
0.238 (1.00) |
0.202 (1.00) |
0.374 (1.00) |
0.0814 (1.00) |
0.195 (1.00) |
0.329 (1.00) |
1 (1.00) |
0.712 (1.00) |
|
| 17q loss | 28 (5%) | 488 |
0.661 (1.00) |
0.793 (1.00) |
0.328 (1.00) |
0.298 (1.00) |
1 (1.00) |
0.258 (1.00) |
0.232 (1.00) |
1 (1.00) |
1 (1.00) |
||
| 18q loss | 94 (18%) | 422 |
0.00266 (1.00) |
0.149 (1.00) |
0.00904 (1.00) |
0.00444 (1.00) |
1 (1.00) |
0.084 (1.00) |
0.122 (1.00) |
0.851 (1.00) |
0.391 (1.00) |
0.281 (1.00) |
|
| 19p loss | 11 (2%) | 505 |
0.0926 (1.00) |
0.0263 (1.00) |
0.00069 (0.507) |
1 (1.00) |
0.602 (1.00) |
0.754 (1.00) |
0.213 (1.00) |
1 (1.00) |
|||
| 19q loss | 4 (1%) | 512 |
0.846 (1.00) |
0.235 (1.00) |
0.00312 (1.00) |
1 (1.00) |
0.244 (1.00) |
1 (1.00) |
1 (1.00) |
1 (1.00) |
|||
| 20p loss | 8 (2%) | 508 |
0.569 (1.00) |
0.701 (1.00) |
0.758 (1.00) |
0.619 (1.00) |
1 (1.00) |
0.533 (1.00) |
1 (1.00) |
0.144 (1.00) |
0.257 (1.00) |
||
| 20q loss | 3 (1%) | 513 |
0.114 (1.00) |
0.234 (1.00) |
0.111 (1.00) |
0.466 (1.00) |
1 (1.00) |
1 (1.00) |
0.0714 (1.00) |
||||
| 21q loss | 54 (10%) | 462 |
0.67 (1.00) |
0.709 (1.00) |
0.183 (1.00) |
0.00214 (1.00) |
0.0916 (1.00) |
0.91 (1.00) |
0.55 (1.00) |
1 (1.00) |
0.607 (1.00) |
1 (1.00) |
|
| 22q loss | 39 (8%) | 477 |
0.0132 (1.00) |
0.246 (1.00) |
0.0244 (1.00) |
0.18 (1.00) |
1 (1.00) |
0.173 (1.00) |
0.863 (1.00) |
0.357 (1.00) |
0.877 (1.00) |
0.0112 (1.00) |
|
| xq loss | 46 (9%) | 470 |
0.111 (1.00) |
0.505 (1.00) |
0.752 (1.00) |
0.19 (1.00) |
0.325 (1.00) |
0.896 (1.00) |
0.0782 (1.00) |
0.715 (1.00) |
0.149 (1.00) |
P value = 1e-04 (Fisher's exact test), Q value = 0.075
Table S1. Gene #6: '3q gain' versus Clinical Feature #4: 'PATHOLOGY.T.STAGE'
| nPatients | T1 | T2 | T3 | T4 |
|---|---|---|---|---|
| ALL | 258 | 69 | 178 | 11 |
| 3Q GAIN MUTATED | 17 | 6 | 33 | 4 |
| 3Q GAIN WILD-TYPE | 241 | 63 | 145 | 7 |
Figure S1. Get High-res Image Gene #6: '3q gain' versus Clinical Feature #4: 'PATHOLOGY.T.STAGE'
P value = 0.000235 (Wilcoxon-test), Q value = 0.18
Table S2. Gene #9: '5p gain' versus Clinical Feature #2: 'AGE'
| nPatients | Mean (Std.Dev) | |
|---|---|---|
| ALL | 515 | 60.5 (12.1) |
| 5P GAIN MUTATED | 191 | 63.1 (11.8) |
| 5P GAIN WILD-TYPE | 324 | 59.0 (12.0) |
Figure S2. Get High-res Image Gene #9: '5p gain' versus Clinical Feature #2: 'AGE'
P value = 3e-05 (Fisher's exact test), Q value = 0.023
Table S3. Gene #36: '20p gain' versus Clinical Feature #3: 'NEOPLASM.DISEASESTAGE'
| nPatients | STAGE I | STAGE II | STAGE III | STAGE IV |
|---|---|---|---|---|
| ALL | 253 | 57 | 126 | 80 |
| 20P GAIN MUTATED | 33 | 12 | 39 | 26 |
| 20P GAIN WILD-TYPE | 220 | 45 | 87 | 54 |
Figure S3. Get High-res Image Gene #36: '20p gain' versus Clinical Feature #3: 'NEOPLASM.DISEASESTAGE'
P value = 1e-05 (Fisher's exact test), Q value = 0.0077
Table S4. Gene #36: '20p gain' versus Clinical Feature #4: 'PATHOLOGY.T.STAGE'
| nPatients | T1 | T2 | T3 | T4 |
|---|---|---|---|---|
| ALL | 258 | 69 | 178 | 11 |
| 20P GAIN MUTATED | 34 | 13 | 57 | 6 |
| 20P GAIN WILD-TYPE | 224 | 56 | 121 | 5 |
Figure S4. Get High-res Image Gene #36: '20p gain' versus Clinical Feature #4: 'PATHOLOGY.T.STAGE'
P value = 3e-05 (Fisher's exact test), Q value = 0.023
Table S5. Gene #37: '20q gain' versus Clinical Feature #3: 'NEOPLASM.DISEASESTAGE'
| nPatients | STAGE I | STAGE II | STAGE III | STAGE IV |
|---|---|---|---|---|
| ALL | 253 | 57 | 126 | 80 |
| 20Q GAIN MUTATED | 34 | 12 | 41 | 26 |
| 20Q GAIN WILD-TYPE | 219 | 45 | 85 | 54 |
Figure S5. Get High-res Image Gene #37: '20q gain' versus Clinical Feature #3: 'NEOPLASM.DISEASESTAGE'
P value = 2e-05 (Fisher's exact test), Q value = 0.015
Table S6. Gene #37: '20q gain' versus Clinical Feature #4: 'PATHOLOGY.T.STAGE'
| nPatients | T1 | T2 | T3 | T4 |
|---|---|---|---|---|
| ALL | 258 | 69 | 178 | 11 |
| 20Q GAIN MUTATED | 36 | 13 | 59 | 5 |
| 20Q GAIN WILD-TYPE | 222 | 56 | 119 | 6 |
Figure S6. Get High-res Image Gene #37: '20q gain' versus Clinical Feature #4: 'PATHOLOGY.T.STAGE'

P value = 0.000154 (Fisher's exact test), Q value = 0.12
Table S7. Gene #46: '3q loss' versus Clinical Feature #7: 'GENDER'
| nPatients | FEMALE | MALE |
|---|---|---|
| ALL | 186 | 330 |
| 3Q LOSS MUTATED | 19 | 78 |
| 3Q LOSS WILD-TYPE | 167 | 252 |
Figure S7. Get High-res Image Gene #46: '3q loss' versus Clinical Feature #7: 'GENDER'
P value = 0.00022 (Fisher's exact test), Q value = 0.16
Table S8. Gene #47: '4p loss' versus Clinical Feature #4: 'PATHOLOGY.T.STAGE'
| nPatients | T1 | T2 | T3 | T4 |
|---|---|---|---|---|
| ALL | 258 | 69 | 178 | 11 |
| 4P LOSS MUTATED | 22 | 8 | 38 | 4 |
| 4P LOSS WILD-TYPE | 236 | 61 | 140 | 7 |
Figure S8. Get High-res Image Gene #47: '4p loss' versus Clinical Feature #4: 'PATHOLOGY.T.STAGE'
P value = 1e-05 (Fisher's exact test), Q value = 0.0077
Table S9. Gene #48: '4q loss' versus Clinical Feature #3: 'NEOPLASM.DISEASESTAGE'
| nPatients | STAGE I | STAGE II | STAGE III | STAGE IV |
|---|---|---|---|---|
| ALL | 253 | 57 | 126 | 80 |
| 4Q LOSS MUTATED | 15 | 6 | 24 | 20 |
| 4Q LOSS WILD-TYPE | 238 | 51 | 102 | 60 |
Figure S9. Get High-res Image Gene #48: '4q loss' versus Clinical Feature #3: 'NEOPLASM.DISEASESTAGE'
P value = 2e-05 (Fisher's exact test), Q value = 0.015
Table S10. Gene #48: '4q loss' versus Clinical Feature #4: 'PATHOLOGY.T.STAGE'
| nPatients | T1 | T2 | T3 | T4 |
|---|---|---|---|---|
| ALL | 258 | 69 | 178 | 11 |
| 4Q LOSS MUTATED | 16 | 8 | 36 | 5 |
| 4Q LOSS WILD-TYPE | 242 | 61 | 142 | 6 |
Figure S10. Get High-res Image Gene #48: '4q loss' versus Clinical Feature #4: 'PATHOLOGY.T.STAGE'
P value = 0.00022 (Fisher's exact test), Q value = 0.16
Table S11. Gene #49: '5p loss' versus Clinical Feature #4: 'PATHOLOGY.T.STAGE'
| nPatients | T1 | T2 | T3 | T4 |
|---|---|---|---|---|
| ALL | 258 | 69 | 178 | 11 |
| 5P LOSS MUTATED | 0 | 3 | 2 | 2 |
| 5P LOSS WILD-TYPE | 258 | 66 | 176 | 9 |
Figure S11. Get High-res Image Gene #49: '5p loss' versus Clinical Feature #4: 'PATHOLOGY.T.STAGE'
P value = 2e-05 (Fisher's exact test), Q value = 0.015
Table S12. Gene #56: '9p loss' versus Clinical Feature #3: 'NEOPLASM.DISEASESTAGE'
| nPatients | STAGE I | STAGE II | STAGE III | STAGE IV |
|---|---|---|---|---|
| ALL | 253 | 57 | 126 | 80 |
| 9P LOSS MUTATED | 51 | 11 | 50 | 35 |
| 9P LOSS WILD-TYPE | 202 | 46 | 76 | 45 |
Figure S12. Get High-res Image Gene #56: '9p loss' versus Clinical Feature #3: 'NEOPLASM.DISEASESTAGE'

P value = 5e-05 (Fisher's exact test), Q value = 0.038
Table S13. Gene #56: '9p loss' versus Clinical Feature #4: 'PATHOLOGY.T.STAGE'
| nPatients | T1 | T2 | T3 | T4 |
|---|---|---|---|---|
| ALL | 258 | 69 | 178 | 11 |
| 9P LOSS MUTATED | 54 | 15 | 73 | 5 |
| 9P LOSS WILD-TYPE | 204 | 54 | 105 | 6 |
Figure S13. Get High-res Image Gene #56: '9p loss' versus Clinical Feature #4: 'PATHOLOGY.T.STAGE'
P value = 1e-05 (Fisher's exact test), Q value = 0.0077
Table S14. Gene #57: '9q loss' versus Clinical Feature #3: 'NEOPLASM.DISEASESTAGE'
| nPatients | STAGE I | STAGE II | STAGE III | STAGE IV |
|---|---|---|---|---|
| ALL | 253 | 57 | 126 | 80 |
| 9Q LOSS MUTATED | 48 | 14 | 52 | 34 |
| 9Q LOSS WILD-TYPE | 205 | 43 | 74 | 46 |
Figure S14. Get High-res Image Gene #57: '9q loss' versus Clinical Feature #3: 'NEOPLASM.DISEASESTAGE'
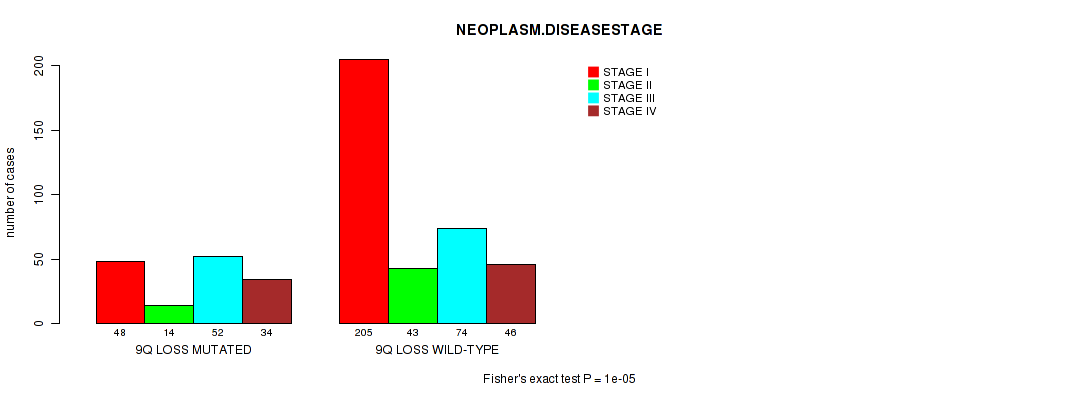
P value = 2e-05 (Fisher's exact test), Q value = 0.015
Table S15. Gene #57: '9q loss' versus Clinical Feature #4: 'PATHOLOGY.T.STAGE'
| nPatients | T1 | T2 | T3 | T4 |
|---|---|---|---|---|
| ALL | 258 | 69 | 178 | 11 |
| 9Q LOSS MUTATED | 50 | 18 | 76 | 4 |
| 9Q LOSS WILD-TYPE | 208 | 51 | 102 | 7 |
Figure S15. Get High-res Image Gene #57: '9q loss' versus Clinical Feature #4: 'PATHOLOGY.T.STAGE'
P value = 0.00013 (Fisher's exact test), Q value = 0.098
Table S16. Gene #64: '13q loss' versus Clinical Feature #3: 'NEOPLASM.DISEASESTAGE'
| nPatients | STAGE I | STAGE II | STAGE III | STAGE IV |
|---|---|---|---|---|
| ALL | 253 | 57 | 126 | 80 |
| 13Q LOSS MUTATED | 24 | 2 | 25 | 19 |
| 13Q LOSS WILD-TYPE | 229 | 55 | 101 | 61 |
Figure S16. Get High-res Image Gene #64: '13q loss' versus Clinical Feature #3: 'NEOPLASM.DISEASESTAGE'
P value = 1e-05 (Fisher's exact test), Q value = 0.0077
Table S17. Gene #64: '13q loss' versus Clinical Feature #4: 'PATHOLOGY.T.STAGE'
| nPatients | T1 | T2 | T3 | T4 |
|---|---|---|---|---|
| ALL | 258 | 69 | 178 | 11 |
| 13Q LOSS MUTATED | 26 | 3 | 34 | 7 |
| 13Q LOSS WILD-TYPE | 232 | 66 | 144 | 4 |
Figure S17. Get High-res Image Gene #64: '13q loss' versus Clinical Feature #4: 'PATHOLOGY.T.STAGE'
P value = 4e-05 (Fisher's exact test), Q value = 0.03
Table S18. Gene #65: '14q loss' versus Clinical Feature #3: 'NEOPLASM.DISEASESTAGE'
| nPatients | STAGE I | STAGE II | STAGE III | STAGE IV |
|---|---|---|---|---|
| ALL | 253 | 57 | 126 | 80 |
| 14Q LOSS MUTATED | 78 | 26 | 64 | 45 |
| 14Q LOSS WILD-TYPE | 175 | 31 | 62 | 35 |
Figure S18. Get High-res Image Gene #65: '14q loss' versus Clinical Feature #3: 'NEOPLASM.DISEASESTAGE'
P value = 6e-05 (Fisher's exact test), Q value = 0.045
Table S19. Gene #65: '14q loss' versus Clinical Feature #4: 'PATHOLOGY.T.STAGE'
| nPatients | T1 | T2 | T3 | T4 |
|---|---|---|---|---|
| ALL | 258 | 69 | 178 | 11 |
| 14Q LOSS MUTATED | 83 | 34 | 93 | 3 |
| 14Q LOSS WILD-TYPE | 175 | 35 | 85 | 8 |
Figure S19. Get High-res Image Gene #65: '14q loss' versus Clinical Feature #4: 'PATHOLOGY.T.STAGE'
P value = 0.00023 (Fisher's exact test), Q value = 0.17
Table S20. Gene #66: '15q loss' versus Clinical Feature #4: 'PATHOLOGY.T.STAGE'
| nPatients | T1 | T2 | T3 | T4 |
|---|---|---|---|---|
| ALL | 258 | 69 | 178 | 11 |
| 15Q LOSS MUTATED | 9 | 2 | 21 | 3 |
| 15Q LOSS WILD-TYPE | 249 | 67 | 157 | 8 |
Figure S20. Get High-res Image Gene #66: '15q loss' versus Clinical Feature #4: 'PATHOLOGY.T.STAGE'
P value = 0.00032 (Fisher's exact test), Q value = 0.24
Table S21. Gene #71: '18p loss' versus Clinical Feature #4: 'PATHOLOGY.T.STAGE'
| nPatients | T1 | T2 | T3 | T4 |
|---|---|---|---|---|
| ALL | 258 | 69 | 178 | 11 |
| 18P LOSS MUTATED | 32 | 9 | 46 | 5 |
| 18P LOSS WILD-TYPE | 226 | 60 | 132 | 6 |
Figure S21. Get High-res Image Gene #71: '18p loss' versus Clinical Feature #4: 'PATHOLOGY.T.STAGE'
-
Copy number data file = transformed.cor.cli.txt
-
Clinical data file = KIRC-TP.merged_data.txt
-
Number of patients = 516
-
Number of significantly arm-level cnvs = 79
-
Number of selected clinical features = 11
-
Exclude regions that fewer than K tumors have mutations, K = 3
For survival clinical features, the Kaplan-Meier survival curves of tumors with and without gene mutations were plotted and the statistical significance P values were estimated by logrank test (Bland and Altman 2004) using the 'survdiff' function in R
For binary or multi-class clinical features (nominal or ordinal), two-tailed Fisher's exact tests (Fisher 1922) were used to estimate the P values using the 'fisher.test' function in R
For multiple hypothesis correction, Q value is the False Discovery Rate (FDR) analogue of the P value (Benjamini and Hochberg 1995), defined as the minimum FDR at which the test may be called significant. We used the 'Benjamini and Hochberg' method of 'p.adjust' function in R to convert P values into Q values.
In addition to the links below, the full results of the analysis summarized in this report can also be downloaded programmatically using firehose_get, or interactively from either the Broad GDAC website or TCGA Data Coordination Center Portal.