This pipeline computes the correlation between significant arm-level copy number variations (cnvs) and selected clinical features.
Testing the association between copy number variation 70 arm-level events and 11 clinical features across 221 patients, 41 significant findings detected with Q value < 0.25.
-
1p gain cnv correlated to 'Time to Death'.
-
1q gain cnv correlated to 'Time to Death', 'NEOPLASM.DISEASESTAGE', and 'PATHOLOGY.T.STAGE'.
-
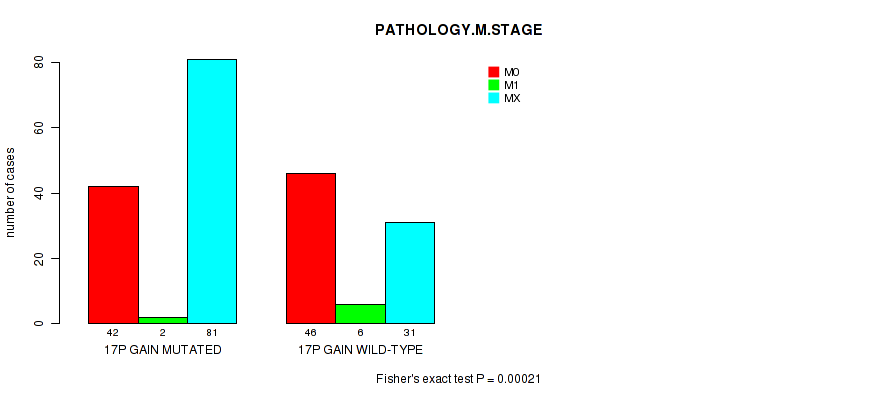
17p gain cnv correlated to 'PATHOLOGY.M.STAGE'.
-
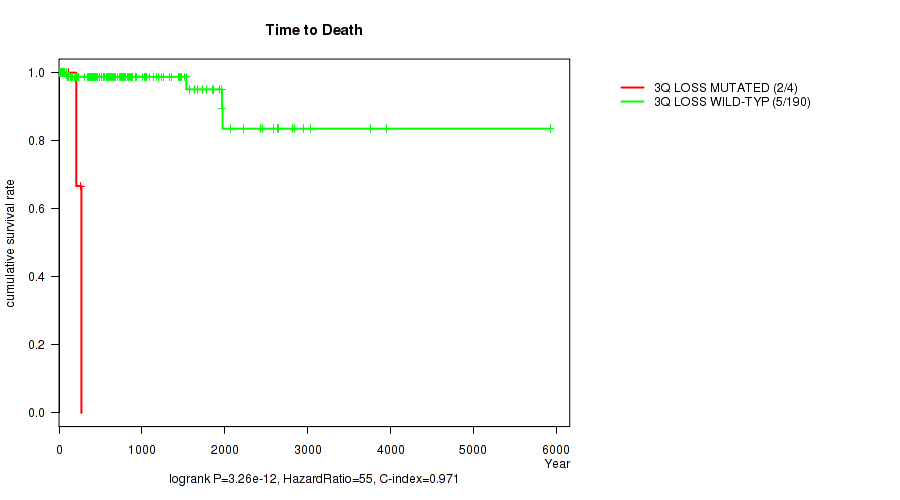
3q loss cnv correlated to 'Time to Death'.
-
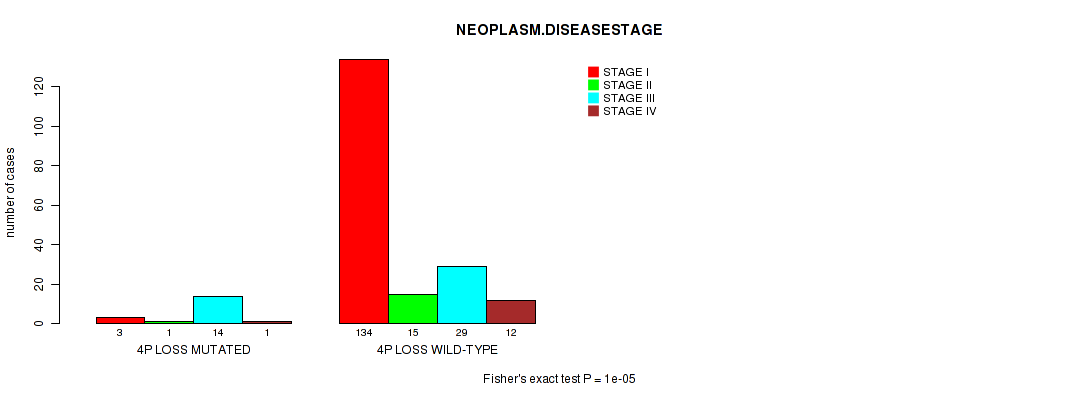
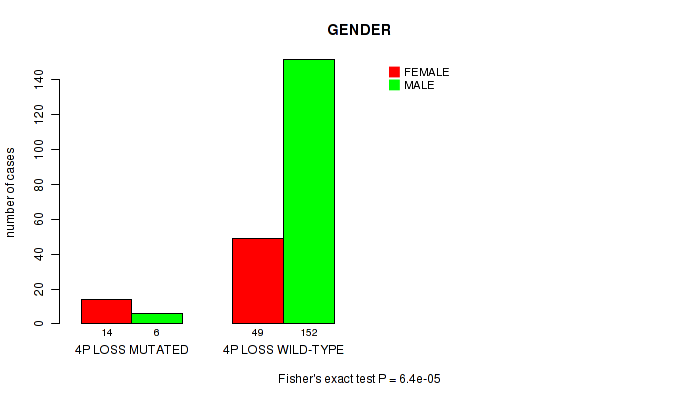
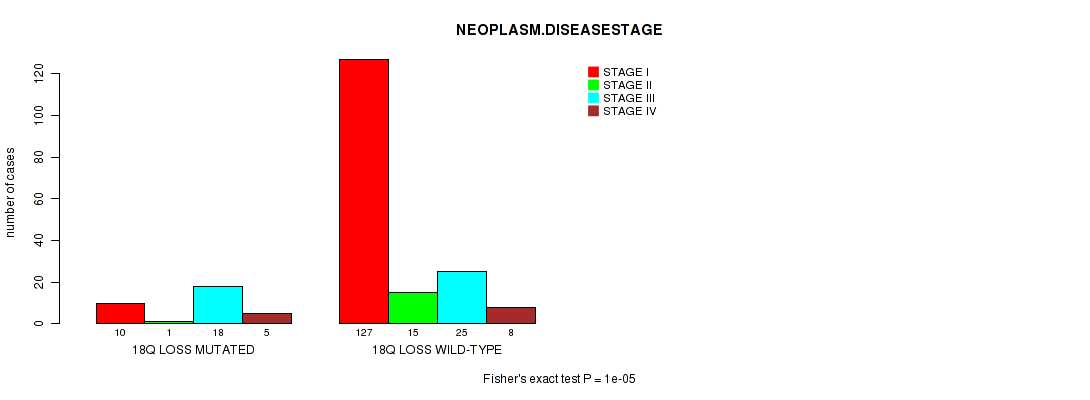
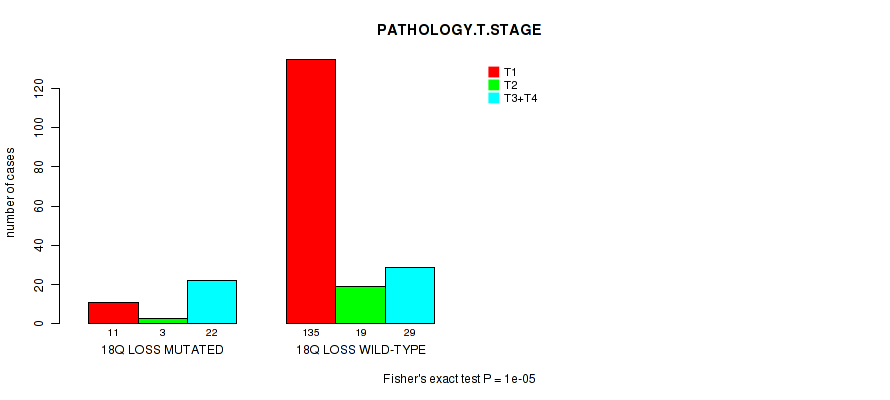
4p loss cnv correlated to 'NEOPLASM.DISEASESTAGE', 'PATHOLOGY.T.STAGE', and 'GENDER'.
-
4q loss cnv correlated to 'NEOPLASM.DISEASESTAGE' and 'PATHOLOGY.T.STAGE'.
-
5p loss cnv correlated to 'Time to Death'.
-
5q loss cnv correlated to 'Time to Death'.
-
8p loss cnv correlated to 'Time to Death'.
-
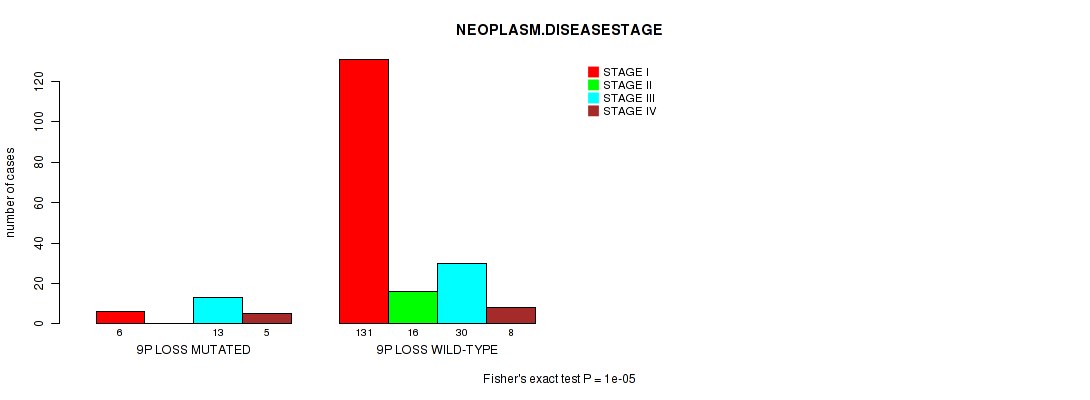
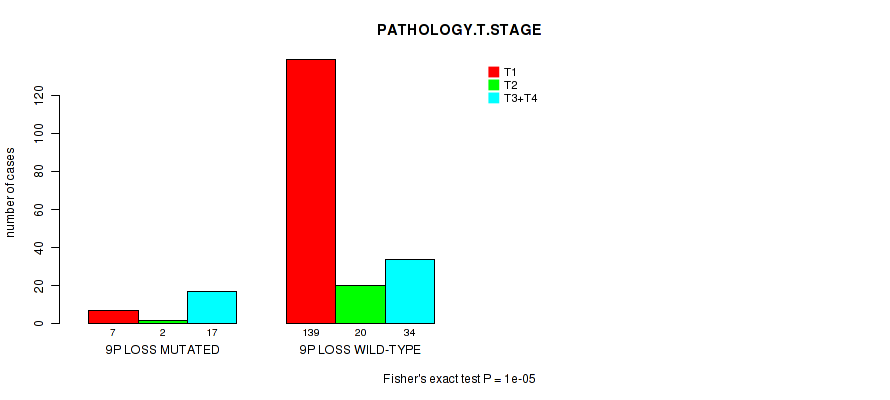
9p loss cnv correlated to 'NEOPLASM.DISEASESTAGE' and 'PATHOLOGY.T.STAGE'.
-
9q loss cnv correlated to 'NEOPLASM.DISEASESTAGE' and 'PATHOLOGY.T.STAGE'.
-
11p loss cnv correlated to 'Time to Death'.
-
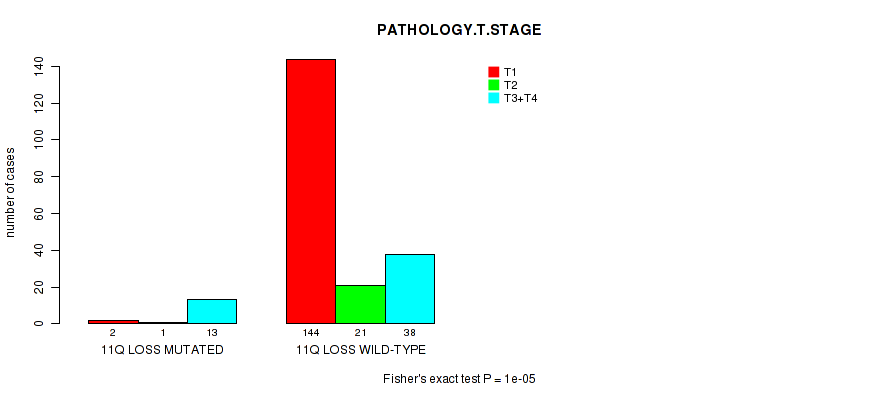
11q loss cnv correlated to 'NEOPLASM.DISEASESTAGE' and 'PATHOLOGY.T.STAGE'.
-
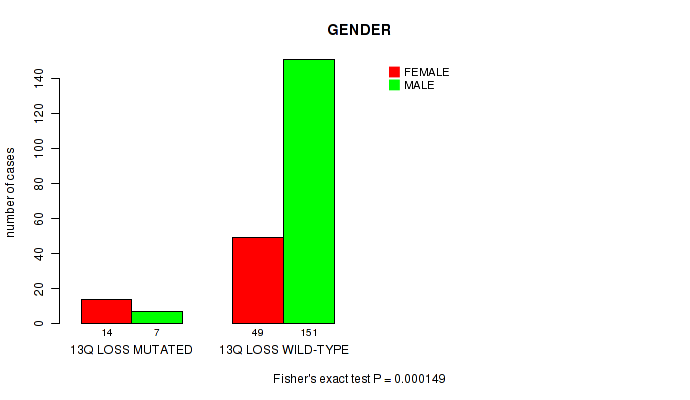
13q loss cnv correlated to 'Time to Death', 'NEOPLASM.DISEASESTAGE', 'PATHOLOGY.T.STAGE', and 'GENDER'.
-
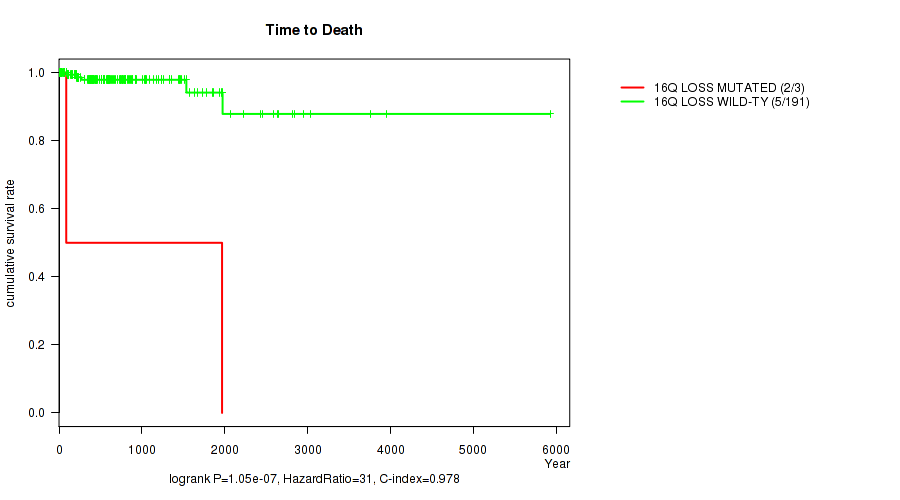
16q loss cnv correlated to 'Time to Death'.
-
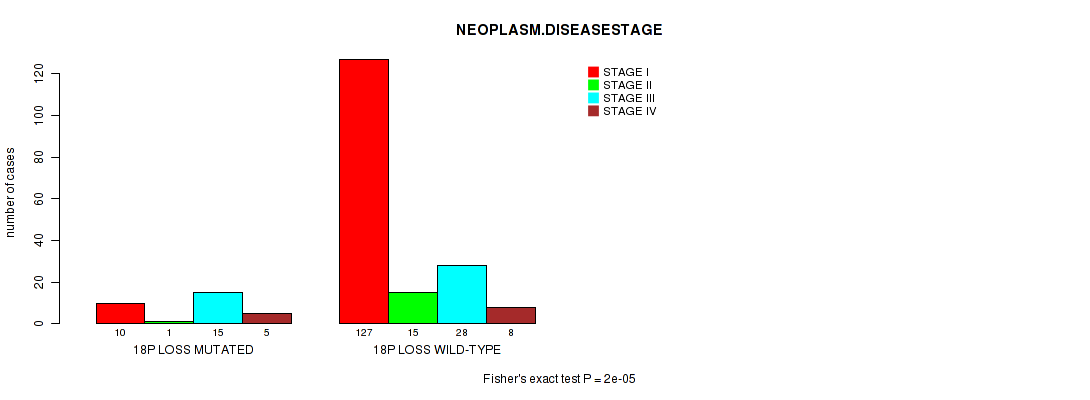
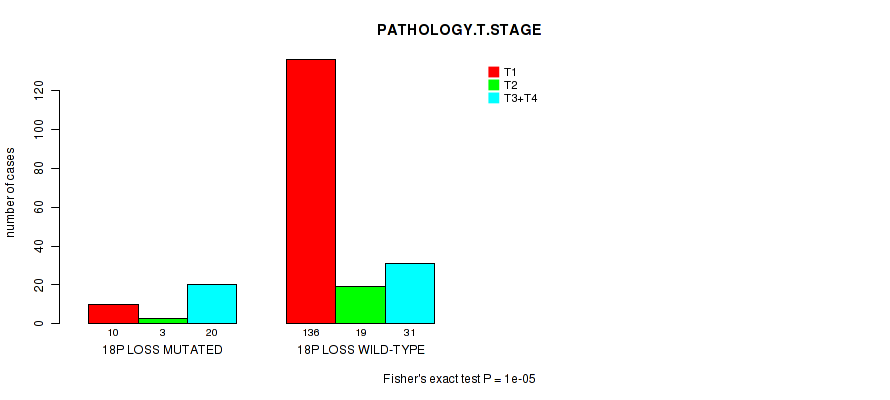
18p loss cnv correlated to 'NEOPLASM.DISEASESTAGE' and 'PATHOLOGY.T.STAGE'.
-
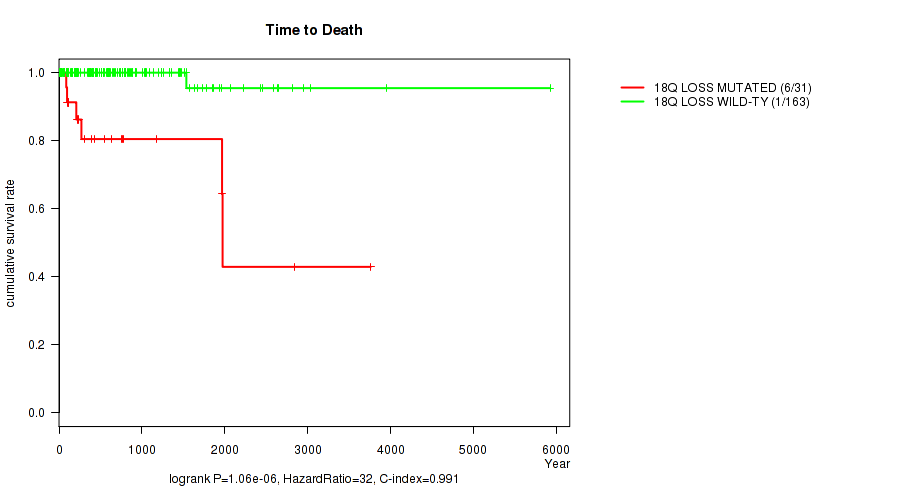
18q loss cnv correlated to 'Time to Death', 'NEOPLASM.DISEASESTAGE', and 'PATHOLOGY.T.STAGE'.
-
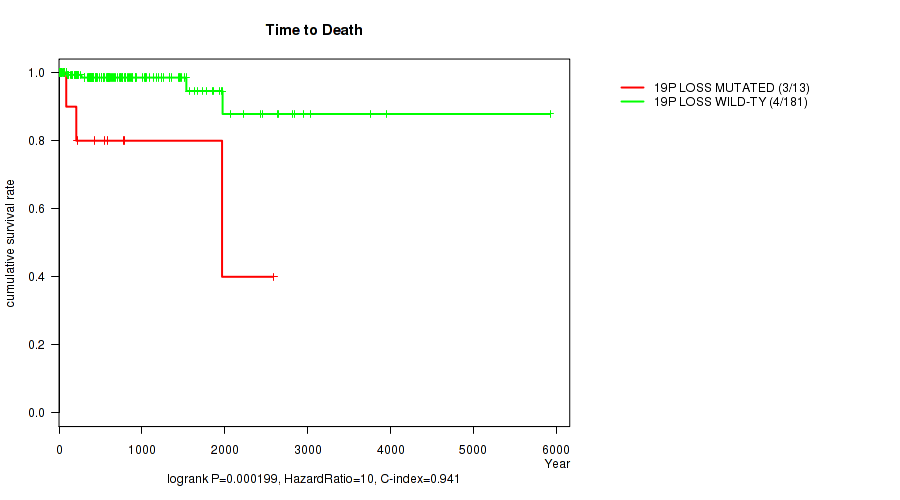
19p loss cnv correlated to 'Time to Death'.
-
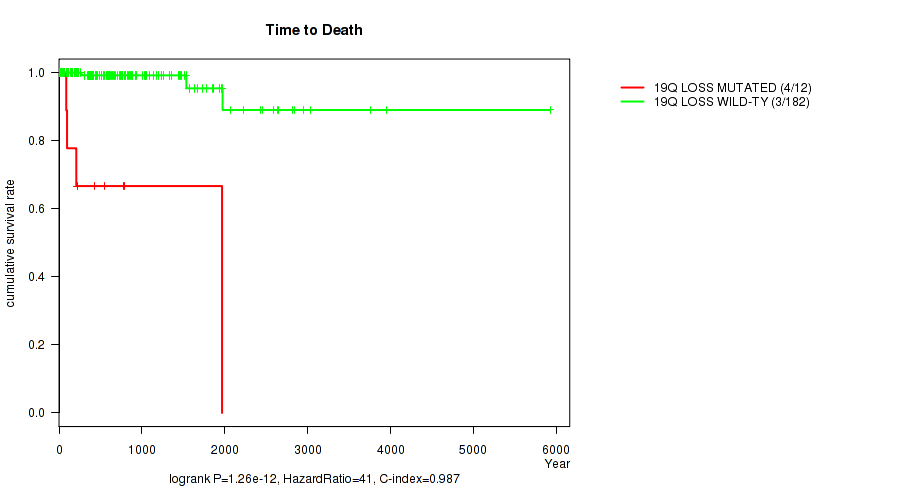
19q loss cnv correlated to 'Time to Death', 'NEOPLASM.DISEASESTAGE', and 'PATHOLOGY.T.STAGE'.
-
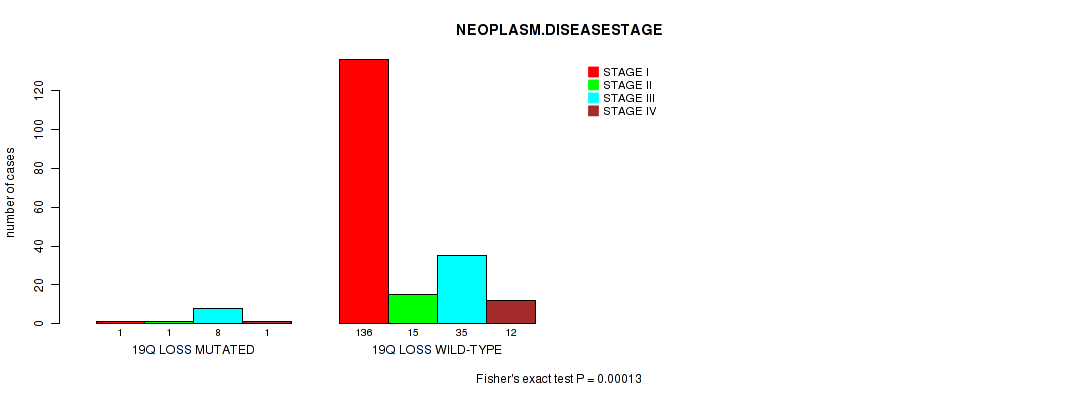
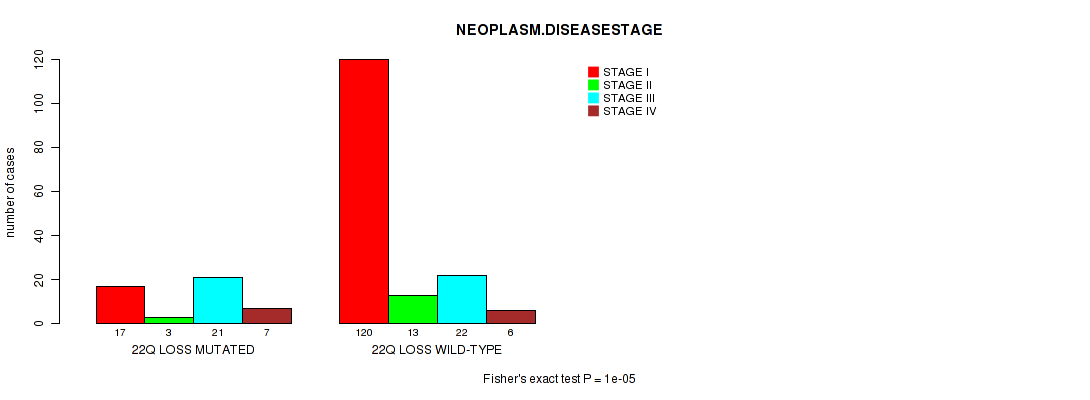
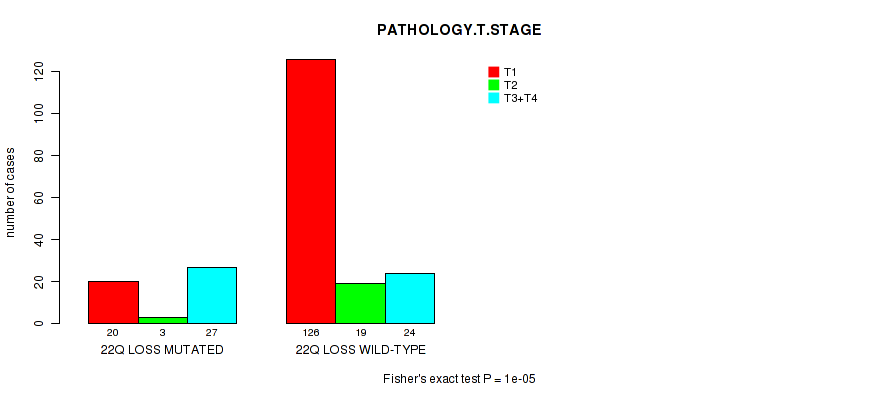
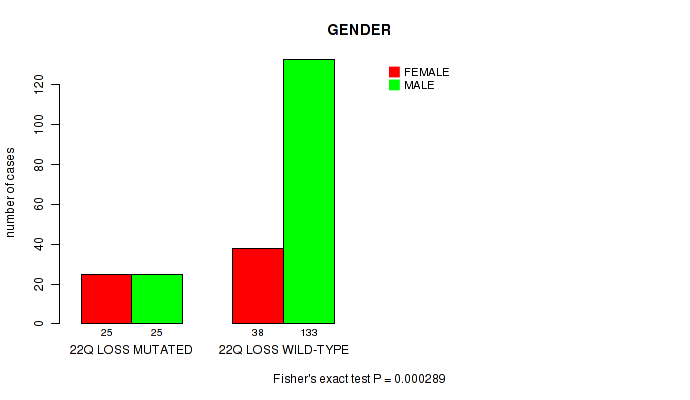
22q loss cnv correlated to 'NEOPLASM.DISEASESTAGE', 'PATHOLOGY.T.STAGE', and 'GENDER'.
-
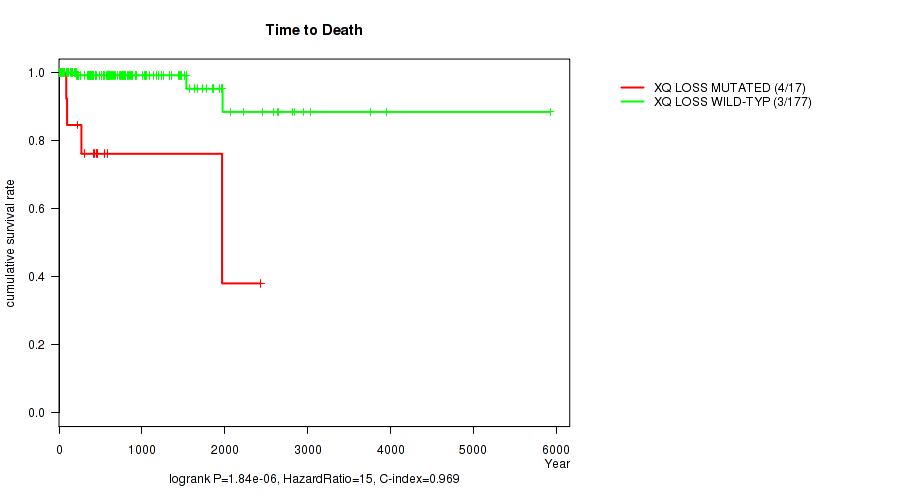
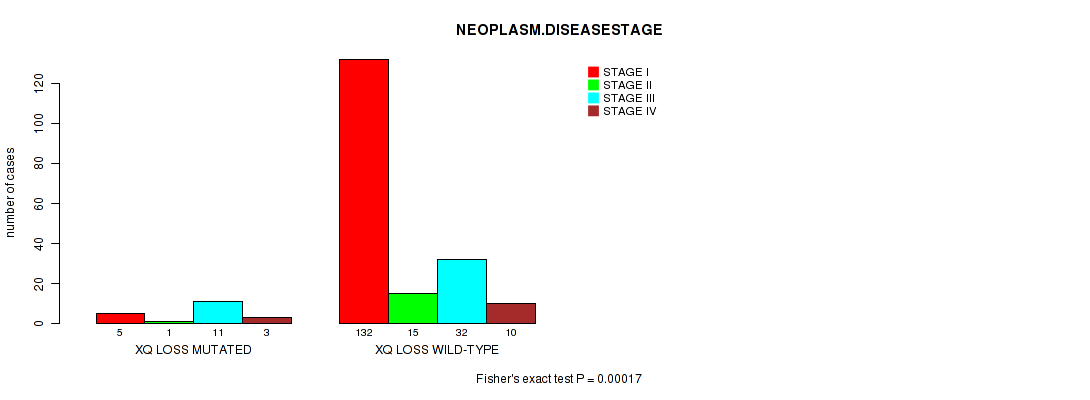
xq loss cnv correlated to 'Time to Death', 'NEOPLASM.DISEASESTAGE', and 'PATHOLOGY.T.STAGE'.
Table 1. Get Full Table Overview of the association between significant copy number variation of 70 arm-level events and 11 clinical features. Shown in the table are P values (Q values). Thresholded by Q value < 0.25, 41 significant findings detected.
|
Clinical Features |
Time to Death |
AGE |
NEOPLASM DISEASESTAGE |
PATHOLOGY T STAGE |
PATHOLOGY N STAGE |
PATHOLOGY M STAGE |
GENDER |
KARNOFSKY PERFORMANCE SCORE |
NUMBERPACKYEARSSMOKED | RACE | ETHNICITY | ||
| nCNV (%) | nWild-Type | logrank test | Wilcoxon-test | Fisher's exact test | Fisher's exact test | Fisher's exact test | Fisher's exact test | Fisher's exact test | Wilcoxon-test | Wilcoxon-test | Fisher's exact test | Fisher's exact test | |
| 13q loss | 21 (10%) | 200 |
0.000166 (0.112) |
0.011 (1.00) |
0.00031 (0.206) |
9e-05 (0.0607) |
0.00209 (1.00) |
0.524 (1.00) |
0.000149 (0.1) |
0.279 (1.00) |
0.205 (1.00) |
0.591 (1.00) |
|
| 1q gain | 15 (7%) | 206 |
4e-08 (2.81e-05) |
0.755 (1.00) |
3e-05 (0.0203) |
2e-05 (0.0137) |
0.112 (1.00) |
0.154 (1.00) |
0.137 (1.00) |
0.0483 (1.00) |
0.0901 (1.00) |
1 (1.00) |
|
| 4p loss | 20 (9%) | 201 |
0.0651 (1.00) |
0.00888 (1.00) |
1e-05 (0.00696) |
1e-05 (0.00696) |
0.00107 (0.7) |
0.843 (1.00) |
6.4e-05 (0.0433) |
0.181 (1.00) |
1 (1.00) |
0.101 (1.00) |
0.518 (1.00) |
| 18q loss | 36 (16%) | 185 |
1.06e-06 (0.00074) |
0.411 (1.00) |
1e-05 (0.00696) |
1e-05 (0.00696) |
0.0137 (1.00) |
0.0396 (1.00) |
0.0694 (1.00) |
0.288 (1.00) |
0.66 (1.00) |
0.093 (1.00) |
1 (1.00) |
| 19q loss | 12 (5%) | 209 |
1.26e-12 (8.86e-10) |
0.972 (1.00) |
0.00013 (0.0876) |
0.0002 (0.134) |
0.0584 (1.00) |
0.102 (1.00) |
0.105 (1.00) |
0.12 (1.00) |
0.496 (1.00) |
0.685 (1.00) |
1 (1.00) |
| 22q loss | 50 (23%) | 171 |
0.00165 (1.00) |
0.112 (1.00) |
1e-05 (0.00696) |
1e-05 (0.00696) |
0.0119 (1.00) |
0.0329 (1.00) |
0.000289 (0.193) |
0.297 (1.00) |
0.477 (1.00) |
0.201 (1.00) |
0.395 (1.00) |
| xq loss | 21 (10%) | 200 |
1.84e-06 (0.00128) |
0.135 (1.00) |
0.00017 (0.114) |
1e-05 (0.00696) |
0.0351 (1.00) |
0.254 (1.00) |
0.0717 (1.00) |
0.27 (1.00) |
0.496 (1.00) |
0.0132 (1.00) |
1 (1.00) |
| 4q loss | 21 (10%) | 200 |
0.133 (1.00) |
0.0578 (1.00) |
2e-05 (0.0137) |
5e-05 (0.0338) |
0.00577 (1.00) |
0.321 (1.00) |
0.0014 (0.911) |
0.12 (1.00) |
0.532 (1.00) |
0.149 (1.00) |
0.543 (1.00) |
| 9p loss | 26 (12%) | 195 |
0.0163 (1.00) |
0.511 (1.00) |
1e-05 (0.00696) |
1e-05 (0.00696) |
0.0181 (1.00) |
0.0744 (1.00) |
0.00455 (1.00) |
0.00717 (1.00) |
0.0234 (1.00) |
0.0422 (1.00) |
0.602 (1.00) |
| 9q loss | 27 (12%) | 194 |
0.00337 (1.00) |
0.454 (1.00) |
1e-05 (0.00696) |
2e-05 (0.0137) |
0.0179 (1.00) |
0.406 (1.00) |
0.00627 (1.00) |
0.0177 (1.00) |
0.213 (1.00) |
0.101 (1.00) |
0.601 (1.00) |
| 11q loss | 16 (7%) | 205 |
0.00351 (1.00) |
0.245 (1.00) |
1e-05 (0.00696) |
1e-05 (0.00696) |
0.0522 (1.00) |
0.0972 (1.00) |
0.401 (1.00) |
0.275 (1.00) |
0.882 (1.00) |
0.116 (1.00) |
1 (1.00) |
| 18p loss | 33 (15%) | 188 |
0.0019 (1.00) |
0.116 (1.00) |
2e-05 (0.0137) |
1e-05 (0.00696) |
0.0176 (1.00) |
0.0216 (1.00) |
0.0347 (1.00) |
0.4 (1.00) |
0.45 (1.00) |
0.428 (1.00) |
1 (1.00) |
| 1p gain | 8 (4%) | 213 |
1.5e-14 (1.06e-11) |
0.438 (1.00) |
0.00154 (0.999) |
0.00763 (1.00) |
0.00662 (1.00) |
0.0824 (1.00) |
0.044 (1.00) |
0.37 (1.00) |
1 (1.00) |
||
| 17p gain | 135 (61%) | 86 |
0.53 (1.00) |
0.00319 (1.00) |
0.0005 (0.33) |
0.00383 (1.00) |
0.771 (1.00) |
0.00021 (0.14) |
0.126 (1.00) |
0.715 (1.00) |
0.606 (1.00) |
0.411 (1.00) |
0.28 (1.00) |
| 3q loss | 5 (2%) | 216 |
3.26e-12 (2.29e-09) |
0.149 (1.00) |
0.0171 (1.00) |
0.0204 (1.00) |
0.0822 (1.00) |
0.172 (1.00) |
0.625 (1.00) |
1 (1.00) |
1 (1.00) |
||
| 5p loss | 8 (4%) | 213 |
1.06e-06 (0.00074) |
0.072 (1.00) |
0.0263 (1.00) |
0.00804 (1.00) |
0.0178 (1.00) |
0.21 (1.00) |
0.044 (1.00) |
0.748 (1.00) |
0.263 (1.00) |
||
| 5q loss | 8 (4%) | 213 |
2.47e-05 (0.0167) |
0.0166 (1.00) |
0.0472 (1.00) |
0.0079 (1.00) |
0.0338 (1.00) |
0.21 (1.00) |
0.044 (1.00) |
0.749 (1.00) |
0.263 (1.00) |
||
| 8p loss | 11 (5%) | 210 |
0.000328 (0.218) |
0.283 (1.00) |
0.0451 (1.00) |
0.497 (1.00) |
0.00405 (1.00) |
0.00795 (1.00) |
0.301 (1.00) |
0.484 (1.00) |
0.0357 (1.00) |
1 (1.00) |
|
| 11p loss | 14 (6%) | 207 |
3e-07 (0.00021) |
0.0838 (1.00) |
0.0109 (1.00) |
0.00389 (1.00) |
0.0586 (1.00) |
0.413 (1.00) |
0.548 (1.00) |
0.19 (1.00) |
0.678 (1.00) |
1 (1.00) |
1 (1.00) |
| 16q loss | 6 (3%) | 215 |
1.05e-07 (7.33e-05) |
0.202 (1.00) |
0.0179 (1.00) |
0.0469 (1.00) |
0.0843 (1.00) |
0.761 (1.00) |
0.356 (1.00) |
0.633 (1.00) |
1 (1.00) |
||
| 19p loss | 13 (6%) | 208 |
0.000199 (0.133) |
0.172 (1.00) |
0.00567 (1.00) |
0.00359 (1.00) |
0.0588 (1.00) |
0.189 (1.00) |
0.526 (1.00) |
0.12 (1.00) |
0.419 (1.00) |
1 (1.00) |
1 (1.00) |
| 2p gain | 38 (17%) | 183 |
0.791 (1.00) |
0.235 (1.00) |
0.0746 (1.00) |
0.551 (1.00) |
0.104 (1.00) |
0.00301 (1.00) |
0.694 (1.00) |
0.606 (1.00) |
0.364 (1.00) |
0.74 (1.00) |
0.673 (1.00) |
| 2q gain | 41 (19%) | 180 |
0.747 (1.00) |
0.421 (1.00) |
0.0213 (1.00) |
0.66 (1.00) |
0.0778 (1.00) |
0.00847 (1.00) |
0.702 (1.00) |
0.463 (1.00) |
0.364 (1.00) |
0.673 (1.00) |
1 (1.00) |
| 3p gain | 62 (28%) | 159 |
0.12 (1.00) |
0.923 (1.00) |
0.0223 (1.00) |
0.00809 (1.00) |
0.844 (1.00) |
0.213 (1.00) |
0.411 (1.00) |
0.0189 (1.00) |
0.247 (1.00) |
0.492 (1.00) |
1 (1.00) |
| 3q gain | 73 (33%) | 148 |
0.254 (1.00) |
0.621 (1.00) |
0.184 (1.00) |
0.0615 (1.00) |
0.886 (1.00) |
0.136 (1.00) |
0.269 (1.00) |
0.161 (1.00) |
0.518 (1.00) |
0.193 (1.00) |
0.72 (1.00) |
| 4p gain | 9 (4%) | 212 |
0.0425 (1.00) |
0.0366 (1.00) |
0.0637 (1.00) |
0.398 (1.00) |
0.32 (1.00) |
0.247 (1.00) |
1 (1.00) |
0.324 (1.00) |
0.601 (1.00) |
1 (1.00) |
|
| 4q gain | 8 (4%) | 213 |
0.0425 (1.00) |
0.0974 (1.00) |
0.242 (1.00) |
0.35 (1.00) |
0.131 (1.00) |
0.596 (1.00) |
1 (1.00) |
0.762 (1.00) |
1 (1.00) |
||
| 5p gain | 29 (13%) | 192 |
0.979 (1.00) |
0.508 (1.00) |
0.261 (1.00) |
0.176 (1.00) |
0.468 (1.00) |
0.372 (1.00) |
0.664 (1.00) |
0.154 (1.00) |
0.868 (1.00) |
0.484 (1.00) |
0.605 (1.00) |
| 5q gain | 29 (13%) | 192 |
0.979 (1.00) |
0.865 (1.00) |
0.26 (1.00) |
0.267 (1.00) |
0.88 (1.00) |
0.373 (1.00) |
0.664 (1.00) |
0.154 (1.00) |
0.868 (1.00) |
0.644 (1.00) |
0.608 (1.00) |
| 6p gain | 8 (4%) | 213 |
0.595 (1.00) |
0.405 (1.00) |
0.00164 (1.00) |
0.00063 (0.415) |
0.217 (1.00) |
0.0351 (1.00) |
0.691 (1.00) |
1 (1.00) |
1 (1.00) |
1 (1.00) |
|
| 6q gain | 6 (3%) | 215 |
0.815 (1.00) |
0.127 (1.00) |
0.0103 (1.00) |
0.00648 (1.00) |
0.0559 (1.00) |
0.0198 (1.00) |
0.356 (1.00) |
1 (1.00) |
0.718 (1.00) |
1 (1.00) |
|
| 7p gain | 130 (59%) | 91 |
0.435 (1.00) |
0.077 (1.00) |
0.00141 (0.916) |
0.0307 (1.00) |
0.704 (1.00) |
0.681 (1.00) |
0.0353 (1.00) |
0.0595 (1.00) |
0.678 (1.00) |
0.824 (1.00) |
0.487 (1.00) |
| 7q gain | 131 (59%) | 90 |
0.422 (1.00) |
0.056 (1.00) |
0.00087 (0.572) |
0.025 (1.00) |
0.711 (1.00) |
0.795 (1.00) |
0.0335 (1.00) |
0.0595 (1.00) |
0.678 (1.00) |
0.794 (1.00) |
0.316 (1.00) |
| 8p gain | 14 (6%) | 207 |
0.118 (1.00) |
0.898 (1.00) |
0.17 (1.00) |
0.106 (1.00) |
0.24 (1.00) |
1 (1.00) |
0.231 (1.00) |
0.107 (1.00) |
0.0911 (1.00) |
1 (1.00) |
|
| 8q gain | 18 (8%) | 203 |
0.118 (1.00) |
0.474 (1.00) |
0.00092 (0.604) |
0.00043 (0.285) |
0.00345 (1.00) |
0.202 (1.00) |
0.0533 (1.00) |
0.434 (1.00) |
0.882 (1.00) |
0.089 (1.00) |
1 (1.00) |
| 9p gain | 3 (1%) | 218 |
0.491 (1.00) |
0.046 (1.00) |
0.0354 (1.00) |
0.631 (1.00) |
1 (1.00) |
0.611 (1.00) |
1 (1.00) |
||||
| 10p gain | 8 (4%) | 213 |
0.745 (1.00) |
0.342 (1.00) |
0.262 (1.00) |
0.421 (1.00) |
1 (1.00) |
0.0317 (1.00) |
0.691 (1.00) |
0.00629 (1.00) |
1 (1.00) |
||
| 10q gain | 8 (4%) | 213 |
0.745 (1.00) |
0.342 (1.00) |
0.265 (1.00) |
0.423 (1.00) |
1 (1.00) |
0.033 (1.00) |
0.691 (1.00) |
0.00589 (1.00) |
1 (1.00) |
||
| 11p gain | 10 (5%) | 211 |
0.527 (1.00) |
0.105 (1.00) |
0.114 (1.00) |
0.153 (1.00) |
0.517 (1.00) |
0.0358 (1.00) |
0.153 (1.00) |
0.241 (1.00) |
1 (1.00) |
||
| 11q gain | 10 (5%) | 211 |
0.513 (1.00) |
0.0896 (1.00) |
0.181 (1.00) |
0.148 (1.00) |
0.693 (1.00) |
0.22 (1.00) |
0.0338 (1.00) |
0.747 (1.00) |
1 (1.00) |
0.39 (1.00) |
1 (1.00) |
| 12p gain | 91 (41%) | 130 |
0.0678 (1.00) |
0.561 (1.00) |
0.14 (1.00) |
0.909 (1.00) |
0.575 (1.00) |
0.214 (1.00) |
0.00974 (1.00) |
0.415 (1.00) |
0.973 (1.00) |
0.868 (1.00) |
0.0802 (1.00) |
| 12q gain | 91 (41%) | 130 |
0.0678 (1.00) |
0.561 (1.00) |
0.139 (1.00) |
0.91 (1.00) |
0.575 (1.00) |
0.217 (1.00) |
0.00974 (1.00) |
0.415 (1.00) |
0.973 (1.00) |
0.868 (1.00) |
0.0802 (1.00) |
| 13q gain | 23 (10%) | 198 |
0.804 (1.00) |
0.408 (1.00) |
0.404 (1.00) |
0.543 (1.00) |
1 (1.00) |
0.928 (1.00) |
0.811 (1.00) |
0.38 (1.00) |
0.755 (1.00) |
0.254 (1.00) |
|
| 14q gain | 3 (1%) | 218 |
0.036 (1.00) |
0.0201 (1.00) |
0.629 (1.00) |
0.196 (1.00) |
1 (1.00) |
||||||
| 15q gain | 5 (2%) | 216 |
0.6 (1.00) |
1 (1.00) |
0.279 (1.00) |
0.238 (1.00) |
0.498 (1.00) |
0.141 (1.00) |
0.67 (1.00) |
1 (1.00) |
|||
| 16p gain | 117 (53%) | 104 |
0.2 (1.00) |
0.175 (1.00) |
0.933 (1.00) |
0.704 (1.00) |
1 (1.00) |
0.619 (1.00) |
0.00702 (1.00) |
0.681 (1.00) |
0.651 (1.00) |
0.0138 (1.00) |
0.0848 (1.00) |
| 16q gain | 113 (51%) | 108 |
0.0463 (1.00) |
0.347 (1.00) |
0.758 (1.00) |
0.372 (1.00) |
0.65 (1.00) |
0.209 (1.00) |
0.0372 (1.00) |
0.246 (1.00) |
0.96 (1.00) |
0.0725 (1.00) |
0.0917 (1.00) |
| 17q gain | 149 (67%) | 72 |
0.245 (1.00) |
0.0128 (1.00) |
0.0576 (1.00) |
0.189 (1.00) |
0.453 (1.00) |
0.00545 (1.00) |
0.432 (1.00) |
0.853 (1.00) |
0.71 (1.00) |
0.411 (1.00) |
0.452 (1.00) |
| 18p gain | 11 (5%) | 210 |
0.188 (1.00) |
0.783 (1.00) |
0.179 (1.00) |
0.563 (1.00) |
0.392 (1.00) |
0.319 (1.00) |
0.186 (1.00) |
0.66 (1.00) |
0.79 (1.00) |
0.204 (1.00) |
1 (1.00) |
| 18q gain | 8 (4%) | 213 |
0.623 (1.00) |
0.624 (1.00) |
0.509 (1.00) |
0.348 (1.00) |
0.777 (1.00) |
0.445 (1.00) |
0.176 (1.00) |
0.332 (1.00) |
1 (1.00) |
||
| 19p gain | 4 (2%) | 217 |
0.768 (1.00) |
0.245 (1.00) |
0.584 (1.00) |
0.529 (1.00) |
1 (1.00) |
1 (1.00) |
1 (1.00) |
0.631 (1.00) |
1 (1.00) |
||
| 19q gain | 4 (2%) | 217 |
0.768 (1.00) |
0.245 (1.00) |
0.583 (1.00) |
0.526 (1.00) |
1 (1.00) |
1 (1.00) |
1 (1.00) |
0.63 (1.00) |
1 (1.00) |
||
| 20p gain | 74 (33%) | 147 |
0.827 (1.00) |
0.105 (1.00) |
0.699 (1.00) |
0.323 (1.00) |
0.897 (1.00) |
0.935 (1.00) |
0.636 (1.00) |
0.495 (1.00) |
0.752 (1.00) |
0.592 (1.00) |
0.72 (1.00) |
| 20q gain | 76 (34%) | 145 |
0.847 (1.00) |
0.096 (1.00) |
0.561 (1.00) |
0.247 (1.00) |
0.805 (1.00) |
0.87 (1.00) |
0.531 (1.00) |
0.495 (1.00) |
0.752 (1.00) |
0.551 (1.00) |
0.721 (1.00) |
| 21q gain | 15 (7%) | 206 |
0.623 (1.00) |
0.0566 (1.00) |
0.956 (1.00) |
0.838 (1.00) |
0.693 (1.00) |
0.171 (1.00) |
0.768 (1.00) |
0.751 (1.00) |
0.115 (1.00) |
0.518 (1.00) |
|
| 22q gain | 3 (1%) | 218 |
0.322 (1.00) |
0.272 (1.00) |
0.392 (1.00) |
1 (1.00) |
0.56 (1.00) |
0.612 (1.00) |
0.14 (1.00) |
||||
| xq gain | 70 (32%) | 151 |
0.338 (1.00) |
0.98 (1.00) |
0.0186 (1.00) |
0.0391 (1.00) |
0.673 (1.00) |
0.963 (1.00) |
0.0775 (1.00) |
0.0219 (1.00) |
0.861 (1.00) |
0.23 (1.00) |
0.721 (1.00) |
| 1p loss | 21 (10%) | 200 |
0.87 (1.00) |
0.532 (1.00) |
0.186 (1.00) |
0.199 (1.00) |
0.695 (1.00) |
0.509 (1.00) |
0.316 (1.00) |
0.861 (1.00) |
0.366 (1.00) |
0.543 (1.00) |
|
| 1q loss | 16 (7%) | 205 |
0.484 (1.00) |
0.474 (1.00) |
0.555 (1.00) |
0.777 (1.00) |
0.693 (1.00) |
0.534 (1.00) |
0.163 (1.00) |
0.861 (1.00) |
0.459 (1.00) |
0.543 (1.00) |
|
| 3p loss | 17 (8%) | 204 |
0.000506 (0.334) |
0.137 (1.00) |
0.0004 (0.266) |
0.00117 (0.764) |
0.491 (1.00) |
0.0827 (1.00) |
1 (1.00) |
0.181 (1.00) |
0.982 (1.00) |
0.454 (1.00) |
1 (1.00) |
| 6p loss | 16 (7%) | 205 |
0.123 (1.00) |
0.275 (1.00) |
0.0234 (1.00) |
0.0459 (1.00) |
0.0479 (1.00) |
0.777 (1.00) |
0.163 (1.00) |
0.934 (1.00) |
0.0459 (1.00) |
1 (1.00) |
|
| 6q loss | 19 (9%) | 202 |
0.625 (1.00) |
0.945 (1.00) |
0.0312 (1.00) |
0.00133 (0.867) |
0.064 (1.00) |
0.307 (1.00) |
0.0298 (1.00) |
0.279 (1.00) |
0.677 (1.00) |
0.0319 (1.00) |
1 (1.00) |
| 8q loss | 6 (3%) | 215 |
0.000462 (0.306) |
0.95 (1.00) |
0.243 (1.00) |
0.655 (1.00) |
0.285 (1.00) |
0.356 (1.00) |
0.224 (1.00) |
1 (1.00) |
|||
| 10p loss | 13 (6%) | 208 |
0.00697 (1.00) |
0.925 (1.00) |
0.00199 (1.00) |
0.00382 (1.00) |
0.0352 (1.00) |
0.0372 (1.00) |
0.202 (1.00) |
0.139 (1.00) |
0.84 (1.00) |
1 (1.00) |
|
| 10q loss | 13 (6%) | 208 |
0.00451 (1.00) |
0.349 (1.00) |
0.00078 (0.513) |
0.00104 (0.681) |
0.0133 (1.00) |
0.13 (1.00) |
0.202 (1.00) |
0.0415 (1.00) |
0.493 (1.00) |
1 (1.00) |
|
| 14q loss | 39 (18%) | 182 |
0.00653 (1.00) |
0.835 (1.00) |
0.0055 (1.00) |
0.00447 (1.00) |
0.0221 (1.00) |
0.153 (1.00) |
0.0106 (1.00) |
0.0445 (1.00) |
0.0822 (1.00) |
1 (1.00) |
1 (1.00) |
| 15q loss | 24 (11%) | 197 |
0.00205 (1.00) |
0.0781 (1.00) |
0.00326 (1.00) |
0.00187 (1.00) |
0.0354 (1.00) |
0.326 (1.00) |
0.34 (1.00) |
0.125 (1.00) |
0.443 (1.00) |
1 (1.00) |
|
| 16p loss | 4 (2%) | 217 |
0.748 (1.00) |
0.0943 (1.00) |
0.0902 (1.00) |
1 (1.00) |
0.071 (1.00) |
1 (1.00) |
|||||
| 17p loss | 7 (3%) | 214 |
0.72 (1.00) |
0.84 (1.00) |
0.00172 (1.00) |
0.00774 (1.00) |
0.0336 (1.00) |
0.0344 (1.00) |
0.104 (1.00) |
0.324 (1.00) |
1 (1.00) |
1 (1.00) |
|
| 21q loss | 33 (15%) | 188 |
0.302 (1.00) |
0.417 (1.00) |
0.0117 (1.00) |
0.00446 (1.00) |
0.651 (1.00) |
0.175 (1.00) |
0.0347 (1.00) |
0.0791 (1.00) |
0.735 (1.00) |
0.573 (1.00) |
1 (1.00) |
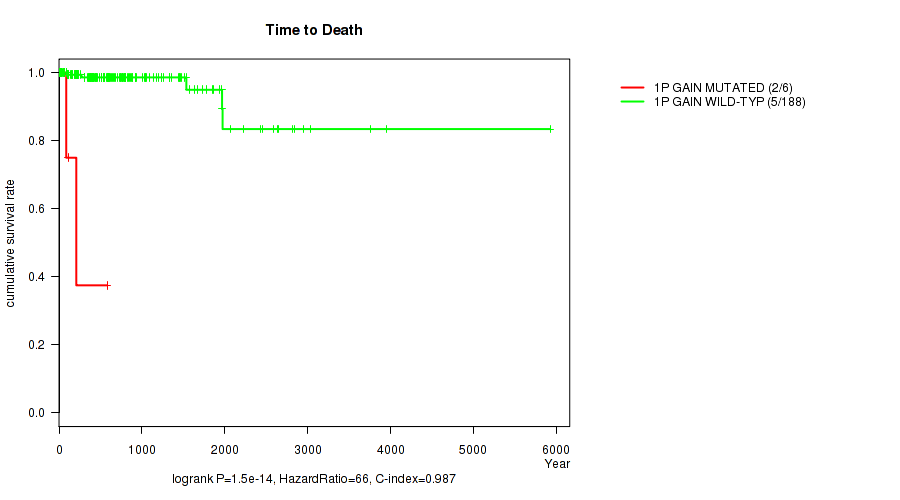
P value = 1.5e-14 (logrank test), Q value = 1.1e-11
Table S1. Gene #1: '1p gain' versus Clinical Feature #1: 'Time to Death'
| nPatients | nDeath | Duration Range (Median), Year | |
|---|---|---|---|
| ALL | 194 | 7 | 2.0 - 5925.0 (540.5) |
| 1P GAIN MUTATED | 6 | 2 | 26.0 - 579.0 (99.5) |
| 1P GAIN WILD-TYPE | 188 | 5 | 2.0 - 5925.0 (550.0) |
Figure S1. Get High-res Image Gene #1: '1p gain' versus Clinical Feature #1: 'Time to Death'
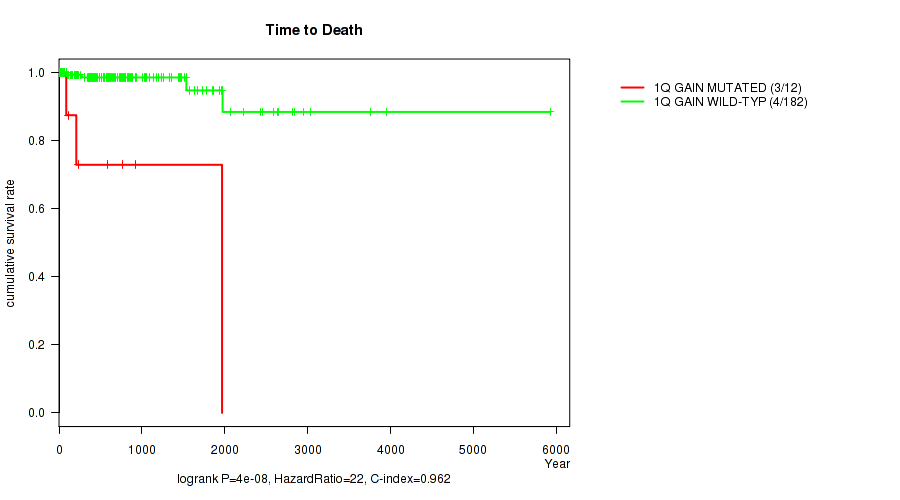
P value = 4e-08 (logrank test), Q value = 2.8e-05
Table S2. Gene #2: '1q gain' versus Clinical Feature #1: 'Time to Death'
| nPatients | nDeath | Duration Range (Median), Year | |
|---|---|---|---|
| ALL | 194 | 7 | 2.0 - 5925.0 (540.5) |
| 1Q GAIN MUTATED | 12 | 3 | 21.0 - 1967.0 (160.0) |
| 1Q GAIN WILD-TYPE | 182 | 4 | 2.0 - 5925.0 (550.0) |
Figure S2. Get High-res Image Gene #2: '1q gain' versus Clinical Feature #1: 'Time to Death'
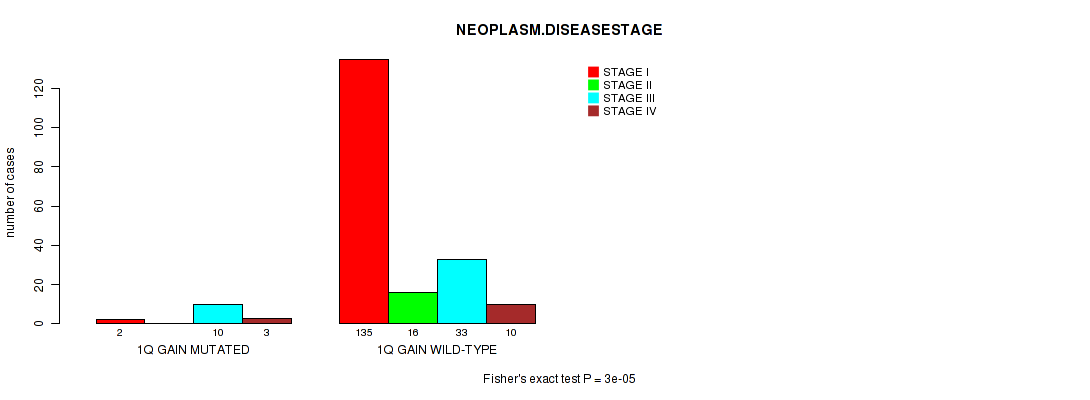
P value = 3e-05 (Fisher's exact test), Q value = 0.02
Table S3. Gene #2: '1q gain' versus Clinical Feature #3: 'NEOPLASM.DISEASESTAGE'
| nPatients | STAGE I | STAGE II | STAGE III | STAGE IV |
|---|---|---|---|---|
| ALL | 137 | 16 | 43 | 13 |
| 1Q GAIN MUTATED | 2 | 0 | 10 | 3 |
| 1Q GAIN WILD-TYPE | 135 | 16 | 33 | 10 |
Figure S3. Get High-res Image Gene #2: '1q gain' versus Clinical Feature #3: 'NEOPLASM.DISEASESTAGE'
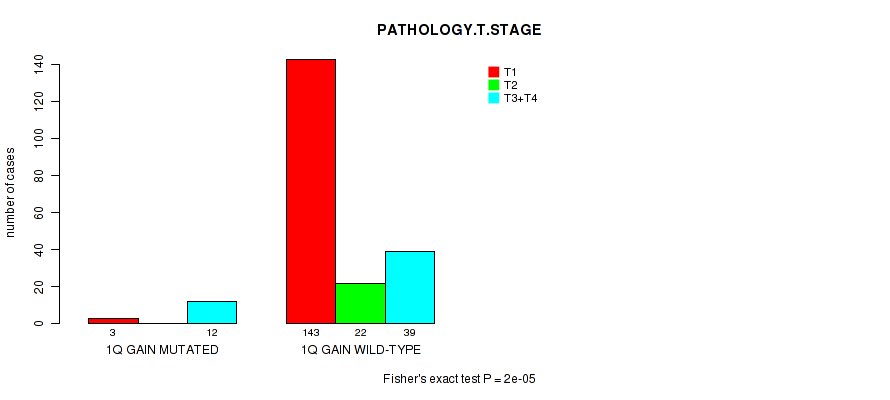
P value = 2e-05 (Fisher's exact test), Q value = 0.014
Table S4. Gene #2: '1q gain' versus Clinical Feature #4: 'PATHOLOGY.T.STAGE'
| nPatients | T1 | T2 | T3+T4 |
|---|---|---|---|
| ALL | 146 | 22 | 51 |
| 1Q GAIN MUTATED | 3 | 0 | 12 |
| 1Q GAIN WILD-TYPE | 143 | 22 | 39 |
Figure S4. Get High-res Image Gene #2: '1q gain' versus Clinical Feature #4: 'PATHOLOGY.T.STAGE'
P value = 0.00021 (Fisher's exact test), Q value = 0.14
Table S5. Gene #29: '17p gain' versus Clinical Feature #6: 'PATHOLOGY.M.STAGE'
| nPatients | M0 | M1 | MX |
|---|---|---|---|
| ALL | 88 | 8 | 112 |
| 17P GAIN MUTATED | 42 | 2 | 81 |
| 17P GAIN WILD-TYPE | 46 | 6 | 31 |
Figure S5. Get High-res Image Gene #29: '17p gain' versus Clinical Feature #6: 'PATHOLOGY.M.STAGE'
P value = 3.26e-12 (logrank test), Q value = 2.3e-09
Table S6. Gene #43: '3q loss' versus Clinical Feature #1: 'Time to Death'
| nPatients | nDeath | Duration Range (Median), Year | |
|---|---|---|---|
| ALL | 194 | 7 | 2.0 - 5925.0 (540.5) |
| 3Q LOSS MUTATED | 4 | 2 | 112.0 - 270.0 (235.0) |
| 3Q LOSS WILD-TYPE | 190 | 5 | 2.0 - 5925.0 (550.0) |
Figure S6. Get High-res Image Gene #43: '3q loss' versus Clinical Feature #1: 'Time to Death'
P value = 1e-05 (Fisher's exact test), Q value = 0.007
Table S7. Gene #44: '4p loss' versus Clinical Feature #3: 'NEOPLASM.DISEASESTAGE'
| nPatients | STAGE I | STAGE II | STAGE III | STAGE IV |
|---|---|---|---|---|
| ALL | 137 | 16 | 43 | 13 |
| 4P LOSS MUTATED | 3 | 1 | 14 | 1 |
| 4P LOSS WILD-TYPE | 134 | 15 | 29 | 12 |
Figure S7. Get High-res Image Gene #44: '4p loss' versus Clinical Feature #3: 'NEOPLASM.DISEASESTAGE'
P value = 1e-05 (Fisher's exact test), Q value = 0.007
Table S8. Gene #44: '4p loss' versus Clinical Feature #4: 'PATHOLOGY.T.STAGE'
| nPatients | T1 | T2 | T3+T4 |
|---|---|---|---|
| ALL | 146 | 22 | 51 |
| 4P LOSS MUTATED | 4 | 2 | 14 |
| 4P LOSS WILD-TYPE | 142 | 20 | 37 |
Figure S8. Get High-res Image Gene #44: '4p loss' versus Clinical Feature #4: 'PATHOLOGY.T.STAGE'

P value = 6.4e-05 (Fisher's exact test), Q value = 0.043
Table S9. Gene #44: '4p loss' versus Clinical Feature #7: 'GENDER'
| nPatients | FEMALE | MALE |
|---|---|---|
| ALL | 63 | 158 |
| 4P LOSS MUTATED | 14 | 6 |
| 4P LOSS WILD-TYPE | 49 | 152 |
Figure S9. Get High-res Image Gene #44: '4p loss' versus Clinical Feature #7: 'GENDER'
P value = 2e-05 (Fisher's exact test), Q value = 0.014
Table S10. Gene #45: '4q loss' versus Clinical Feature #3: 'NEOPLASM.DISEASESTAGE'
| nPatients | STAGE I | STAGE II | STAGE III | STAGE IV |
|---|---|---|---|---|
| ALL | 137 | 16 | 43 | 13 |
| 4Q LOSS MUTATED | 4 | 1 | 13 | 2 |
| 4Q LOSS WILD-TYPE | 133 | 15 | 30 | 11 |
Figure S10. Get High-res Image Gene #45: '4q loss' versus Clinical Feature #3: 'NEOPLASM.DISEASESTAGE'

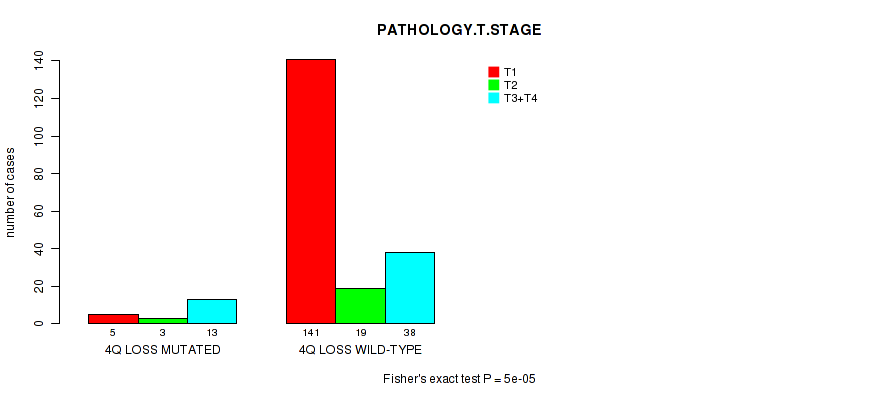
P value = 5e-05 (Fisher's exact test), Q value = 0.034
Table S11. Gene #45: '4q loss' versus Clinical Feature #4: 'PATHOLOGY.T.STAGE'
| nPatients | T1 | T2 | T3+T4 |
|---|---|---|---|
| ALL | 146 | 22 | 51 |
| 4Q LOSS MUTATED | 5 | 3 | 13 |
| 4Q LOSS WILD-TYPE | 141 | 19 | 38 |
Figure S11. Get High-res Image Gene #45: '4q loss' versus Clinical Feature #4: 'PATHOLOGY.T.STAGE'
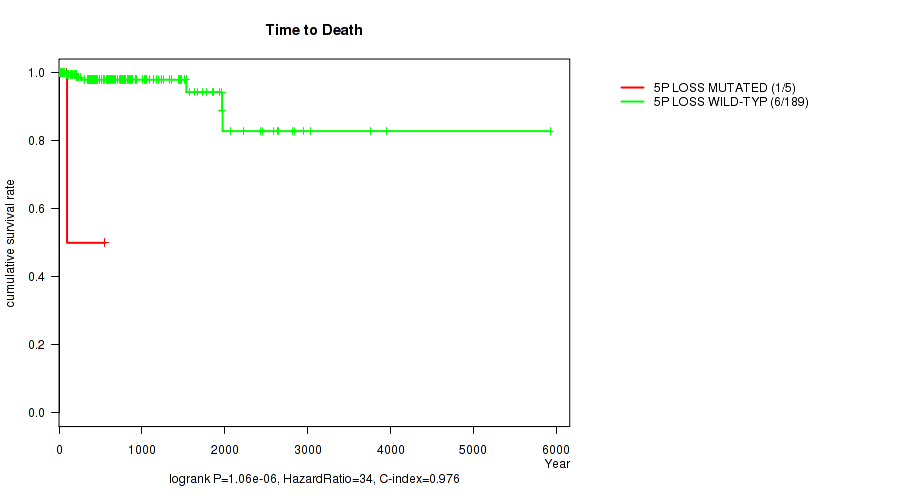
P value = 1.06e-06 (logrank test), Q value = 0.00074
Table S12. Gene #46: '5p loss' versus Clinical Feature #1: 'Time to Death'
| nPatients | nDeath | Duration Range (Median), Year | |
|---|---|---|---|
| ALL | 194 | 7 | 2.0 - 5925.0 (540.5) |
| 5P LOSS MUTATED | 5 | 1 | 2.0 - 554.0 (84.0) |
| 5P LOSS WILD-TYPE | 189 | 6 | 2.0 - 5925.0 (546.0) |
Figure S12. Get High-res Image Gene #46: '5p loss' versus Clinical Feature #1: 'Time to Death'
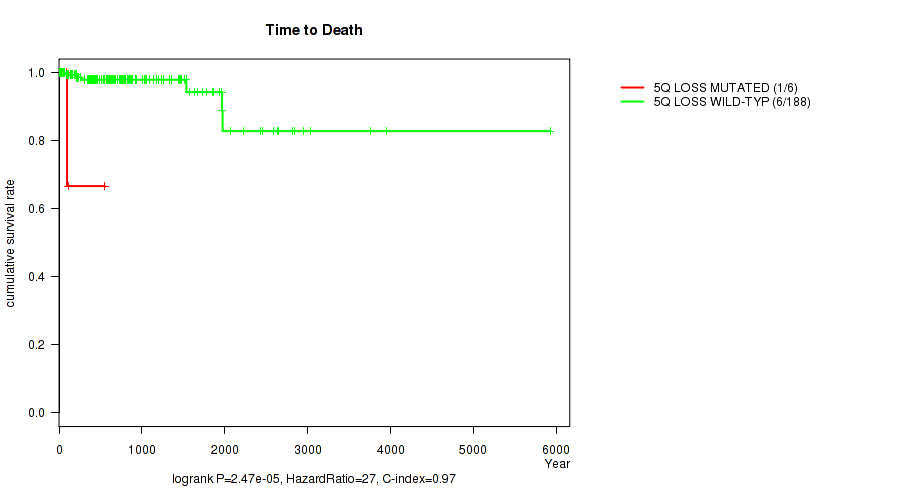
P value = 2.47e-05 (logrank test), Q value = 0.017
Table S13. Gene #47: '5q loss' versus Clinical Feature #1: 'Time to Death'
| nPatients | nDeath | Duration Range (Median), Year | |
|---|---|---|---|
| ALL | 194 | 7 | 2.0 - 5925.0 (540.5) |
| 5Q LOSS MUTATED | 6 | 1 | 2.0 - 554.0 (90.5) |
| 5Q LOSS WILD-TYPE | 188 | 6 | 2.0 - 5925.0 (562.0) |
Figure S13. Get High-res Image Gene #47: '5q loss' versus Clinical Feature #1: 'Time to Death'
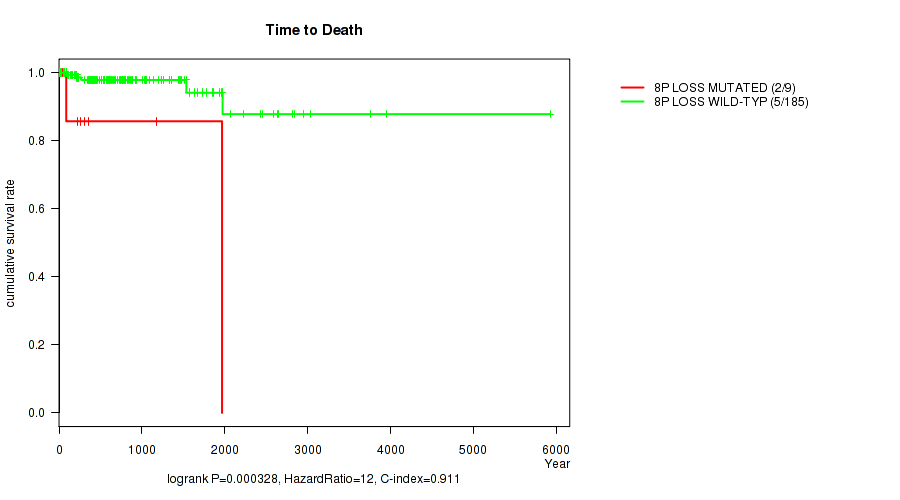
P value = 0.000328 (logrank test), Q value = 0.22
Table S14. Gene #50: '8p loss' versus Clinical Feature #1: 'Time to Death'
| nPatients | nDeath | Duration Range (Median), Year | |
|---|---|---|---|
| ALL | 194 | 7 | 2.0 - 5925.0 (540.5) |
| 8P LOSS MUTATED | 9 | 2 | 10.0 - 1967.0 (262.0) |
| 8P LOSS WILD-TYPE | 185 | 5 | 2.0 - 5925.0 (554.0) |
Figure S14. Get High-res Image Gene #50: '8p loss' versus Clinical Feature #1: 'Time to Death'
P value = 1e-05 (Fisher's exact test), Q value = 0.007
Table S15. Gene #52: '9p loss' versus Clinical Feature #3: 'NEOPLASM.DISEASESTAGE'
| nPatients | STAGE I | STAGE II | STAGE III | STAGE IV |
|---|---|---|---|---|
| ALL | 137 | 16 | 43 | 13 |
| 9P LOSS MUTATED | 6 | 0 | 13 | 5 |
| 9P LOSS WILD-TYPE | 131 | 16 | 30 | 8 |
Figure S15. Get High-res Image Gene #52: '9p loss' versus Clinical Feature #3: 'NEOPLASM.DISEASESTAGE'
P value = 1e-05 (Fisher's exact test), Q value = 0.007
Table S16. Gene #52: '9p loss' versus Clinical Feature #4: 'PATHOLOGY.T.STAGE'
| nPatients | T1 | T2 | T3+T4 |
|---|---|---|---|
| ALL | 146 | 22 | 51 |
| 9P LOSS MUTATED | 7 | 2 | 17 |
| 9P LOSS WILD-TYPE | 139 | 20 | 34 |
Figure S16. Get High-res Image Gene #52: '9p loss' versus Clinical Feature #4: 'PATHOLOGY.T.STAGE'
P value = 1e-05 (Fisher's exact test), Q value = 0.007
Table S17. Gene #53: '9q loss' versus Clinical Feature #3: 'NEOPLASM.DISEASESTAGE'
| nPatients | STAGE I | STAGE II | STAGE III | STAGE IV |
|---|---|---|---|---|
| ALL | 137 | 16 | 43 | 13 |
| 9Q LOSS MUTATED | 7 | 1 | 14 | 4 |
| 9Q LOSS WILD-TYPE | 130 | 15 | 29 | 9 |
Figure S17. Get High-res Image Gene #53: '9q loss' versus Clinical Feature #3: 'NEOPLASM.DISEASESTAGE'

P value = 2e-05 (Fisher's exact test), Q value = 0.014
Table S18. Gene #53: '9q loss' versus Clinical Feature #4: 'PATHOLOGY.T.STAGE'
| nPatients | T1 | T2 | T3+T4 |
|---|---|---|---|
| ALL | 146 | 22 | 51 |
| 9Q LOSS MUTATED | 8 | 1 | 18 |
| 9Q LOSS WILD-TYPE | 138 | 21 | 33 |
Figure S18. Get High-res Image Gene #53: '9q loss' versus Clinical Feature #4: 'PATHOLOGY.T.STAGE'

P value = 3e-07 (logrank test), Q value = 0.00021
Table S19. Gene #56: '11p loss' versus Clinical Feature #1: 'Time to Death'
| nPatients | nDeath | Duration Range (Median), Year | |
|---|---|---|---|
| ALL | 194 | 7 | 2.0 - 5925.0 (540.5) |
| 11P LOSS MUTATED | 12 | 3 | 21.0 - 1967.0 (215.5) |
| 11P LOSS WILD-TYPE | 182 | 4 | 2.0 - 5925.0 (550.0) |
Figure S19. Get High-res Image Gene #56: '11p loss' versus Clinical Feature #1: 'Time to Death'

P value = 1e-05 (Fisher's exact test), Q value = 0.007
Table S20. Gene #57: '11q loss' versus Clinical Feature #3: 'NEOPLASM.DISEASESTAGE'
| nPatients | STAGE I | STAGE II | STAGE III | STAGE IV |
|---|---|---|---|---|
| ALL | 137 | 16 | 43 | 13 |
| 11Q LOSS MUTATED | 2 | 1 | 9 | 4 |
| 11Q LOSS WILD-TYPE | 135 | 15 | 34 | 9 |
Figure S20. Get High-res Image Gene #57: '11q loss' versus Clinical Feature #3: 'NEOPLASM.DISEASESTAGE'

P value = 1e-05 (Fisher's exact test), Q value = 0.007
Table S21. Gene #57: '11q loss' versus Clinical Feature #4: 'PATHOLOGY.T.STAGE'
| nPatients | T1 | T2 | T3+T4 |
|---|---|---|---|
| ALL | 146 | 22 | 51 |
| 11Q LOSS MUTATED | 2 | 1 | 13 |
| 11Q LOSS WILD-TYPE | 144 | 21 | 38 |
Figure S21. Get High-res Image Gene #57: '11q loss' versus Clinical Feature #4: 'PATHOLOGY.T.STAGE'
P value = 0.000166 (logrank test), Q value = 0.11
Table S22. Gene #58: '13q loss' versus Clinical Feature #1: 'Time to Death'
| nPatients | nDeath | Duration Range (Median), Year | |
|---|---|---|---|
| ALL | 194 | 7 | 2.0 - 5925.0 (540.5) |
| 13Q LOSS MUTATED | 17 | 3 | 4.0 - 2639.0 (112.0) |
| 13Q LOSS WILD-TYPE | 177 | 4 | 2.0 - 5925.0 (579.0) |
Figure S22. Get High-res Image Gene #58: '13q loss' versus Clinical Feature #1: 'Time to Death'

P value = 0.00031 (Fisher's exact test), Q value = 0.21
Table S23. Gene #58: '13q loss' versus Clinical Feature #3: 'NEOPLASM.DISEASESTAGE'
| nPatients | STAGE I | STAGE II | STAGE III | STAGE IV |
|---|---|---|---|---|
| ALL | 137 | 16 | 43 | 13 |
| 13Q LOSS MUTATED | 6 | 1 | 11 | 3 |
| 13Q LOSS WILD-TYPE | 131 | 15 | 32 | 10 |
Figure S23. Get High-res Image Gene #58: '13q loss' versus Clinical Feature #3: 'NEOPLASM.DISEASESTAGE'

P value = 9e-05 (Fisher's exact test), Q value = 0.061
Table S24. Gene #58: '13q loss' versus Clinical Feature #4: 'PATHOLOGY.T.STAGE'
| nPatients | T1 | T2 | T3+T4 |
|---|---|---|---|
| ALL | 146 | 22 | 51 |
| 13Q LOSS MUTATED | 6 | 2 | 13 |
| 13Q LOSS WILD-TYPE | 140 | 20 | 38 |
Figure S24. Get High-res Image Gene #58: '13q loss' versus Clinical Feature #4: 'PATHOLOGY.T.STAGE'
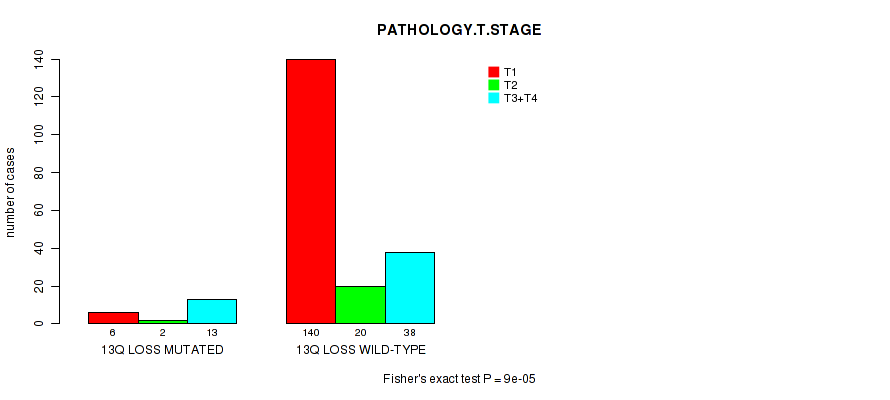
P value = 0.000149 (Fisher's exact test), Q value = 0.1
Table S25. Gene #58: '13q loss' versus Clinical Feature #7: 'GENDER'
| nPatients | FEMALE | MALE |
|---|---|---|
| ALL | 63 | 158 |
| 13Q LOSS MUTATED | 14 | 7 |
| 13Q LOSS WILD-TYPE | 49 | 151 |
Figure S25. Get High-res Image Gene #58: '13q loss' versus Clinical Feature #7: 'GENDER'
P value = 1.05e-07 (logrank test), Q value = 7.3e-05
Table S26. Gene #62: '16q loss' versus Clinical Feature #1: 'Time to Death'
| nPatients | nDeath | Duration Range (Median), Year | |
|---|---|---|---|
| ALL | 194 | 7 | 2.0 - 5925.0 (540.5) |
| 16Q LOSS MUTATED | 3 | 2 | 21.0 - 1967.0 (87.0) |
| 16Q LOSS WILD-TYPE | 191 | 5 | 2.0 - 5925.0 (541.0) |
Figure S26. Get High-res Image Gene #62: '16q loss' versus Clinical Feature #1: 'Time to Death'
P value = 2e-05 (Fisher's exact test), Q value = 0.014
Table S27. Gene #64: '18p loss' versus Clinical Feature #3: 'NEOPLASM.DISEASESTAGE'
| nPatients | STAGE I | STAGE II | STAGE III | STAGE IV |
|---|---|---|---|---|
| ALL | 137 | 16 | 43 | 13 |
| 18P LOSS MUTATED | 10 | 1 | 15 | 5 |
| 18P LOSS WILD-TYPE | 127 | 15 | 28 | 8 |
Figure S27. Get High-res Image Gene #64: '18p loss' versus Clinical Feature #3: 'NEOPLASM.DISEASESTAGE'
P value = 1e-05 (Fisher's exact test), Q value = 0.007
Table S28. Gene #64: '18p loss' versus Clinical Feature #4: 'PATHOLOGY.T.STAGE'
| nPatients | T1 | T2 | T3+T4 |
|---|---|---|---|
| ALL | 146 | 22 | 51 |
| 18P LOSS MUTATED | 10 | 3 | 20 |
| 18P LOSS WILD-TYPE | 136 | 19 | 31 |
Figure S28. Get High-res Image Gene #64: '18p loss' versus Clinical Feature #4: 'PATHOLOGY.T.STAGE'
P value = 1.06e-06 (logrank test), Q value = 0.00074
Table S29. Gene #65: '18q loss' versus Clinical Feature #1: 'Time to Death'
| nPatients | nDeath | Duration Range (Median), Year | |
|---|---|---|---|
| ALL | 194 | 7 | 2.0 - 5925.0 (540.5) |
| 18Q LOSS MUTATED | 31 | 6 | 4.0 - 3760.0 (232.0) |
| 18Q LOSS WILD-TYPE | 163 | 1 | 2.0 - 5925.0 (579.0) |
Figure S29. Get High-res Image Gene #65: '18q loss' versus Clinical Feature #1: 'Time to Death'
P value = 1e-05 (Fisher's exact test), Q value = 0.007
Table S30. Gene #65: '18q loss' versus Clinical Feature #3: 'NEOPLASM.DISEASESTAGE'
| nPatients | STAGE I | STAGE II | STAGE III | STAGE IV |
|---|---|---|---|---|
| ALL | 137 | 16 | 43 | 13 |
| 18Q LOSS MUTATED | 10 | 1 | 18 | 5 |
| 18Q LOSS WILD-TYPE | 127 | 15 | 25 | 8 |
Figure S30. Get High-res Image Gene #65: '18q loss' versus Clinical Feature #3: 'NEOPLASM.DISEASESTAGE'
P value = 1e-05 (Fisher's exact test), Q value = 0.007
Table S31. Gene #65: '18q loss' versus Clinical Feature #4: 'PATHOLOGY.T.STAGE'
| nPatients | T1 | T2 | T3+T4 |
|---|---|---|---|
| ALL | 146 | 22 | 51 |
| 18Q LOSS MUTATED | 11 | 3 | 22 |
| 18Q LOSS WILD-TYPE | 135 | 19 | 29 |
Figure S31. Get High-res Image Gene #65: '18q loss' versus Clinical Feature #4: 'PATHOLOGY.T.STAGE'
P value = 0.000199 (logrank test), Q value = 0.13
Table S32. Gene #66: '19p loss' versus Clinical Feature #1: 'Time to Death'
| nPatients | nDeath | Duration Range (Median), Year | |
|---|---|---|---|
| ALL | 194 | 7 | 2.0 - 5925.0 (540.5) |
| 19P LOSS MUTATED | 13 | 3 | 29.0 - 2584.0 (428.0) |
| 19P LOSS WILD-TYPE | 181 | 4 | 2.0 - 5925.0 (541.0) |
Figure S32. Get High-res Image Gene #66: '19p loss' versus Clinical Feature #1: 'Time to Death'
P value = 1.26e-12 (logrank test), Q value = 8.9e-10
Table S33. Gene #67: '19q loss' versus Clinical Feature #1: 'Time to Death'
| nPatients | nDeath | Duration Range (Median), Year | |
|---|---|---|---|
| ALL | 194 | 7 | 2.0 - 5925.0 (540.5) |
| 19Q LOSS MUTATED | 12 | 4 | 29.0 - 1967.0 (215.5) |
| 19Q LOSS WILD-TYPE | 182 | 3 | 2.0 - 5925.0 (562.0) |
Figure S33. Get High-res Image Gene #67: '19q loss' versus Clinical Feature #1: 'Time to Death'
P value = 0.00013 (Fisher's exact test), Q value = 0.088
Table S34. Gene #67: '19q loss' versus Clinical Feature #3: 'NEOPLASM.DISEASESTAGE'
| nPatients | STAGE I | STAGE II | STAGE III | STAGE IV |
|---|---|---|---|---|
| ALL | 137 | 16 | 43 | 13 |
| 19Q LOSS MUTATED | 1 | 1 | 8 | 1 |
| 19Q LOSS WILD-TYPE | 136 | 15 | 35 | 12 |
Figure S34. Get High-res Image Gene #67: '19q loss' versus Clinical Feature #3: 'NEOPLASM.DISEASESTAGE'
P value = 2e-04 (Fisher's exact test), Q value = 0.13
Table S35. Gene #67: '19q loss' versus Clinical Feature #4: 'PATHOLOGY.T.STAGE'
| nPatients | T1 | T2 | T3+T4 |
|---|---|---|---|
| ALL | 146 | 22 | 51 |
| 19Q LOSS MUTATED | 2 | 1 | 9 |
| 19Q LOSS WILD-TYPE | 144 | 21 | 42 |
Figure S35. Get High-res Image Gene #67: '19q loss' versus Clinical Feature #4: 'PATHOLOGY.T.STAGE'

P value = 1e-05 (Fisher's exact test), Q value = 0.007
Table S36. Gene #69: '22q loss' versus Clinical Feature #3: 'NEOPLASM.DISEASESTAGE'
| nPatients | STAGE I | STAGE II | STAGE III | STAGE IV |
|---|---|---|---|---|
| ALL | 137 | 16 | 43 | 13 |
| 22Q LOSS MUTATED | 17 | 3 | 21 | 7 |
| 22Q LOSS WILD-TYPE | 120 | 13 | 22 | 6 |
Figure S36. Get High-res Image Gene #69: '22q loss' versus Clinical Feature #3: 'NEOPLASM.DISEASESTAGE'
P value = 1e-05 (Fisher's exact test), Q value = 0.007
Table S37. Gene #69: '22q loss' versus Clinical Feature #4: 'PATHOLOGY.T.STAGE'
| nPatients | T1 | T2 | T3+T4 |
|---|---|---|---|
| ALL | 146 | 22 | 51 |
| 22Q LOSS MUTATED | 20 | 3 | 27 |
| 22Q LOSS WILD-TYPE | 126 | 19 | 24 |
Figure S37. Get High-res Image Gene #69: '22q loss' versus Clinical Feature #4: 'PATHOLOGY.T.STAGE'
P value = 0.000289 (Fisher's exact test), Q value = 0.19
Table S38. Gene #69: '22q loss' versus Clinical Feature #7: 'GENDER'
| nPatients | FEMALE | MALE |
|---|---|---|
| ALL | 63 | 158 |
| 22Q LOSS MUTATED | 25 | 25 |
| 22Q LOSS WILD-TYPE | 38 | 133 |
Figure S38. Get High-res Image Gene #69: '22q loss' versus Clinical Feature #7: 'GENDER'
P value = 1.84e-06 (logrank test), Q value = 0.0013
Table S39. Gene #70: 'xq loss' versus Clinical Feature #1: 'Time to Death'
| nPatients | nDeath | Duration Range (Median), Year | |
|---|---|---|---|
| ALL | 194 | 7 | 2.0 - 5925.0 (540.5) |
| XQ LOSS MUTATED | 17 | 4 | 4.0 - 2429.0 (307.0) |
| XQ LOSS WILD-TYPE | 177 | 3 | 2.0 - 5925.0 (579.0) |
Figure S39. Get High-res Image Gene #70: 'xq loss' versus Clinical Feature #1: 'Time to Death'
P value = 0.00017 (Fisher's exact test), Q value = 0.11
Table S40. Gene #70: 'xq loss' versus Clinical Feature #3: 'NEOPLASM.DISEASESTAGE'
| nPatients | STAGE I | STAGE II | STAGE III | STAGE IV |
|---|---|---|---|---|
| ALL | 137 | 16 | 43 | 13 |
| XQ LOSS MUTATED | 5 | 1 | 11 | 3 |
| XQ LOSS WILD-TYPE | 132 | 15 | 32 | 10 |
Figure S40. Get High-res Image Gene #70: 'xq loss' versus Clinical Feature #3: 'NEOPLASM.DISEASESTAGE'
P value = 1e-05 (Fisher's exact test), Q value = 0.007
Table S41. Gene #70: 'xq loss' versus Clinical Feature #4: 'PATHOLOGY.T.STAGE'
| nPatients | T1 | T2 | T3+T4 |
|---|---|---|---|
| ALL | 146 | 22 | 51 |
| XQ LOSS MUTATED | 6 | 1 | 14 |
| XQ LOSS WILD-TYPE | 140 | 21 | 37 |
Figure S41. Get High-res Image Gene #70: 'xq loss' versus Clinical Feature #4: 'PATHOLOGY.T.STAGE'

-
Copy number data file = transformed.cor.cli.txt
-
Clinical data file = KIRP-TP.merged_data.txt
-
Number of patients = 221
-
Number of significantly arm-level cnvs = 70
-
Number of selected clinical features = 11
-
Exclude regions that fewer than K tumors have mutations, K = 3
For survival clinical features, the Kaplan-Meier survival curves of tumors with and without gene mutations were plotted and the statistical significance P values were estimated by logrank test (Bland and Altman 2004) using the 'survdiff' function in R
For binary or multi-class clinical features (nominal or ordinal), two-tailed Fisher's exact tests (Fisher 1922) were used to estimate the P values using the 'fisher.test' function in R
For multiple hypothesis correction, Q value is the False Discovery Rate (FDR) analogue of the P value (Benjamini and Hochberg 1995), defined as the minimum FDR at which the test may be called significant. We used the 'Benjamini and Hochberg' method of 'p.adjust' function in R to convert P values into Q values.
In addition to the links below, the full results of the analysis summarized in this report can also be downloaded programmatically using firehose_get, or interactively from either the Broad GDAC website or TCGA Data Coordination Center Portal.