This pipeline computes the correlation between significant arm-level copy number variations (cnvs) and selected clinical features.
Testing the association between copy number variation 78 arm-level events and 8 clinical features across 430 patients, 28 significant findings detected with Q value < 0.25.
-
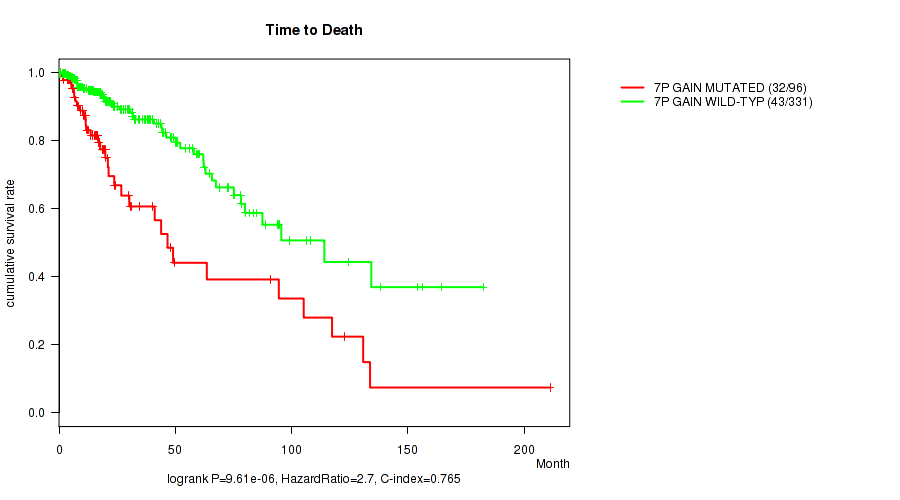
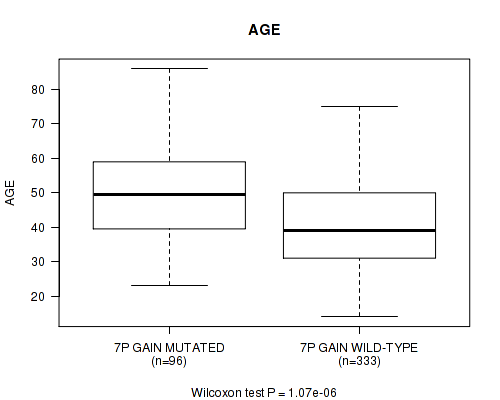
7p gain cnv correlated to 'Time to Death' and 'AGE'.
-
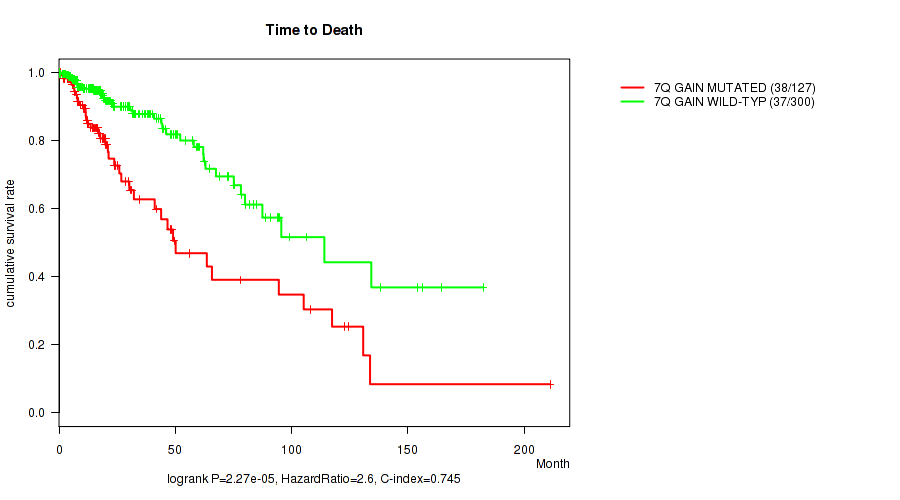
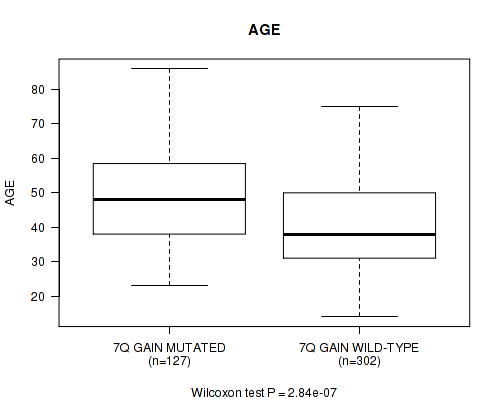
7q gain cnv correlated to 'Time to Death' and 'AGE'.
-
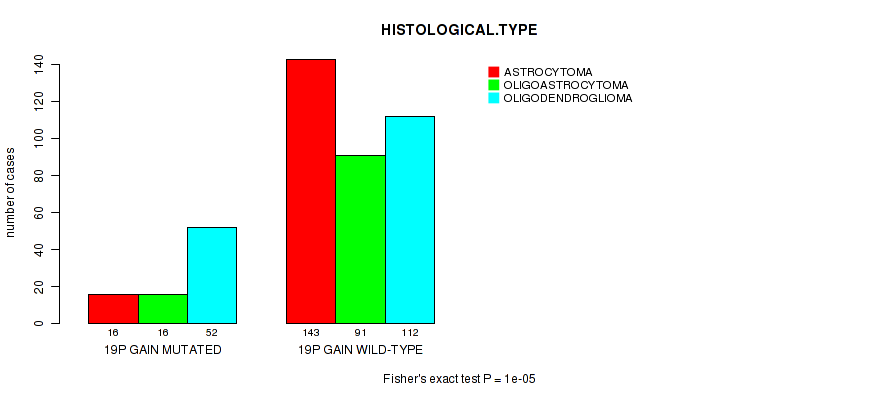
19p gain cnv correlated to 'HISTOLOGICAL.TYPE'.
-
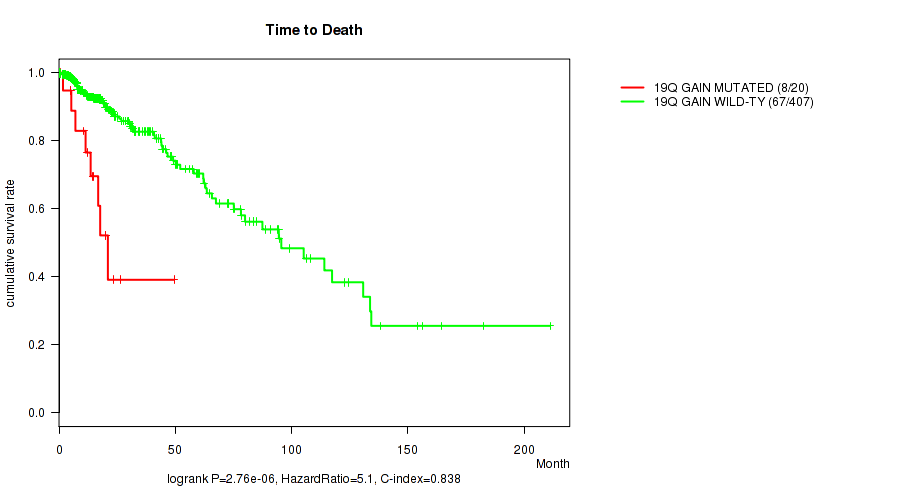
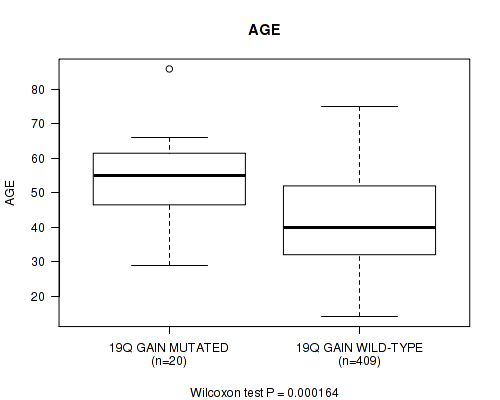
19q gain cnv correlated to 'Time to Death' and 'AGE'.
-
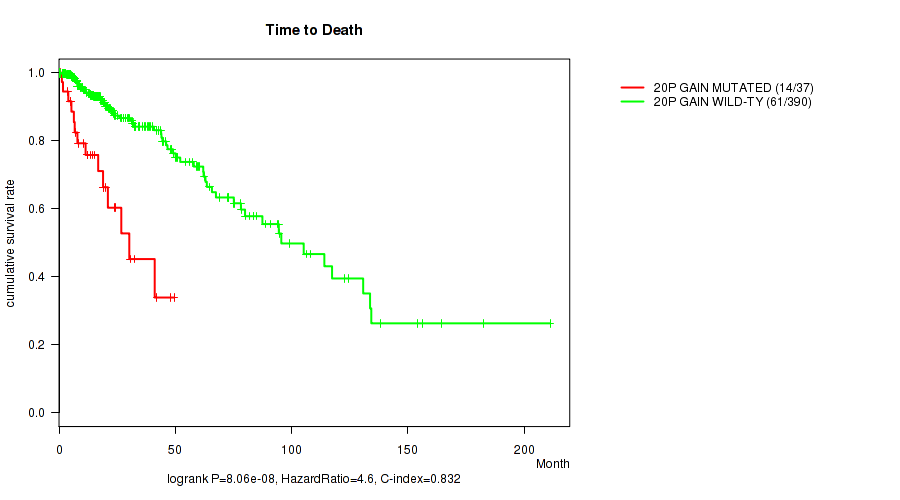
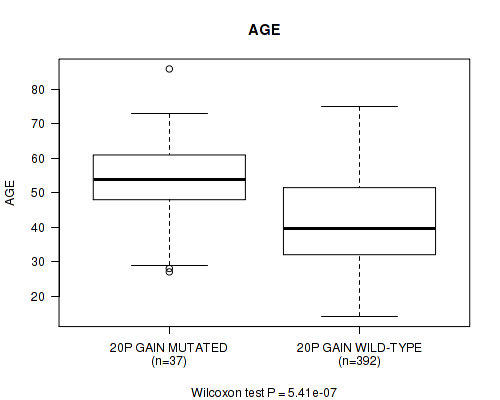
20p gain cnv correlated to 'Time to Death' and 'AGE'.
-
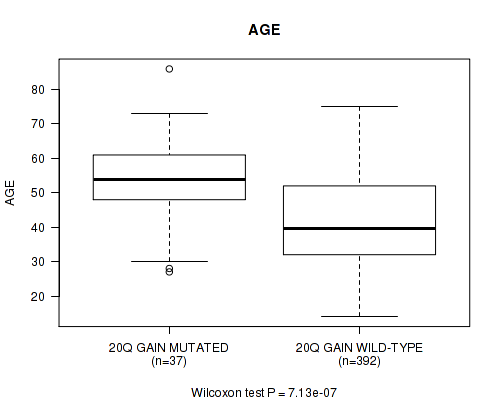
20q gain cnv correlated to 'Time to Death' and 'AGE'.
-
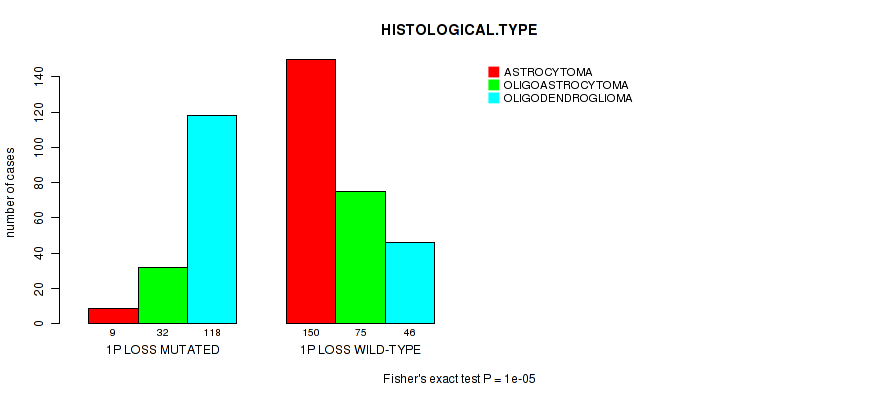
1p loss cnv correlated to 'HISTOLOGICAL.TYPE'.
-
6p loss cnv correlated to 'Time to Death'.
-
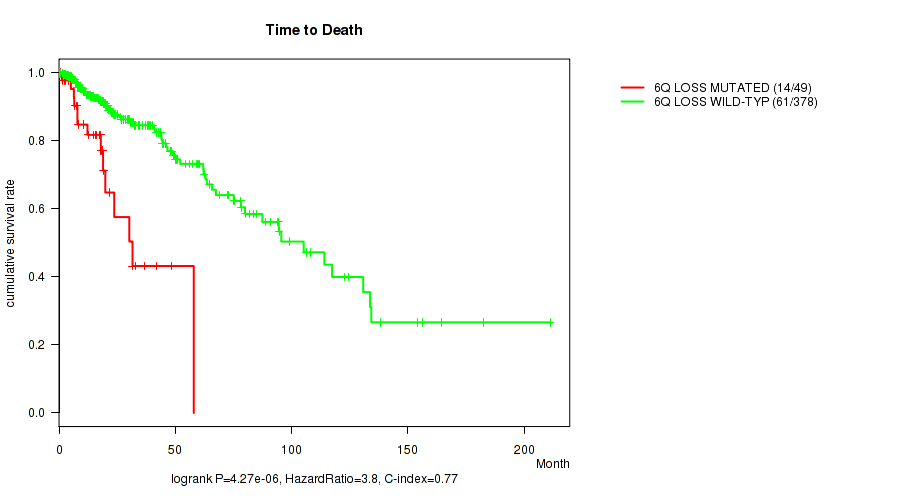
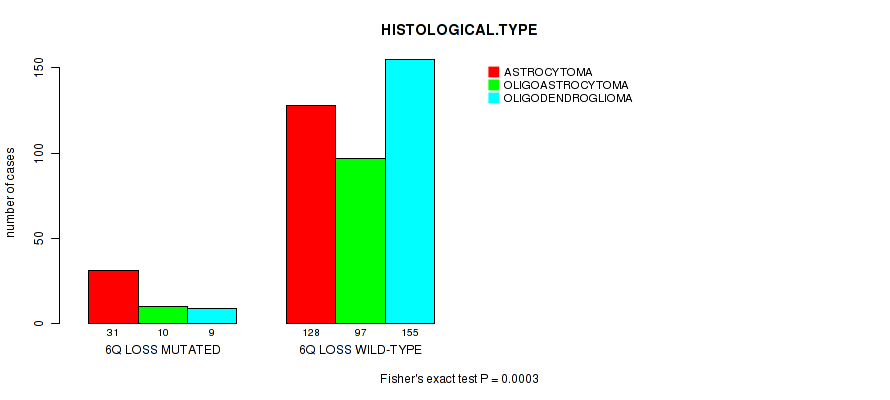
6q loss cnv correlated to 'Time to Death' and 'HISTOLOGICAL.TYPE'.
-
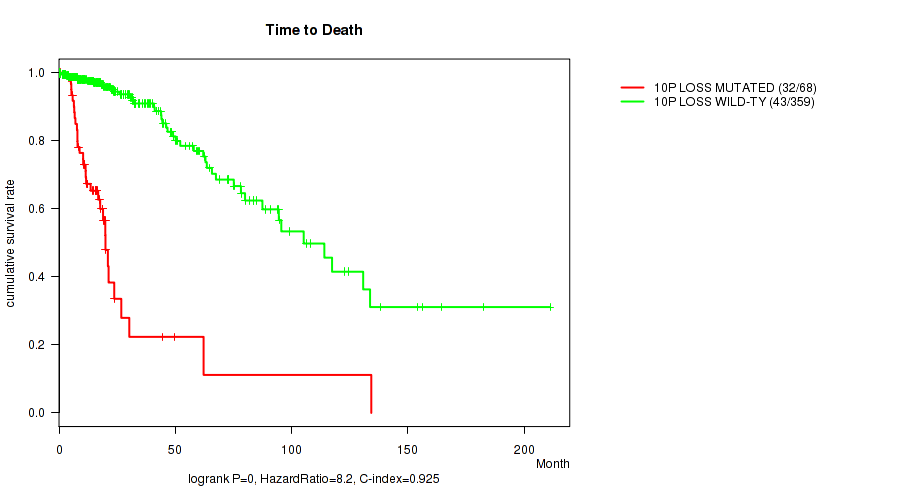
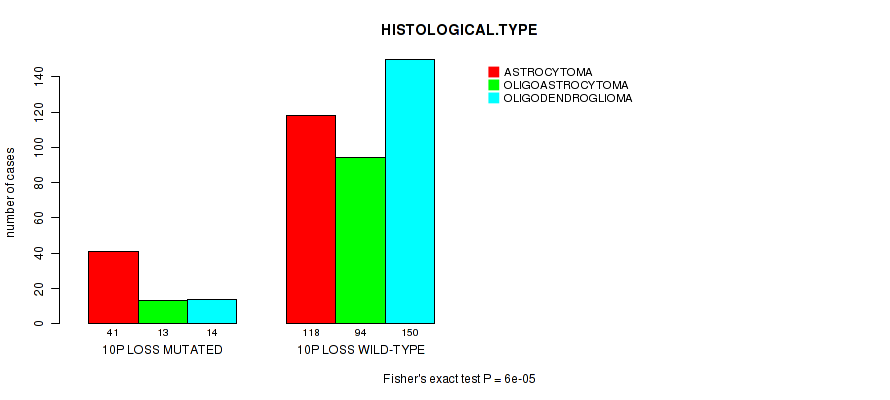
10p loss cnv correlated to 'Time to Death', 'AGE', and 'HISTOLOGICAL.TYPE'.
-
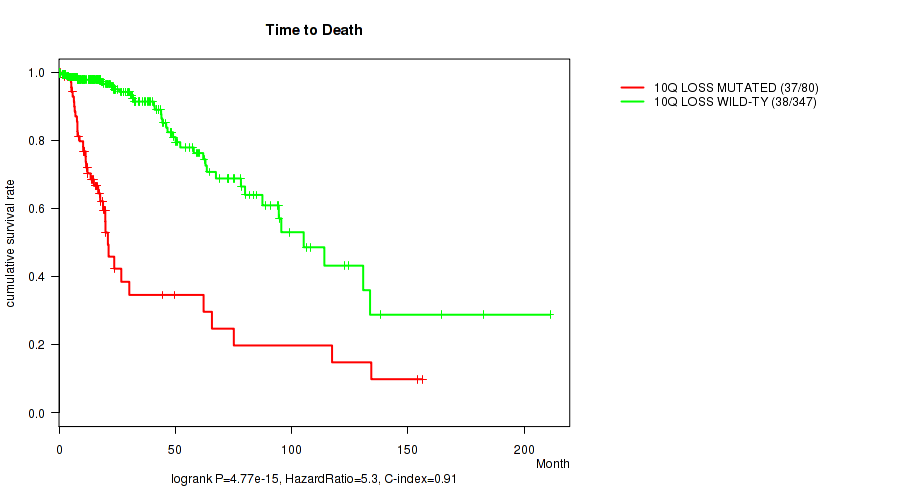
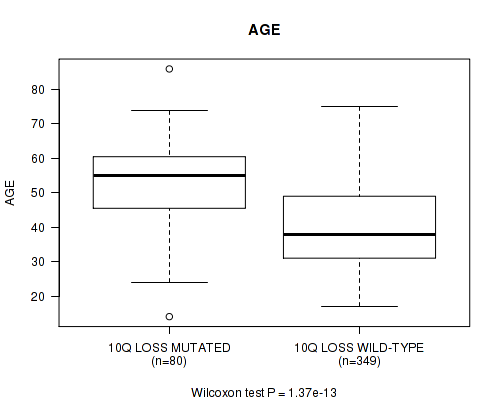
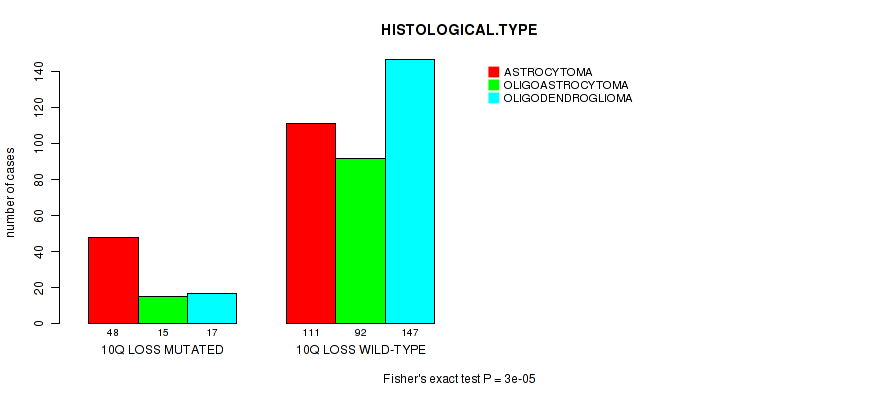
10q loss cnv correlated to 'Time to Death', 'AGE', and 'HISTOLOGICAL.TYPE'.
-
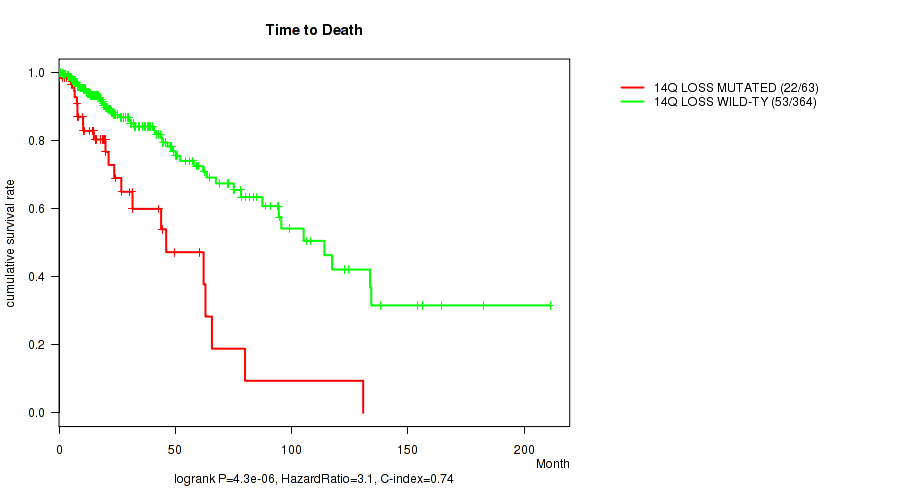
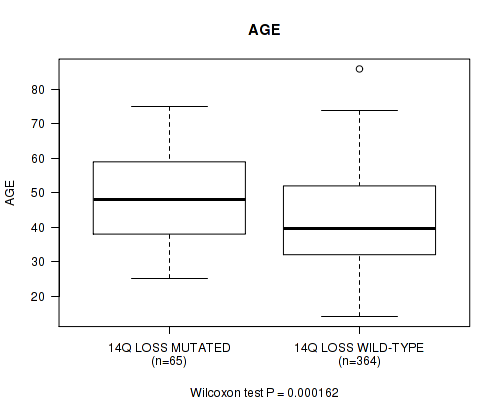
14q loss cnv correlated to 'Time to Death' and 'AGE'.
-
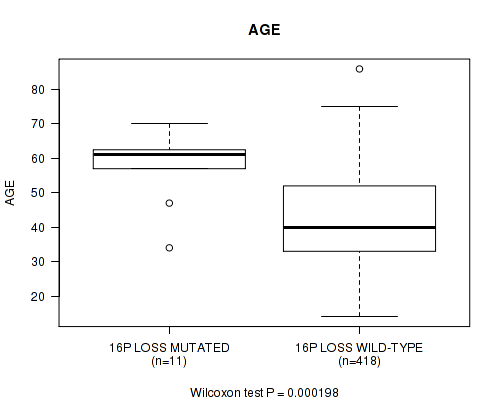
16p loss cnv correlated to 'AGE'.
-
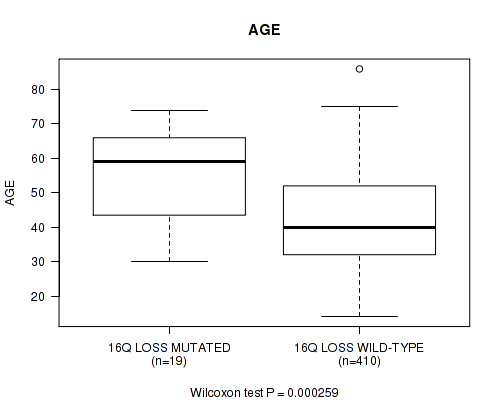
16q loss cnv correlated to 'AGE'.
-
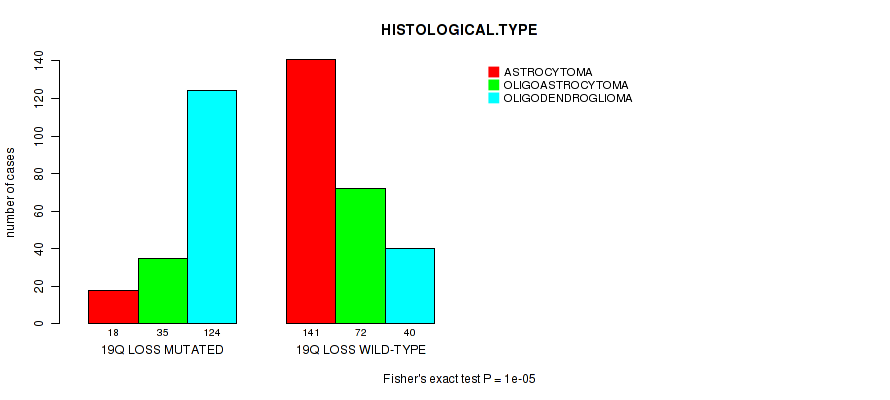
19q loss cnv correlated to 'HISTOLOGICAL.TYPE'.
-
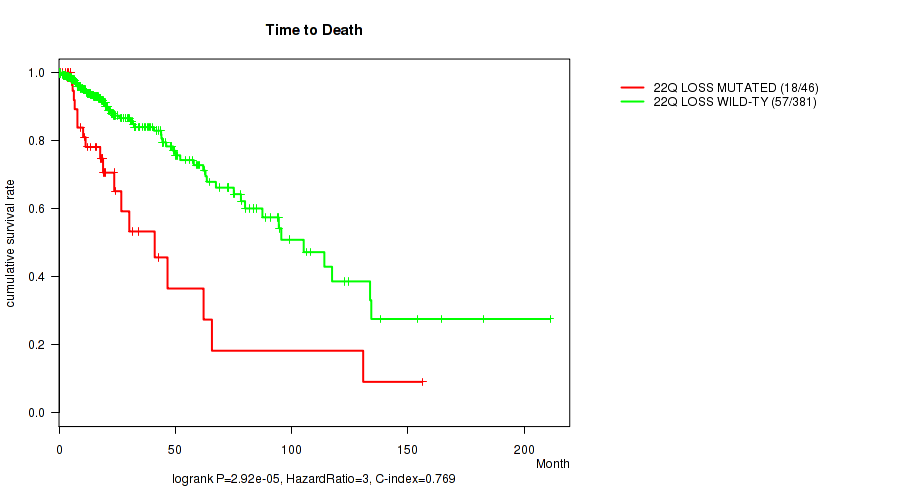
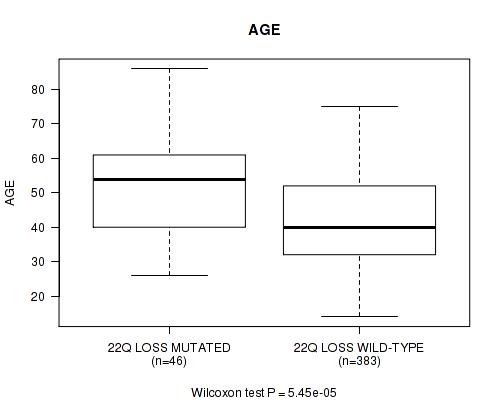
22q loss cnv correlated to 'Time to Death' and 'AGE'.
Table 1. Get Full Table Overview of the association between significant copy number variation of 78 arm-level events and 8 clinical features. Shown in the table are P values (Q values). Thresholded by Q value < 0.25, 28 significant findings detected.
|
Clinical Features |
Time to Death |
AGE | GENDER |
KARNOFSKY PERFORMANCE SCORE |
HISTOLOGICAL TYPE |
RADIATIONS RADIATION REGIMENINDICATION |
RACE | ETHNICITY | ||
| nCNV (%) | nWild-Type | logrank test | Wilcoxon-test | Fisher's exact test | Wilcoxon-test | Fisher's exact test | Fisher's exact test | Fisher's exact test | Fisher's exact test | |
| 10p loss | 68 (16%) | 362 |
0 (0) |
3.81e-15 (2.36e-12) |
0.506 (1.00) |
0.00292 (1.00) |
6e-05 (0.0359) |
0.625 (1.00) |
0.0277 (1.00) |
1 (1.00) |
| 10q loss | 80 (19%) | 350 |
4.77e-15 (2.95e-12) |
1.37e-13 (8.42e-11) |
0.384 (1.00) |
0.0147 (1.00) |
3e-05 (0.018) |
0.76 (1.00) |
0.0701 (1.00) |
0.747 (1.00) |
| 7p gain | 96 (22%) | 334 |
9.61e-06 (0.00583) |
1.07e-06 (0.000651) |
0.201 (1.00) |
0.179 (1.00) |
0.0965 (1.00) |
0.568 (1.00) |
0.0703 (1.00) |
0.767 (1.00) |
| 7q gain | 127 (30%) | 303 |
2.27e-05 (0.0137) |
2.84e-07 (0.000174) |
0.456 (1.00) |
0.452 (1.00) |
0.0223 (1.00) |
0.696 (1.00) |
0.128 (1.00) |
1 (1.00) |
| 19q gain | 20 (5%) | 410 |
2.76e-06 (0.00168) |
0.000164 (0.098) |
0.819 (1.00) |
0.229 (1.00) |
0.139 (1.00) |
0.579 (1.00) |
0.199 (1.00) |
0.545 (1.00) |
| 20p gain | 37 (9%) | 393 |
8.06e-08 (4.96e-05) |
5.41e-07 (0.000332) |
0.606 (1.00) |
0.0301 (1.00) |
0.319 (1.00) |
1 (1.00) |
0.326 (1.00) |
1 (1.00) |
| 20q gain | 37 (9%) | 393 |
1.27e-08 (7.8e-06) |
7.13e-07 (0.000436) |
0.228 (1.00) |
0.0534 (1.00) |
0.523 (1.00) |
1 (1.00) |
0.527 (1.00) |
1 (1.00) |
| 6q loss | 50 (12%) | 380 |
4.27e-06 (0.0026) |
0.051 (1.00) |
0.65 (1.00) |
0.0061 (1.00) |
0.0003 (0.178) |
0.0951 (1.00) |
0.0886 (1.00) |
0.696 (1.00) |
| 14q loss | 65 (15%) | 365 |
4.3e-06 (0.00261) |
0.000162 (0.0965) |
0.893 (1.00) |
0.0442 (1.00) |
0.183 (1.00) |
0.507 (1.00) |
0.252 (1.00) |
0.486 (1.00) |
| 22q loss | 46 (11%) | 384 |
2.92e-05 (0.0175) |
5.45e-05 (0.0326) |
0.639 (1.00) |
0.0245 (1.00) |
0.228 (1.00) |
1 (1.00) |
0.169 (1.00) |
1 (1.00) |
| 19p gain | 84 (20%) | 346 |
0.684 (1.00) |
0.0113 (1.00) |
0.465 (1.00) |
0.109 (1.00) |
1e-05 (0.00606) |
0.765 (1.00) |
0.567 (1.00) |
0.53 (1.00) |
| 1p loss | 159 (37%) | 271 |
0.00125 (0.734) |
0.000641 (0.378) |
1 (1.00) |
0.768 (1.00) |
1e-05 (0.00606) |
0.0188 (1.00) |
0.351 (1.00) |
1 (1.00) |
| 6p loss | 25 (6%) | 405 |
1.26e-05 (0.00757) |
0.156 (1.00) |
1 (1.00) |
0.298 (1.00) |
0.153 (1.00) |
1 (1.00) |
0.116 (1.00) |
0.6 (1.00) |
| 16p loss | 11 (3%) | 419 |
0.0632 (1.00) |
0.000198 (0.118) |
0.36 (1.00) |
0.155 (1.00) |
0.544 (1.00) |
1 (1.00) |
1 (1.00) |
0.363 (1.00) |
| 16q loss | 19 (4%) | 411 |
0.0525 (1.00) |
0.000259 (0.154) |
1 (1.00) |
0.384 (1.00) |
0.362 (1.00) |
0.563 (1.00) |
0.629 (1.00) |
0.545 (1.00) |
| 19q loss | 177 (41%) | 253 |
0.0265 (1.00) |
0.0109 (1.00) |
1 (1.00) |
0.543 (1.00) |
1e-05 (0.00606) |
0.185 (1.00) |
0.924 (1.00) |
0.801 (1.00) |
| 1p gain | 11 (3%) | 419 |
0.00637 (1.00) |
0.0415 (1.00) |
0.227 (1.00) |
0.988 (1.00) |
0.00666 (1.00) |
0.704 (1.00) |
1 (1.00) |
1 (1.00) |
| 1q gain | 18 (4%) | 412 |
0.38 (1.00) |
0.000736 (0.433) |
0.342 (1.00) |
0.108 (1.00) |
0.204 (1.00) |
0.55 (1.00) |
1 (1.00) |
1 (1.00) |
| 2p gain | 11 (3%) | 419 |
0.944 (1.00) |
0.103 (1.00) |
0.548 (1.00) |
0.261 (1.00) |
0.502 (1.00) |
1 (1.00) |
1 (1.00) |
0.336 (1.00) |
| 2q gain | 10 (2%) | 420 |
0.58 (1.00) |
0.237 (1.00) |
0.348 (1.00) |
0.261 (1.00) |
0.609 (1.00) |
1 (1.00) |
1 (1.00) |
0.308 (1.00) |
| 3p gain | 11 (3%) | 419 |
0.00159 (0.931) |
0.0819 (1.00) |
0.548 (1.00) |
0.748 (1.00) |
0.0243 (1.00) |
0.704 (1.00) |
1 (1.00) |
1 (1.00) |
| 3q gain | 8 (2%) | 422 |
0.000563 (0.333) |
0.0314 (1.00) |
0.31 (1.00) |
0.292 (1.00) |
0.0786 (1.00) |
0.371 (1.00) |
1 (1.00) |
1 (1.00) |
| 4p gain | 11 (3%) | 419 |
0.269 (1.00) |
0.849 (1.00) |
1 (1.00) |
0.986 (1.00) |
0.0236 (1.00) |
0.473 (1.00) |
0.434 (1.00) |
1 (1.00) |
| 4q gain | 4 (1%) | 426 |
0.604 (1.00) |
0.737 (1.00) |
1 (1.00) |
0.377 (1.00) |
0.585 (1.00) |
1 (1.00) |
1 (1.00) |
|
| 5p gain | 8 (2%) | 422 |
0.634 (1.00) |
0.242 (1.00) |
0.736 (1.00) |
0.911 (1.00) |
0.233 (1.00) |
1 (1.00) |
0.128 (1.00) |
1 (1.00) |
| 5q gain | 5 (1%) | 425 |
0.431 (1.00) |
0.582 (1.00) |
0.659 (1.00) |
0.993 (1.00) |
0.648 (1.00) |
0.588 (1.00) |
0.0703 (1.00) |
1 (1.00) |
| 6p gain | 7 (2%) | 423 |
0.809 (1.00) |
0.12 (1.00) |
0.249 (1.00) |
0.993 (1.00) |
0.205 (1.00) |
0.638 (1.00) |
1 (1.00) |
1 (1.00) |
| 8p gain | 39 (9%) | 391 |
0.725 (1.00) |
0.944 (1.00) |
0.502 (1.00) |
0.976 (1.00) |
0.127 (1.00) |
0.836 (1.00) |
1 (1.00) |
1 (1.00) |
| 8q gain | 46 (11%) | 384 |
0.657 (1.00) |
0.353 (1.00) |
0.531 (1.00) |
0.563 (1.00) |
0.0102 (1.00) |
0.848 (1.00) |
0.841 (1.00) |
1 (1.00) |
| 9p gain | 14 (3%) | 416 |
0.0704 (1.00) |
0.0117 (1.00) |
0.0531 (1.00) |
0.47 (1.00) |
0.424 (1.00) |
1 (1.00) |
1 (1.00) |
1 (1.00) |
| 9q gain | 20 (5%) | 410 |
0.0652 (1.00) |
0.0149 (1.00) |
0.0053 (1.00) |
0.403 (1.00) |
0.105 (1.00) |
0.777 (1.00) |
0.197 (1.00) |
0.564 (1.00) |
| 10p gain | 44 (10%) | 386 |
0.798 (1.00) |
0.0616 (1.00) |
0.2 (1.00) |
0.182 (1.00) |
0.0117 (1.00) |
0.00496 (1.00) |
0.714 (1.00) |
0.0734 (1.00) |
| 10q gain | 8 (2%) | 422 |
0.78 (1.00) |
0.29 (1.00) |
0.475 (1.00) |
0.221 (1.00) |
0.0787 (1.00) |
0.371 (1.00) |
0.0475 (1.00) |
0.249 (1.00) |
| 11p gain | 27 (6%) | 403 |
0.492 (1.00) |
0.0181 (1.00) |
0.235 (1.00) |
0.747 (1.00) |
0.0353 (1.00) |
0.808 (1.00) |
0.748 (1.00) |
1 (1.00) |
| 11q gain | 49 (11%) | 381 |
0.515 (1.00) |
0.0188 (1.00) |
0.126 (1.00) |
0.681 (1.00) |
0.36 (1.00) |
1 (1.00) |
0.854 (1.00) |
1 (1.00) |
| 12p gain | 27 (6%) | 403 |
0.751 (1.00) |
0.594 (1.00) |
0.16 (1.00) |
0.618 (1.00) |
0.587 (1.00) |
0.808 (1.00) |
0.305 (1.00) |
1 (1.00) |
| 12q gain | 13 (3%) | 417 |
0.00182 (1.00) |
0.186 (1.00) |
0.403 (1.00) |
0.221 (1.00) |
1 (1.00) |
1 (1.00) |
0.251 (1.00) |
1 (1.00) |
| 13q gain | 6 (1%) | 424 |
0.459 (1.00) |
0.925 (1.00) |
1 (1.00) |
0.041 (1.00) |
0.885 (1.00) |
0.353 (1.00) |
1 (1.00) |
1 (1.00) |
| 14q gain | 3 (1%) | 427 |
0.404 (1.00) |
0.203 (1.00) |
1 (1.00) |
1 (1.00) |
0.11 (1.00) |
1 (1.00) |
1 (1.00) |
|
| 15q gain | 8 (2%) | 422 |
0.0939 (1.00) |
0.00867 (1.00) |
0.475 (1.00) |
0.293 (1.00) |
0.231 (1.00) |
0.672 (1.00) |
1 (1.00) |
1 (1.00) |
| 16p gain | 16 (4%) | 414 |
0.377 (1.00) |
0.112 (1.00) |
0.443 (1.00) |
0.518 (1.00) |
0.113 (1.00) |
0.752 (1.00) |
0.542 (1.00) |
1 (1.00) |
| 16q gain | 18 (4%) | 412 |
0.162 (1.00) |
0.785 (1.00) |
0.342 (1.00) |
0.856 (1.00) |
0.0226 (1.00) |
0.55 (1.00) |
0.59 (1.00) |
1 (1.00) |
| 17p gain | 17 (4%) | 413 |
0.0691 (1.00) |
0.125 (1.00) |
0.319 (1.00) |
0.645 (1.00) |
0.129 (1.00) |
0.762 (1.00) |
0.314 (1.00) |
0.484 (1.00) |
| 17q gain | 19 (4%) | 411 |
0.0149 (1.00) |
0.305 (1.00) |
0.346 (1.00) |
1 (1.00) |
0.248 (1.00) |
1 (1.00) |
0.332 (1.00) |
0.484 (1.00) |
| 18p gain | 13 (3%) | 417 |
0.0585 (1.00) |
0.86 (1.00) |
0.781 (1.00) |
0.454 (1.00) |
0.248 (1.00) |
1 (1.00) |
0.49 (1.00) |
1 (1.00) |
| 18q gain | 9 (2%) | 421 |
0.121 (1.00) |
0.535 (1.00) |
0.737 (1.00) |
0.947 (1.00) |
0.432 (1.00) |
0.692 (1.00) |
0.372 (1.00) |
1 (1.00) |
| 21q gain | 21 (5%) | 409 |
0.177 (1.00) |
0.00625 (1.00) |
0.502 (1.00) |
0.212 (1.00) |
0.814 (1.00) |
0.782 (1.00) |
0.409 (1.00) |
1 (1.00) |
| 22q gain | 15 (3%) | 415 |
0.79 (1.00) |
0.0435 (1.00) |
0.797 (1.00) |
0.173 (1.00) |
0.0243 (1.00) |
1 (1.00) |
1 (1.00) |
0.389 (1.00) |
| xq gain | 30 (7%) | 400 |
0.922 (1.00) |
0.465 (1.00) |
0.00389 (1.00) |
0.404 (1.00) |
0.0733 (1.00) |
0.482 (1.00) |
0.23 (1.00) |
0.108 (1.00) |
| 1q loss | 23 (5%) | 407 |
0.732 (1.00) |
0.0469 (1.00) |
0.83 (1.00) |
0.959 (1.00) |
0.0287 (1.00) |
0.595 (1.00) |
0.143 (1.00) |
0.6 (1.00) |
| 2p loss | 16 (4%) | 414 |
0.263 (1.00) |
0.845 (1.00) |
0.318 (1.00) |
0.784 (1.00) |
0.477 (1.00) |
1 (1.00) |
1 (1.00) |
1 (1.00) |
| 2q loss | 13 (3%) | 417 |
0.909 (1.00) |
0.156 (1.00) |
0.403 (1.00) |
0.47 (1.00) |
0.127 (1.00) |
0.737 (1.00) |
1 (1.00) |
1 (1.00) |
| 3p loss | 21 (5%) | 409 |
0.0533 (1.00) |
0.66 (1.00) |
0.178 (1.00) |
0.000528 (0.313) |
0.608 (1.00) |
1 (1.00) |
1 (1.00) |
0.185 (1.00) |
| 3q loss | 23 (5%) | 407 |
0.0166 (1.00) |
0.427 (1.00) |
0.0856 (1.00) |
0.186 (1.00) |
0.963 (1.00) |
0.595 (1.00) |
0.705 (1.00) |
0.215 (1.00) |
| 4p loss | 58 (13%) | 372 |
0.753 (1.00) |
0.00391 (1.00) |
0.0654 (1.00) |
0.734 (1.00) |
0.00201 (1.00) |
0.166 (1.00) |
0.422 (1.00) |
0.143 (1.00) |
| 4q loss | 74 (17%) | 356 |
0.782 (1.00) |
0.155 (1.00) |
0.158 (1.00) |
0.942 (1.00) |
0.0051 (1.00) |
0.27 (1.00) |
0.751 (1.00) |
0.0868 (1.00) |
| 5p loss | 28 (7%) | 402 |
0.89 (1.00) |
0.224 (1.00) |
0.695 (1.00) |
0.115 (1.00) |
0.0148 (1.00) |
0.00622 (1.00) |
0.761 (1.00) |
0.614 (1.00) |
| 5q loss | 28 (7%) | 402 |
0.054 (1.00) |
0.229 (1.00) |
0.329 (1.00) |
0.515 (1.00) |
0.0669 (1.00) |
0.0264 (1.00) |
0.762 (1.00) |
1 (1.00) |
| 7p loss | 3 (1%) | 427 |
0.546 (1.00) |
0.64 (1.00) |
0.586 (1.00) |
0.628 (1.00) |
1 (1.00) |
1 (1.00) |
1 (1.00) |
|
| 7q loss | 3 (1%) | 427 |
0.677 (1.00) |
0.94 (1.00) |
1 (1.00) |
0.925 (1.00) |
0.627 (1.00) |
1 (1.00) |
1 (1.00) |
1 (1.00) |
| 8p loss | 13 (3%) | 417 |
0.0589 (1.00) |
0.152 (1.00) |
0.781 (1.00) |
0.157 (1.00) |
0.248 (1.00) |
0.319 (1.00) |
0.253 (1.00) |
0.414 (1.00) |
| 8q loss | 9 (2%) | 421 |
0.0211 (1.00) |
0.14 (1.00) |
0.517 (1.00) |
0.339 (1.00) |
0.434 (1.00) |
1 (1.00) |
0.17 (1.00) |
0.308 (1.00) |
| 9p loss | 96 (22%) | 334 |
0.000583 (0.344) |
0.0636 (1.00) |
0.816 (1.00) |
0.237 (1.00) |
0.083 (1.00) |
0.0461 (1.00) |
0.745 (1.00) |
0.539 (1.00) |
| 9q loss | 38 (9%) | 392 |
0.0629 (1.00) |
0.189 (1.00) |
0.865 (1.00) |
0.014 (1.00) |
0.952 (1.00) |
1 (1.00) |
0.16 (1.00) |
0.645 (1.00) |
| 11p loss | 53 (12%) | 377 |
0.285 (1.00) |
0.464 (1.00) |
0.463 (1.00) |
0.122 (1.00) |
0.011 (1.00) |
0.471 (1.00) |
1 (1.00) |
1 (1.00) |
| 11q loss | 19 (4%) | 411 |
0.00335 (1.00) |
0.0684 (1.00) |
0.816 (1.00) |
0.0654 (1.00) |
0.0216 (1.00) |
0.388 (1.00) |
1 (1.00) |
0.545 (1.00) |
| 12p loss | 21 (5%) | 409 |
0.774 (1.00) |
0.342 (1.00) |
0.502 (1.00) |
0.398 (1.00) |
0.162 (1.00) |
0.782 (1.00) |
1 (1.00) |
1 (1.00) |
| 12q loss | 40 (9%) | 390 |
0.436 (1.00) |
0.295 (1.00) |
0.739 (1.00) |
0.334 (1.00) |
0.0344 (1.00) |
0.538 (1.00) |
0.686 (1.00) |
0.382 (1.00) |
| 13q loss | 98 (23%) | 332 |
0.156 (1.00) |
0.672 (1.00) |
0.105 (1.00) |
0.26 (1.00) |
0.534 (1.00) |
0.0161 (1.00) |
0.441 (1.00) |
0.382 (1.00) |
| 15q loss | 39 (9%) | 391 |
0.173 (1.00) |
0.671 (1.00) |
0.502 (1.00) |
0.952 (1.00) |
0.77 (1.00) |
1 (1.00) |
0.804 (1.00) |
1 (1.00) |
| 17p loss | 12 (3%) | 418 |
0.0148 (1.00) |
0.0464 (1.00) |
0.383 (1.00) |
0.00305 (1.00) |
0.706 (1.00) |
0.473 (1.00) |
1 (1.00) |
0.0774 (1.00) |
| 17q loss | 8 (2%) | 422 |
0.44 (1.00) |
0.155 (1.00) |
0.736 (1.00) |
0.0341 (1.00) |
0.825 (1.00) |
1 (1.00) |
1 (1.00) |
0.036 (1.00) |
| 18p loss | 59 (14%) | 371 |
0.664 (1.00) |
0.00674 (1.00) |
0.0491 (1.00) |
0.681 (1.00) |
0.313 (1.00) |
0.733 (1.00) |
0.0727 (1.00) |
0.453 (1.00) |
| 18q loss | 54 (13%) | 376 |
0.666 (1.00) |
0.0524 (1.00) |
0.306 (1.00) |
0.899 (1.00) |
0.203 (1.00) |
1 (1.00) |
0.0995 (1.00) |
0.433 (1.00) |
| 19p loss | 19 (4%) | 411 |
0.358 (1.00) |
0.971 (1.00) |
0.816 (1.00) |
0.174 (1.00) |
0.956 (1.00) |
0.0853 (1.00) |
0.11 (1.00) |
0.505 (1.00) |
| 20p loss | 5 (1%) | 425 |
0.657 (1.00) |
0.99 (1.00) |
0.659 (1.00) |
0.547 (1.00) |
1 (1.00) |
0.0903 (1.00) |
1 (1.00) |
|
| 21q loss | 26 (6%) | 404 |
0.686 (1.00) |
0.859 (1.00) |
0.317 (1.00) |
0.00207 (1.00) |
0.0262 (1.00) |
0.622 (1.00) |
1 (1.00) |
1 (1.00) |
| xq loss | 56 (13%) | 374 |
0.0239 (1.00) |
0.201 (1.00) |
0.195 (1.00) |
0.478 (1.00) |
0.887 (1.00) |
0.861 (1.00) |
0.401 (1.00) |
1 (1.00) |
P value = 9.61e-06 (logrank test), Q value = 0.0058
Table S1. Gene #12: '7p gain' versus Clinical Feature #1: 'Time to Death'
| nPatients | nDeath | Duration Range (Median), Month | |
|---|---|---|---|
| ALL | 427 | 75 | 0.0 - 211.2 (15.9) |
| 7P GAIN MUTATED | 96 | 32 | 0.1 - 211.2 (14.9) |
| 7P GAIN WILD-TYPE | 331 | 43 | 0.0 - 182.3 (16.0) |
Figure S1. Get High-res Image Gene #12: '7p gain' versus Clinical Feature #1: 'Time to Death'
P value = 1.07e-06 (Wilcoxon-test), Q value = 0.00065
Table S2. Gene #12: '7p gain' versus Clinical Feature #2: 'AGE'
| nPatients | Mean (Std.Dev) | |
|---|---|---|
| ALL | 429 | 43.0 (13.2) |
| 7P GAIN MUTATED | 96 | 48.9 (13.1) |
| 7P GAIN WILD-TYPE | 333 | 41.3 (12.8) |
Figure S2. Get High-res Image Gene #12: '7p gain' versus Clinical Feature #2: 'AGE'
P value = 2.27e-05 (logrank test), Q value = 0.014
Table S3. Gene #13: '7q gain' versus Clinical Feature #1: 'Time to Death'
| nPatients | nDeath | Duration Range (Median), Month | |
|---|---|---|---|
| ALL | 427 | 75 | 0.0 - 211.2 (15.9) |
| 7Q GAIN MUTATED | 127 | 38 | 0.1 - 211.2 (15.3) |
| 7Q GAIN WILD-TYPE | 300 | 37 | 0.0 - 182.3 (16.1) |
Figure S3. Get High-res Image Gene #13: '7q gain' versus Clinical Feature #1: 'Time to Death'
P value = 2.84e-07 (Wilcoxon-test), Q value = 0.00017
Table S4. Gene #13: '7q gain' versus Clinical Feature #2: 'AGE'
| nPatients | Mean (Std.Dev) | |
|---|---|---|
| ALL | 429 | 43.0 (13.2) |
| 7Q GAIN MUTATED | 127 | 48.1 (13.2) |
| 7Q GAIN WILD-TYPE | 302 | 40.8 (12.7) |
Figure S4. Get High-res Image Gene #13: '7q gain' versus Clinical Feature #2: 'AGE'
P value = 1e-05 (Fisher's exact test), Q value = 0.0061
Table S5. Gene #33: '19p gain' versus Clinical Feature #5: 'HISTOLOGICAL.TYPE'
| nPatients | ASTROCYTOMA | OLIGOASTROCYTOMA | OLIGODENDROGLIOMA |
|---|---|---|---|
| ALL | 159 | 107 | 164 |
| 19P GAIN MUTATED | 16 | 16 | 52 |
| 19P GAIN WILD-TYPE | 143 | 91 | 112 |
Figure S5. Get High-res Image Gene #33: '19p gain' versus Clinical Feature #5: 'HISTOLOGICAL.TYPE'
P value = 2.76e-06 (logrank test), Q value = 0.0017
Table S6. Gene #34: '19q gain' versus Clinical Feature #1: 'Time to Death'
| nPatients | nDeath | Duration Range (Median), Month | |
|---|---|---|---|
| ALL | 427 | 75 | 0.0 - 211.2 (15.9) |
| 19Q GAIN MUTATED | 20 | 8 | 0.5 - 49.5 (14.1) |
| 19Q GAIN WILD-TYPE | 407 | 67 | 0.0 - 211.2 (16.0) |
Figure S6. Get High-res Image Gene #34: '19q gain' versus Clinical Feature #1: 'Time to Death'
P value = 0.000164 (Wilcoxon-test), Q value = 0.098
Table S7. Gene #34: '19q gain' versus Clinical Feature #2: 'AGE'
| nPatients | Mean (Std.Dev) | |
|---|---|---|
| ALL | 429 | 43.0 (13.2) |
| 19Q GAIN MUTATED | 20 | 54.4 (12.2) |
| 19Q GAIN WILD-TYPE | 409 | 42.4 (13.1) |
Figure S7. Get High-res Image Gene #34: '19q gain' versus Clinical Feature #2: 'AGE'
P value = 8.06e-08 (logrank test), Q value = 5e-05
Table S8. Gene #35: '20p gain' versus Clinical Feature #1: 'Time to Death'
| nPatients | nDeath | Duration Range (Median), Month | |
|---|---|---|---|
| ALL | 427 | 75 | 0.0 - 211.2 (15.9) |
| 20P GAIN MUTATED | 37 | 14 | 0.5 - 49.5 (13.5) |
| 20P GAIN WILD-TYPE | 390 | 61 | 0.0 - 211.2 (16.1) |
Figure S8. Get High-res Image Gene #35: '20p gain' versus Clinical Feature #1: 'Time to Death'
P value = 5.41e-07 (Wilcoxon-test), Q value = 0.00033
Table S9. Gene #35: '20p gain' versus Clinical Feature #2: 'AGE'
| nPatients | Mean (Std.Dev) | |
|---|---|---|
| ALL | 429 | 43.0 (13.2) |
| 20P GAIN MUTATED | 37 | 54.2 (12.9) |
| 20P GAIN WILD-TYPE | 392 | 41.9 (12.8) |
Figure S9. Get High-res Image Gene #35: '20p gain' versus Clinical Feature #2: 'AGE'
P value = 1.27e-08 (logrank test), Q value = 7.8e-06
Table S10. Gene #36: '20q gain' versus Clinical Feature #1: 'Time to Death'
| nPatients | nDeath | Duration Range (Median), Month | |
|---|---|---|---|
| ALL | 427 | 75 | 0.0 - 211.2 (15.9) |
| 20Q GAIN MUTATED | 37 | 14 | 0.5 - 49.5 (13.5) |
| 20Q GAIN WILD-TYPE | 390 | 61 | 0.0 - 211.2 (16.1) |
Figure S10. Get High-res Image Gene #36: '20q gain' versus Clinical Feature #1: 'Time to Death'

P value = 7.13e-07 (Wilcoxon-test), Q value = 0.00044
Table S11. Gene #36: '20q gain' versus Clinical Feature #2: 'AGE'
| nPatients | Mean (Std.Dev) | |
|---|---|---|
| ALL | 429 | 43.0 (13.2) |
| 20Q GAIN MUTATED | 37 | 54.1 (13.1) |
| 20Q GAIN WILD-TYPE | 392 | 41.9 (12.8) |
Figure S11. Get High-res Image Gene #36: '20q gain' versus Clinical Feature #2: 'AGE'
P value = 1e-05 (Fisher's exact test), Q value = 0.0061
Table S12. Gene #40: '1p loss' versus Clinical Feature #5: 'HISTOLOGICAL.TYPE'
| nPatients | ASTROCYTOMA | OLIGOASTROCYTOMA | OLIGODENDROGLIOMA |
|---|---|---|---|
| ALL | 159 | 107 | 164 |
| 1P LOSS MUTATED | 9 | 32 | 118 |
| 1P LOSS WILD-TYPE | 150 | 75 | 46 |
Figure S12. Get High-res Image Gene #40: '1p loss' versus Clinical Feature #5: 'HISTOLOGICAL.TYPE'
P value = 1.26e-05 (logrank test), Q value = 0.0076
Table S13. Gene #50: '6p loss' versus Clinical Feature #1: 'Time to Death'
| nPatients | nDeath | Duration Range (Median), Month | |
|---|---|---|---|
| ALL | 427 | 75 | 0.0 - 211.2 (15.9) |
| 6P LOSS MUTATED | 25 | 9 | 0.2 - 48.4 (15.5) |
| 6P LOSS WILD-TYPE | 402 | 66 | 0.0 - 211.2 (16.0) |
Figure S13. Get High-res Image Gene #50: '6p loss' versus Clinical Feature #1: 'Time to Death'

P value = 4.27e-06 (logrank test), Q value = 0.0026
Table S14. Gene #51: '6q loss' versus Clinical Feature #1: 'Time to Death'
| nPatients | nDeath | Duration Range (Median), Month | |
|---|---|---|---|
| ALL | 427 | 75 | 0.0 - 211.2 (15.9) |
| 6Q LOSS MUTATED | 49 | 14 | 0.1 - 57.9 (15.5) |
| 6Q LOSS WILD-TYPE | 378 | 61 | 0.0 - 211.2 (16.0) |
Figure S14. Get High-res Image Gene #51: '6q loss' versus Clinical Feature #1: 'Time to Death'
P value = 3e-04 (Fisher's exact test), Q value = 0.18
Table S15. Gene #51: '6q loss' versus Clinical Feature #5: 'HISTOLOGICAL.TYPE'
| nPatients | ASTROCYTOMA | OLIGOASTROCYTOMA | OLIGODENDROGLIOMA |
|---|---|---|---|
| ALL | 159 | 107 | 164 |
| 6Q LOSS MUTATED | 31 | 10 | 9 |
| 6Q LOSS WILD-TYPE | 128 | 97 | 155 |
Figure S15. Get High-res Image Gene #51: '6q loss' versus Clinical Feature #5: 'HISTOLOGICAL.TYPE'
P value = 0 (logrank test), Q value = 0
Table S16. Gene #58: '10p loss' versus Clinical Feature #1: 'Time to Death'
| nPatients | nDeath | Duration Range (Median), Month | |
|---|---|---|---|
| ALL | 427 | 75 | 0.0 - 211.2 (15.9) |
| 10P LOSS MUTATED | 68 | 32 | 0.1 - 134.3 (12.2) |
| 10P LOSS WILD-TYPE | 359 | 43 | 0.0 - 211.2 (16.4) |
Figure S16. Get High-res Image Gene #58: '10p loss' versus Clinical Feature #1: 'Time to Death'
P value = 3.81e-15 (Wilcoxon-test), Q value = 2.4e-12
Table S17. Gene #58: '10p loss' versus Clinical Feature #2: 'AGE'
| nPatients | Mean (Std.Dev) | |
|---|---|---|
| ALL | 429 | 43.0 (13.2) |
| 10P LOSS MUTATED | 68 | 55.0 (11.5) |
| 10P LOSS WILD-TYPE | 361 | 40.7 (12.3) |
Figure S17. Get High-res Image Gene #58: '10p loss' versus Clinical Feature #2: 'AGE'

P value = 6e-05 (Fisher's exact test), Q value = 0.036
Table S18. Gene #58: '10p loss' versus Clinical Feature #5: 'HISTOLOGICAL.TYPE'
| nPatients | ASTROCYTOMA | OLIGOASTROCYTOMA | OLIGODENDROGLIOMA |
|---|---|---|---|
| ALL | 159 | 107 | 164 |
| 10P LOSS MUTATED | 41 | 13 | 14 |
| 10P LOSS WILD-TYPE | 118 | 94 | 150 |
Figure S18. Get High-res Image Gene #58: '10p loss' versus Clinical Feature #5: 'HISTOLOGICAL.TYPE'
P value = 4.77e-15 (logrank test), Q value = 3e-12
Table S19. Gene #59: '10q loss' versus Clinical Feature #1: 'Time to Death'
| nPatients | nDeath | Duration Range (Median), Month | |
|---|---|---|---|
| ALL | 427 | 75 | 0.0 - 211.2 (15.9) |
| 10Q LOSS MUTATED | 80 | 37 | 0.1 - 156.2 (13.0) |
| 10Q LOSS WILD-TYPE | 347 | 38 | 0.0 - 211.2 (16.5) |
Figure S19. Get High-res Image Gene #59: '10q loss' versus Clinical Feature #1: 'Time to Death'
P value = 1.37e-13 (Wilcoxon-test), Q value = 8.4e-11
Table S20. Gene #59: '10q loss' versus Clinical Feature #2: 'AGE'
| nPatients | Mean (Std.Dev) | |
|---|---|---|
| ALL | 429 | 43.0 (13.2) |
| 10Q LOSS MUTATED | 80 | 53.0 (12.5) |
| 10Q LOSS WILD-TYPE | 349 | 40.7 (12.3) |
Figure S20. Get High-res Image Gene #59: '10q loss' versus Clinical Feature #2: 'AGE'
P value = 3e-05 (Fisher's exact test), Q value = 0.018
Table S21. Gene #59: '10q loss' versus Clinical Feature #5: 'HISTOLOGICAL.TYPE'
| nPatients | ASTROCYTOMA | OLIGOASTROCYTOMA | OLIGODENDROGLIOMA |
|---|---|---|---|
| ALL | 159 | 107 | 164 |
| 10Q LOSS MUTATED | 48 | 15 | 17 |
| 10Q LOSS WILD-TYPE | 111 | 92 | 147 |
Figure S21. Get High-res Image Gene #59: '10q loss' versus Clinical Feature #5: 'HISTOLOGICAL.TYPE'
P value = 4.3e-06 (logrank test), Q value = 0.0026
Table S22. Gene #65: '14q loss' versus Clinical Feature #1: 'Time to Death'
| nPatients | nDeath | Duration Range (Median), Month | |
|---|---|---|---|
| ALL | 427 | 75 | 0.0 - 211.2 (15.9) |
| 14Q LOSS MUTATED | 63 | 22 | 0.1 - 130.8 (15.5) |
| 14Q LOSS WILD-TYPE | 364 | 53 | 0.0 - 211.2 (16.0) |
Figure S22. Get High-res Image Gene #65: '14q loss' versus Clinical Feature #1: 'Time to Death'
P value = 0.000162 (Wilcoxon-test), Q value = 0.096
Table S23. Gene #65: '14q loss' versus Clinical Feature #2: 'AGE'
| nPatients | Mean (Std.Dev) | |
|---|---|---|
| ALL | 429 | 43.0 (13.2) |
| 14Q LOSS MUTATED | 65 | 48.8 (13.0) |
| 14Q LOSS WILD-TYPE | 364 | 41.9 (13.0) |
Figure S23. Get High-res Image Gene #65: '14q loss' versus Clinical Feature #2: 'AGE'
P value = 0.000198 (Wilcoxon-test), Q value = 0.12
Table S24. Gene #67: '16p loss' versus Clinical Feature #2: 'AGE'
| nPatients | Mean (Std.Dev) | |
|---|---|---|
| ALL | 429 | 43.0 (13.2) |
| 16P LOSS MUTATED | 11 | 58.5 (10.3) |
| 16P LOSS WILD-TYPE | 418 | 42.6 (13.1) |
Figure S24. Get High-res Image Gene #67: '16p loss' versus Clinical Feature #2: 'AGE'
P value = 0.000259 (Wilcoxon-test), Q value = 0.15
Table S25. Gene #68: '16q loss' versus Clinical Feature #2: 'AGE'
| nPatients | Mean (Std.Dev) | |
|---|---|---|
| ALL | 429 | 43.0 (13.2) |
| 16Q LOSS MUTATED | 19 | 55.3 (14.3) |
| 16Q LOSS WILD-TYPE | 410 | 42.4 (12.9) |
Figure S25. Get High-res Image Gene #68: '16q loss' versus Clinical Feature #2: 'AGE'
P value = 1e-05 (Fisher's exact test), Q value = 0.0061
Table S26. Gene #74: '19q loss' versus Clinical Feature #5: 'HISTOLOGICAL.TYPE'
| nPatients | ASTROCYTOMA | OLIGOASTROCYTOMA | OLIGODENDROGLIOMA |
|---|---|---|---|
| ALL | 159 | 107 | 164 |
| 19Q LOSS MUTATED | 18 | 35 | 124 |
| 19Q LOSS WILD-TYPE | 141 | 72 | 40 |
Figure S26. Get High-res Image Gene #74: '19q loss' versus Clinical Feature #5: 'HISTOLOGICAL.TYPE'
P value = 2.92e-05 (logrank test), Q value = 0.018
Table S27. Gene #77: '22q loss' versus Clinical Feature #1: 'Time to Death'
| nPatients | nDeath | Duration Range (Median), Month | |
|---|---|---|---|
| ALL | 427 | 75 | 0.0 - 211.2 (15.9) |
| 22Q LOSS MUTATED | 46 | 18 | 0.1 - 156.2 (16.9) |
| 22Q LOSS WILD-TYPE | 381 | 57 | 0.0 - 211.2 (15.7) |
Figure S27. Get High-res Image Gene #77: '22q loss' versus Clinical Feature #1: 'Time to Death'
P value = 5.45e-05 (Wilcoxon-test), Q value = 0.033
Table S28. Gene #77: '22q loss' versus Clinical Feature #2: 'AGE'
| nPatients | Mean (Std.Dev) | |
|---|---|---|
| ALL | 429 | 43.0 (13.2) |
| 22Q LOSS MUTATED | 46 | 51.0 (13.9) |
| 22Q LOSS WILD-TYPE | 383 | 42.0 (12.9) |
Figure S28. Get High-res Image Gene #77: '22q loss' versus Clinical Feature #2: 'AGE'
-
Copy number data file = transformed.cor.cli.txt
-
Clinical data file = LGG-TP.merged_data.txt
-
Number of patients = 430
-
Number of significantly arm-level cnvs = 78
-
Number of selected clinical features = 8
-
Exclude regions that fewer than K tumors have mutations, K = 3
For survival clinical features, the Kaplan-Meier survival curves of tumors with and without gene mutations were plotted and the statistical significance P values were estimated by logrank test (Bland and Altman 2004) using the 'survdiff' function in R
For binary or multi-class clinical features (nominal or ordinal), two-tailed Fisher's exact tests (Fisher 1922) were used to estimate the P values using the 'fisher.test' function in R
For multiple hypothesis correction, Q value is the False Discovery Rate (FDR) analogue of the P value (Benjamini and Hochberg 1995), defined as the minimum FDR at which the test may be called significant. We used the 'Benjamini and Hochberg' method of 'p.adjust' function in R to convert P values into Q values.
In addition to the links below, the full results of the analysis summarized in this report can also be downloaded programmatically using firehose_get, or interactively from either the Broad GDAC website or TCGA Data Coordination Center Portal.