This pipeline computes the correlation between significant arm-level copy number variations (cnvs) and selected clinical features.
Testing the association between copy number variation 80 arm-level events and 8 clinical features across 571 patients, 12 significant findings detected with Q value < 0.25.
-
2p gain cnv correlated to 'AGE'.
-
3q gain cnv correlated to 'AGE'.
-
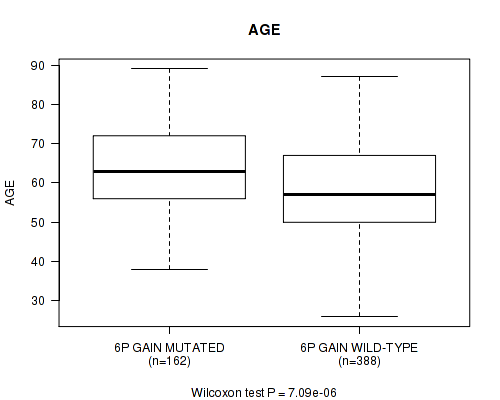
6p gain cnv correlated to 'AGE'.
-
6q gain cnv correlated to 'AGE'.
-
10p gain cnv correlated to 'AGE'.
-
12p gain cnv correlated to 'AGE'.
-
12q gain cnv correlated to 'AGE'.
-
20p gain cnv correlated to 'AGE'.
-
20q gain cnv correlated to 'AGE'.
-
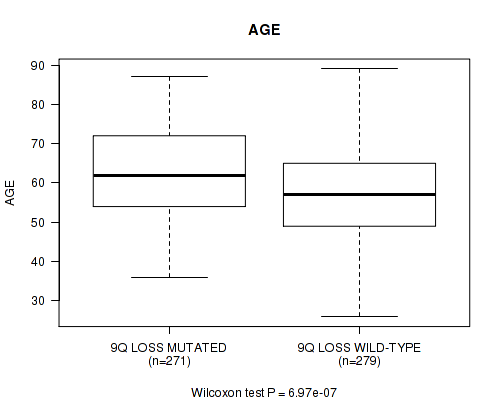
9q loss cnv correlated to 'AGE'.
-
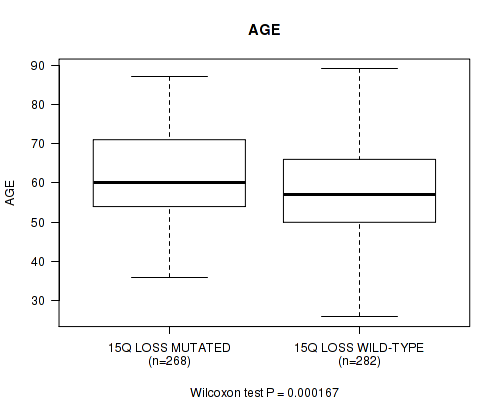
15q loss cnv correlated to 'AGE'.
-
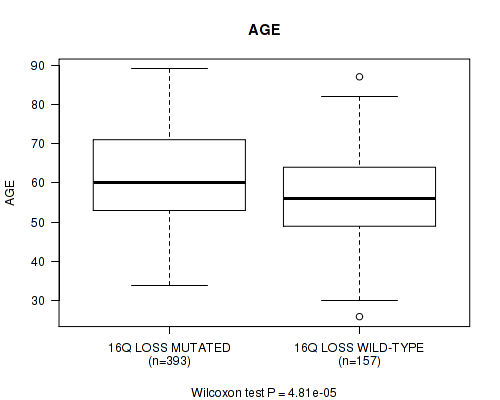
16q loss cnv correlated to 'AGE'.
Table 1. Get Full Table Overview of the association between significant copy number variation of 80 arm-level events and 8 clinical features. Shown in the table are P values (Q values). Thresholded by Q value < 0.25, 12 significant findings detected.
|
Clinical Features |
Time to Death |
AGE |
PRIMARY SITE OF DISEASE |
KARNOFSKY PERFORMANCE SCORE |
RADIATIONS RADIATION REGIMENINDICATION |
COMPLETENESS OF RESECTION |
RACE | ETHNICITY | ||
| nCNV (%) | nWild-Type | logrank test | Wilcoxon-test | Fisher's exact test | Wilcoxon-test | Fisher's exact test | Fisher's exact test | Fisher's exact test | Fisher's exact test | |
| 2p gain | 183 (32%) | 388 |
0.111 (1.00) |
3.39e-06 (0.00213) |
1 (1.00) |
0.6 (1.00) |
1 (1.00) |
0.829 (1.00) |
0.677 (1.00) |
1 (1.00) |
| 3q gain | 271 (47%) | 300 |
0.516 (1.00) |
2.29e-07 (0.000144) |
0.178 (1.00) |
0.978 (1.00) |
0.251 (1.00) |
0.508 (1.00) |
0.708 (1.00) |
0.521 (1.00) |
| 6p gain | 166 (29%) | 405 |
0.262 (1.00) |
7.09e-06 (0.00444) |
0.749 (1.00) |
0.113 (1.00) |
0.56 (1.00) |
1 (1.00) |
0.185 (1.00) |
0.729 (1.00) |
| 6q gain | 97 (17%) | 474 |
0.418 (1.00) |
0.000187 (0.116) |
1 (1.00) |
0.196 (1.00) |
1 (1.00) |
0.708 (1.00) |
0.201 (1.00) |
0.676 (1.00) |
| 10p gain | 185 (32%) | 386 |
0.465 (1.00) |
1.92e-08 (1.21e-05) |
0.106 (1.00) |
0.381 (1.00) |
0.246 (1.00) |
0.885 (1.00) |
0.487 (1.00) |
0.507 (1.00) |
| 12p gain | 253 (44%) | 318 |
0.384 (1.00) |
5.59e-10 (3.54e-07) |
0.348 (1.00) |
0.12 (1.00) |
1 (1.00) |
0.961 (1.00) |
0.501 (1.00) |
0.327 (1.00) |
| 12q gain | 175 (31%) | 396 |
0.177 (1.00) |
9.32e-08 (5.89e-05) |
0.0838 (1.00) |
0.018 (1.00) |
1 (1.00) |
0.207 (1.00) |
0.155 (1.00) |
0.462 (1.00) |
| 20p gain | 286 (50%) | 285 |
0.00921 (1.00) |
1.02e-06 (0.000639) |
0.75 (1.00) |
0.343 (1.00) |
1 (1.00) |
0.443 (1.00) |
0.228 (1.00) |
0.752 (1.00) |
| 20q gain | 324 (57%) | 247 |
0.0428 (1.00) |
4.14e-05 (0.0259) |
0.76 (1.00) |
0.309 (1.00) |
1 (1.00) |
0.508 (1.00) |
0.0164 (1.00) |
0.355 (1.00) |
| 9q loss | 285 (50%) | 286 |
0.429 (1.00) |
6.97e-07 (0.000439) |
0.493 (1.00) |
0.865 (1.00) |
0.624 (1.00) |
0.837 (1.00) |
0.577 (1.00) |
1 (1.00) |
| 15q loss | 276 (48%) | 295 |
0.51 (1.00) |
0.000167 (0.104) |
0.486 (1.00) |
0.586 (1.00) |
0.612 (1.00) |
0.757 (1.00) |
0.553 (1.00) |
0.524 (1.00) |
| 16q loss | 408 (71%) | 163 |
0.12 (1.00) |
4.81e-05 (0.0301) |
0.748 (1.00) |
0.0859 (1.00) |
0.562 (1.00) |
0.532 (1.00) |
0.901 (1.00) |
0.157 (1.00) |
| 1p gain | 167 (29%) | 404 |
0.183 (1.00) |
0.0765 (1.00) |
0.333 (1.00) |
0.244 (1.00) |
0.206 (1.00) |
0.273 (1.00) |
0.847 (1.00) |
0.461 (1.00) |
| 1q gain | 218 (38%) | 353 |
0.537 (1.00) |
0.000758 (0.47) |
0.262 (1.00) |
0.121 (1.00) |
1 (1.00) |
0.756 (1.00) |
0.572 (1.00) |
0.741 (1.00) |
| 2q gain | 152 (27%) | 419 |
0.126 (1.00) |
0.000717 (0.445) |
1 (1.00) |
0.721 (1.00) |
0.174 (1.00) |
1 (1.00) |
0.446 (1.00) |
0.707 (1.00) |
| 3p gain | 160 (28%) | 411 |
0.711 (1.00) |
0.00398 (1.00) |
0.731 (1.00) |
0.368 (1.00) |
0.563 (1.00) |
0.467 (1.00) |
0.311 (1.00) |
1 (1.00) |
| 4p gain | 59 (10%) | 512 |
0.0411 (1.00) |
0.0291 (1.00) |
0.354 (1.00) |
0.195 (1.00) |
0.279 (1.00) |
0.361 (1.00) |
0.453 (1.00) |
0.257 (1.00) |
| 4q gain | 32 (6%) | 539 |
0.0645 (1.00) |
0.047 (1.00) |
1 (1.00) |
0.18 (1.00) |
0.159 (1.00) |
0.519 (1.00) |
0.464 (1.00) |
|
| 5p gain | 195 (34%) | 376 |
0.446 (1.00) |
0.00701 (1.00) |
0.114 (1.00) |
0.322 (1.00) |
1 (1.00) |
0.0379 (1.00) |
0.441 (1.00) |
1 (1.00) |
| 5q gain | 59 (10%) | 512 |
0.923 (1.00) |
0.21 (1.00) |
0.348 (1.00) |
0.16 (1.00) |
1 (1.00) |
0.137 (1.00) |
0.91 (1.00) |
1 (1.00) |
| 7p gain | 178 (31%) | 393 |
0.939 (1.00) |
0.000763 (0.471) |
0.775 (1.00) |
0.119 (1.00) |
0.556 (1.00) |
0.803 (1.00) |
0.0333 (1.00) |
0.177 (1.00) |
| 7q gain | 198 (35%) | 373 |
0.476 (1.00) |
0.00187 (1.00) |
0.797 (1.00) |
0.137 (1.00) |
0.555 (1.00) |
0.961 (1.00) |
0.0411 (1.00) |
1 (1.00) |
| 8p gain | 117 (20%) | 454 |
0.921 (1.00) |
0.809 (1.00) |
0.607 (1.00) |
0.804 (1.00) |
0.498 (1.00) |
0.493 (1.00) |
0.506 (1.00) |
1 (1.00) |
| 8q gain | 239 (42%) | 332 |
0.394 (1.00) |
0.113 (1.00) |
0.323 (1.00) |
0.729 (1.00) |
1 (1.00) |
0.122 (1.00) |
0.173 (1.00) |
0.527 (1.00) |
| 9p gain | 88 (15%) | 483 |
0.471 (1.00) |
0.861 (1.00) |
1 (1.00) |
0.264 (1.00) |
0.395 (1.00) |
1 (1.00) |
0.709 (1.00) |
0.369 (1.00) |
| 9q gain | 43 (8%) | 528 |
0.705 (1.00) |
0.212 (1.00) |
1 (1.00) |
0.508 (1.00) |
0.21 (1.00) |
1 (1.00) |
0.189 (1.00) |
1 (1.00) |
| 10q gain | 108 (19%) | 463 |
0.76 (1.00) |
0.000719 (0.446) |
0.167 (1.00) |
0.852 (1.00) |
1 (1.00) |
0.739 (1.00) |
0.697 (1.00) |
1 (1.00) |
| 11p gain | 76 (13%) | 495 |
0.0956 (1.00) |
0.692 (1.00) |
1 (1.00) |
0.47 (1.00) |
0.349 (1.00) |
0.448 (1.00) |
0.335 (1.00) |
1 (1.00) |
| 11q gain | 112 (20%) | 459 |
0.897 (1.00) |
0.776 (1.00) |
1 (1.00) |
0.651 (1.00) |
1 (1.00) |
0.317 (1.00) |
1 (1.00) |
0.219 (1.00) |
| 13q gain | 59 (10%) | 512 |
0.676 (1.00) |
0.016 (1.00) |
1 (1.00) |
0.178 (1.00) |
0.279 (1.00) |
0.813 (1.00) |
0.62 (1.00) |
0.611 (1.00) |
| 14q gain | 58 (10%) | 513 |
0.0667 (1.00) |
0.215 (1.00) |
1 (1.00) |
0.813 (1.00) |
0.0285 (1.00) |
0.864 (1.00) |
0.909 (1.00) |
0.608 (1.00) |
| 15q gain | 39 (7%) | 532 |
0.162 (1.00) |
0.915 (1.00) |
1 (1.00) |
0.114 (1.00) |
1 (1.00) |
1 (1.00) |
1 (1.00) |
|
| 16p gain | 59 (10%) | 512 |
0.865 (1.00) |
0.188 (1.00) |
1 (1.00) |
0.0439 (1.00) |
1 (1.00) |
0.118 (1.00) |
0.912 (1.00) |
1 (1.00) |
| 16q gain | 31 (5%) | 540 |
0.771 (1.00) |
0.955 (1.00) |
1 (1.00) |
0.147 (1.00) |
1 (1.00) |
0.18 (1.00) |
0.801 (1.00) |
1 (1.00) |
| 17p gain | 22 (4%) | 549 |
0.168 (1.00) |
0.447 (1.00) |
1 (1.00) |
0.961 (1.00) |
1 (1.00) |
0.37 (1.00) |
1 (1.00) |
|
| 17q gain | 47 (8%) | 524 |
0.633 (1.00) |
0.443 (1.00) |
1 (1.00) |
0.487 (1.00) |
1 (1.00) |
0.0901 (1.00) |
0.386 (1.00) |
1 (1.00) |
| 18p gain | 119 (21%) | 452 |
0.135 (1.00) |
0.0357 (1.00) |
1 (1.00) |
0.916 (1.00) |
1 (1.00) |
0.629 (1.00) |
0.955 (1.00) |
1 (1.00) |
| 18q gain | 72 (13%) | 499 |
0.31 (1.00) |
0.497 (1.00) |
1 (1.00) |
0.967 (1.00) |
1 (1.00) |
0.861 (1.00) |
0.72 (1.00) |
0.615 (1.00) |
| 19p gain | 168 (29%) | 403 |
0.355 (1.00) |
0.0706 (1.00) |
0.752 (1.00) |
0.66 (1.00) |
0.208 (1.00) |
0.424 (1.00) |
0.253 (1.00) |
0.729 (1.00) |
| 19q gain | 160 (28%) | 411 |
0.793 (1.00) |
0.0137 (1.00) |
0.152 (1.00) |
0.837 (1.00) |
0.191 (1.00) |
0.425 (1.00) |
0.0296 (1.00) |
0.734 (1.00) |
| 21q gain | 109 (19%) | 462 |
0.987 (1.00) |
0.00105 (0.65) |
0.0718 (1.00) |
0.368 (1.00) |
1 (1.00) |
0.524 (1.00) |
0.722 (1.00) |
0.686 (1.00) |
| 22q gain | 24 (4%) | 547 |
0.156 (1.00) |
0.684 (1.00) |
0.163 (1.00) |
0.439 (1.00) |
1 (1.00) |
1 (1.00) |
0.648 (1.00) |
1 (1.00) |
| xq gain | 105 (18%) | 466 |
0.579 (1.00) |
0.15 (1.00) |
0.0678 (1.00) |
0.506 (1.00) |
1 (1.00) |
0.74 (1.00) |
0.858 (1.00) |
1 (1.00) |
| 1p loss | 64 (11%) | 507 |
0.912 (1.00) |
0.285 (1.00) |
1 (1.00) |
0.126 (1.00) |
0.3 (1.00) |
0.864 (1.00) |
0.486 (1.00) |
0.304 (1.00) |
| 1q loss | 43 (8%) | 528 |
0.681 (1.00) |
0.403 (1.00) |
1 (1.00) |
0.161 (1.00) |
0.21 (1.00) |
0.737 (1.00) |
0.292 (1.00) |
0.529 (1.00) |
| 2p loss | 53 (9%) | 518 |
0.798 (1.00) |
0.497 (1.00) |
1 (1.00) |
0.145 (1.00) |
1 (1.00) |
0.948 (1.00) |
0.608 (1.00) |
|
| 2q loss | 59 (10%) | 512 |
0.843 (1.00) |
0.0185 (1.00) |
0.353 (1.00) |
0.481 (1.00) |
1 (1.00) |
0.661 (1.00) |
0.907 (1.00) |
0.609 (1.00) |
| 3p loss | 93 (16%) | 478 |
0.999 (1.00) |
0.0109 (1.00) |
0.516 (1.00) |
0.473 (1.00) |
0.414 (1.00) |
0.242 (1.00) |
0.364 (1.00) |
1 (1.00) |
| 3q loss | 43 (8%) | 528 |
0.306 (1.00) |
0.125 (1.00) |
0.275 (1.00) |
0.784 (1.00) |
0.21 (1.00) |
0.759 (1.00) |
0.545 (1.00) |
|
| 4p loss | 312 (55%) | 259 |
0.641 (1.00) |
0.8 (1.00) |
0.169 (1.00) |
0.317 (1.00) |
1 (1.00) |
0.757 (1.00) |
0.609 (1.00) |
1 (1.00) |
| 4q loss | 358 (63%) | 213 |
0.504 (1.00) |
0.839 (1.00) |
0.78 (1.00) |
0.906 (1.00) |
1 (1.00) |
0.799 (1.00) |
0.549 (1.00) |
0.326 (1.00) |
| 5p loss | 131 (23%) | 440 |
0.778 (1.00) |
0.0236 (1.00) |
0.652 (1.00) |
0.0267 (1.00) |
1 (1.00) |
0.103 (1.00) |
0.844 (1.00) |
0.705 (1.00) |
| 5q loss | 221 (39%) | 350 |
0.508 (1.00) |
0.0143 (1.00) |
1 (1.00) |
0.0339 (1.00) |
1 (1.00) |
0.162 (1.00) |
0.937 (1.00) |
0.526 (1.00) |
| 6p loss | 163 (29%) | 408 |
0.314 (1.00) |
0.0732 (1.00) |
0.738 (1.00) |
0.913 (1.00) |
1 (1.00) |
0.309 (1.00) |
0.549 (1.00) |
0.729 (1.00) |
| 6q loss | 238 (42%) | 333 |
0.593 (1.00) |
0.062 (1.00) |
0.148 (1.00) |
0.753 (1.00) |
1 (1.00) |
0.408 (1.00) |
0.103 (1.00) |
0.524 (1.00) |
| 7p loss | 120 (21%) | 451 |
0.917 (1.00) |
0.897 (1.00) |
0.614 (1.00) |
0.0798 (1.00) |
1 (1.00) |
0.393 (1.00) |
0.758 (1.00) |
0.694 (1.00) |
| 7q loss | 81 (14%) | 490 |
0.297 (1.00) |
0.216 (1.00) |
0.468 (1.00) |
0.114 (1.00) |
0.369 (1.00) |
0.548 (1.00) |
0.343 (1.00) |
0.371 (1.00) |
| 8p loss | 273 (48%) | 298 |
0.121 (1.00) |
0.0284 (1.00) |
0.174 (1.00) |
0.142 (1.00) |
1 (1.00) |
0.393 (1.00) |
0.782 (1.00) |
0.522 (1.00) |
| 8q loss | 89 (16%) | 482 |
0.147 (1.00) |
0.00338 (1.00) |
1 (1.00) |
0.295 (1.00) |
1 (1.00) |
0.435 (1.00) |
0.675 (1.00) |
0.645 (1.00) |
| 9p loss | 262 (46%) | 309 |
0.756 (1.00) |
0.012 (1.00) |
0.456 (1.00) |
0.64 (1.00) |
0.596 (1.00) |
0.169 (1.00) |
0.671 (1.00) |
0.526 (1.00) |
| 10p loss | 96 (17%) | 475 |
0.62 (1.00) |
0.143 (1.00) |
1 (1.00) |
0.678 (1.00) |
0.425 (1.00) |
0.543 (1.00) |
0.383 (1.00) |
1 (1.00) |
| 10q loss | 124 (22%) | 447 |
0.771 (1.00) |
0.0828 (1.00) |
0.621 (1.00) |
0.983 (1.00) |
0.01 (1.00) |
0.892 (1.00) |
0.501 (1.00) |
0.693 (1.00) |
| 11p loss | 196 (34%) | 375 |
0.842 (1.00) |
0.00292 (1.00) |
1 (1.00) |
0.603 (1.00) |
1 (1.00) |
0.756 (1.00) |
0.36 (1.00) |
0.73 (1.00) |
| 11q loss | 148 (26%) | 423 |
0.55 (1.00) |
0.0141 (1.00) |
0.277 (1.00) |
0.0905 (1.00) |
1 (1.00) |
0.825 (1.00) |
0.483 (1.00) |
0.707 (1.00) |
| 12p loss | 78 (14%) | 493 |
0.912 (1.00) |
0.0756 (1.00) |
1 (1.00) |
0.698 (1.00) |
1 (1.00) |
1 (1.00) |
0.24 (1.00) |
1 (1.00) |
| 12q loss | 103 (18%) | 468 |
0.418 (1.00) |
0.342 (1.00) |
1 (1.00) |
0.376 (1.00) |
1 (1.00) |
0.625 (1.00) |
0.795 (1.00) |
1 (1.00) |
| 13q loss | 305 (53%) | 266 |
0.537 (1.00) |
0.582 (1.00) |
0.749 (1.00) |
0.813 (1.00) |
0.6 (1.00) |
0.724 (1.00) |
0.5 (1.00) |
0.523 (1.00) |
| 14q loss | 212 (37%) | 359 |
0.485 (1.00) |
0.000696 (0.433) |
0.78 (1.00) |
0.752 (1.00) |
0.298 (1.00) |
0.538 (1.00) |
0.437 (1.00) |
0.186 (1.00) |
| 16p loss | 330 (58%) | 241 |
0.492 (1.00) |
0.161 (1.00) |
0.76 (1.00) |
0.908 (1.00) |
0.267 (1.00) |
0.901 (1.00) |
0.483 (1.00) |
0.0979 (1.00) |
| 17p loss | 473 (83%) | 98 |
0.89 (1.00) |
0.327 (1.00) |
0.531 (1.00) |
0.896 (1.00) |
0.432 (1.00) |
0.392 (1.00) |
0.762 (1.00) |
0.383 (1.00) |
| 17q loss | 379 (66%) | 192 |
0.851 (1.00) |
0.58 (1.00) |
0.8 (1.00) |
0.00916 (1.00) |
0.554 (1.00) |
0.468 (1.00) |
0.717 (1.00) |
0.0953 (1.00) |
| 18p loss | 231 (40%) | 340 |
0.0751 (1.00) |
0.968 (1.00) |
0.763 (1.00) |
0.44 (1.00) |
0.0657 (1.00) |
0.364 (1.00) |
0.0346 (1.00) |
1 (1.00) |
| 18q loss | 289 (51%) | 282 |
0.128 (1.00) |
0.311 (1.00) |
0.491 (1.00) |
0.416 (1.00) |
0.249 (1.00) |
0.264 (1.00) |
0.104 (1.00) |
0.214 (1.00) |
| 19p loss | 184 (32%) | 387 |
0.268 (1.00) |
0.0344 (1.00) |
0.196 (1.00) |
0.296 (1.00) |
0.555 (1.00) |
0.307 (1.00) |
0.571 (1.00) |
0.734 (1.00) |
| 19q loss | 176 (31%) | 395 |
0.994 (1.00) |
0.503 (1.00) |
0.18 (1.00) |
0.0518 (1.00) |
0.556 (1.00) |
0.16 (1.00) |
0.547 (1.00) |
0.511 (1.00) |
| 20p loss | 49 (9%) | 522 |
0.0554 (1.00) |
0.402 (1.00) |
1 (1.00) |
0.383 (1.00) |
0.236 (1.00) |
0.0821 (1.00) |
0.762 (1.00) |
0.246 (1.00) |
| 20q loss | 32 (6%) | 539 |
0.137 (1.00) |
0.872 (1.00) |
1 (1.00) |
0.439 (1.00) |
1 (1.00) |
1 (1.00) |
0.481 (1.00) |
|
| 21q loss | 194 (34%) | 377 |
0.809 (1.00) |
0.315 (1.00) |
0.405 (1.00) |
0.127 (1.00) |
1 (1.00) |
1 (1.00) |
0.302 (1.00) |
0.752 (1.00) |
| 22q loss | 427 (75%) | 144 |
0.234 (1.00) |
0.081 (1.00) |
0.266 (1.00) |
0.371 (1.00) |
0.576 (1.00) |
0.0394 (1.00) |
1 (1.00) |
1 (1.00) |
| xq loss | 274 (48%) | 297 |
0.807 (1.00) |
0.00184 (1.00) |
0.75 (1.00) |
0.273 (1.00) |
0.11 (1.00) |
0.557 (1.00) |
0.115 (1.00) |
0.757 (1.00) |
P value = 3.39e-06 (Wilcoxon-test), Q value = 0.0021
Table S1. Gene #3: '2p gain' versus Clinical Feature #2: 'AGE'
| nPatients | Mean (Std.Dev) | |
|---|---|---|
| ALL | 550 | 59.8 (11.6) |
| 2P GAIN MUTATED | 174 | 63.3 (11.3) |
| 2P GAIN WILD-TYPE | 376 | 58.2 (11.4) |
Figure S1. Get High-res Image Gene #3: '2p gain' versus Clinical Feature #2: 'AGE'

P value = 2.29e-07 (Wilcoxon-test), Q value = 0.00014
Table S2. Gene #6: '3q gain' versus Clinical Feature #2: 'AGE'
| nPatients | Mean (Std.Dev) | |
|---|---|---|
| ALL | 550 | 59.8 (11.6) |
| 3Q GAIN MUTATED | 264 | 62.5 (11.1) |
| 3Q GAIN WILD-TYPE | 286 | 57.4 (11.5) |
Figure S2. Get High-res Image Gene #6: '3q gain' versus Clinical Feature #2: 'AGE'

P value = 7.09e-06 (Wilcoxon-test), Q value = 0.0044
Table S3. Gene #11: '6p gain' versus Clinical Feature #2: 'AGE'
| nPatients | Mean (Std.Dev) | |
|---|---|---|
| ALL | 550 | 59.8 (11.6) |
| 6P GAIN MUTATED | 162 | 63.2 (11.0) |
| 6P GAIN WILD-TYPE | 388 | 58.4 (11.6) |
Figure S3. Get High-res Image Gene #11: '6p gain' versus Clinical Feature #2: 'AGE'
P value = 0.000187 (Wilcoxon-test), Q value = 0.12
Table S4. Gene #12: '6q gain' versus Clinical Feature #2: 'AGE'
| nPatients | Mean (Std.Dev) | |
|---|---|---|
| ALL | 550 | 59.8 (11.6) |
| 6Q GAIN MUTATED | 93 | 63.8 (10.6) |
| 6Q GAIN WILD-TYPE | 457 | 59.0 (11.6) |
Figure S4. Get High-res Image Gene #12: '6q gain' versus Clinical Feature #2: 'AGE'

P value = 1.92e-08 (Wilcoxon-test), Q value = 1.2e-05
Table S5. Gene #19: '10p gain' versus Clinical Feature #2: 'AGE'
| nPatients | Mean (Std.Dev) | |
|---|---|---|
| ALL | 550 | 59.8 (11.6) |
| 10P GAIN MUTATED | 179 | 63.7 (10.9) |
| 10P GAIN WILD-TYPE | 371 | 57.9 (11.5) |
Figure S5. Get High-res Image Gene #19: '10p gain' versus Clinical Feature #2: 'AGE'

P value = 5.59e-10 (Wilcoxon-test), Q value = 3.5e-07
Table S6. Gene #23: '12p gain' versus Clinical Feature #2: 'AGE'
| nPatients | Mean (Std.Dev) | |
|---|---|---|
| ALL | 550 | 59.8 (11.6) |
| 12P GAIN MUTATED | 240 | 63.3 (11.1) |
| 12P GAIN WILD-TYPE | 310 | 57.1 (11.2) |
Figure S6. Get High-res Image Gene #23: '12p gain' versus Clinical Feature #2: 'AGE'

P value = 9.32e-08 (Wilcoxon-test), Q value = 5.9e-05
Table S7. Gene #24: '12q gain' versus Clinical Feature #2: 'AGE'
| nPatients | Mean (Std.Dev) | |
|---|---|---|
| ALL | 550 | 59.8 (11.6) |
| 12Q GAIN MUTATED | 165 | 63.8 (10.4) |
| 12Q GAIN WILD-TYPE | 385 | 58.1 (11.7) |
Figure S7. Get High-res Image Gene #24: '12q gain' versus Clinical Feature #2: 'AGE'

P value = 1.02e-06 (Wilcoxon-test), Q value = 0.00064
Table S8. Gene #36: '20p gain' versus Clinical Feature #2: 'AGE'
| nPatients | Mean (Std.Dev) | |
|---|---|---|
| ALL | 550 | 59.8 (11.6) |
| 20P GAIN MUTATED | 277 | 62.2 (11.6) |
| 20P GAIN WILD-TYPE | 273 | 57.4 (11.1) |
Figure S8. Get High-res Image Gene #36: '20p gain' versus Clinical Feature #2: 'AGE'

P value = 4.14e-05 (Wilcoxon-test), Q value = 0.026
Table S9. Gene #37: '20q gain' versus Clinical Feature #2: 'AGE'
| nPatients | Mean (Std.Dev) | |
|---|---|---|
| ALL | 550 | 59.8 (11.6) |
| 20Q GAIN MUTATED | 313 | 61.6 (11.8) |
| 20Q GAIN WILD-TYPE | 237 | 57.4 (10.9) |
Figure S9. Get High-res Image Gene #37: '20q gain' versus Clinical Feature #2: 'AGE'

P value = 6.97e-07 (Wilcoxon-test), Q value = 0.00044
Table S10. Gene #58: '9q loss' versus Clinical Feature #2: 'AGE'
| nPatients | Mean (Std.Dev) | |
|---|---|---|
| ALL | 550 | 59.8 (11.6) |
| 9Q LOSS MUTATED | 271 | 62.4 (11.3) |
| 9Q LOSS WILD-TYPE | 279 | 57.4 (11.3) |
Figure S10. Get High-res Image Gene #58: '9q loss' versus Clinical Feature #2: 'AGE'
P value = 0.000167 (Wilcoxon-test), Q value = 0.1
Table S11. Gene #67: '15q loss' versus Clinical Feature #2: 'AGE'
| nPatients | Mean (Std.Dev) | |
|---|---|---|
| ALL | 550 | 59.8 (11.6) |
| 15Q LOSS MUTATED | 268 | 61.7 (11.3) |
| 15Q LOSS WILD-TYPE | 282 | 58.0 (11.6) |
Figure S11. Get High-res Image Gene #67: '15q loss' versus Clinical Feature #2: 'AGE'
P value = 4.81e-05 (Wilcoxon-test), Q value = 0.03
Table S12. Gene #69: '16q loss' versus Clinical Feature #2: 'AGE'
| nPatients | Mean (Std.Dev) | |
|---|---|---|
| ALL | 550 | 59.8 (11.6) |
| 16Q LOSS MUTATED | 393 | 61.2 (11.4) |
| 16Q LOSS WILD-TYPE | 157 | 56.5 (11.5) |
Figure S12. Get High-res Image Gene #69: '16q loss' versus Clinical Feature #2: 'AGE'
-
Copy number data file = transformed.cor.cli.txt
-
Clinical data file = OV-TP.merged_data.txt
-
Number of patients = 571
-
Number of significantly arm-level cnvs = 80
-
Number of selected clinical features = 8
-
Exclude regions that fewer than K tumors have mutations, K = 3
For survival clinical features, the Kaplan-Meier survival curves of tumors with and without gene mutations were plotted and the statistical significance P values were estimated by logrank test (Bland and Altman 2004) using the 'survdiff' function in R
For binary or multi-class clinical features (nominal or ordinal), two-tailed Fisher's exact tests (Fisher 1922) were used to estimate the P values using the 'fisher.test' function in R
For multiple hypothesis correction, Q value is the False Discovery Rate (FDR) analogue of the P value (Benjamini and Hochberg 1995), defined as the minimum FDR at which the test may be called significant. We used the 'Benjamini and Hochberg' method of 'p.adjust' function in R to convert P values into Q values.
In addition to the links below, the full results of the analysis summarized in this report can also be downloaded programmatically using firehose_get, or interactively from either the Broad GDAC website or TCGA Data Coordination Center Portal.