This pipeline computes the correlation between significant arm-level copy number variations (cnvs) and molecular subtypes.
Testing the association between copy number variation 77 arm-level events and 8 molecular subtypes across 56 patients, one significant finding detected with P value < 0.05 and Q value < 0.25.
-
4q loss cnv correlated to 'MIRSEQ_CNMF'.
Table 1. Get Full Table Overview of the association between significant copy number variation of 77 arm-level events and 8 molecular subtypes. Shown in the table are P values (Q values). Thresholded by P value < 0.05 and Q value < 0.25, one significant finding detected.
|
Clinical Features |
CN CNMF |
METHLYATION CNMF |
MRNASEQ CNMF |
MRNASEQ CHIERARCHICAL |
MIRSEQ CNMF |
MIRSEQ CHIERARCHICAL |
MIRSEQ MATURE CNMF |
MIRSEQ MATURE CHIERARCHICAL |
||
| nCNV (%) | nWild-Type | Fisher's exact test | Fisher's exact test | Fisher's exact test | Fisher's exact test | Fisher's exact test | Fisher's exact test | Fisher's exact test | Fisher's exact test | |
| 4q loss | 33 (59%) | 23 |
0.186 (1.00) |
0.0185 (1.00) |
0.00495 (1.00) |
0.0398 (1.00) |
0.00015 (0.0924) |
0.248 (1.00) |
0.0198 (1.00) |
0.136 (1.00) |
| 1p gain | 24 (43%) | 32 |
0.202 (1.00) |
0.752 (1.00) |
0.819 (1.00) |
0.903 (1.00) |
0.525 (1.00) |
0.279 (1.00) |
0.608 (1.00) |
0.564 (1.00) |
| 1q gain | 31 (55%) | 25 |
0.442 (1.00) |
0.767 (1.00) |
0.763 (1.00) |
0.621 (1.00) |
0.707 (1.00) |
0.455 (1.00) |
0.884 (1.00) |
0.817 (1.00) |
| 2p gain | 23 (41%) | 33 |
0.889 (1.00) |
0.00746 (1.00) |
0.0191 (1.00) |
0.0566 (1.00) |
0.497 (1.00) |
0.071 (1.00) |
0.102 (1.00) |
0.134 (1.00) |
| 2q gain | 21 (38%) | 35 |
0.371 (1.00) |
0.0188 (1.00) |
0.0123 (1.00) |
0.113 (1.00) |
0.623 (1.00) |
0.0489 (1.00) |
0.197 (1.00) |
0.113 (1.00) |
| 3p gain | 12 (21%) | 44 |
0.213 (1.00) |
0.26 (1.00) |
0.436 (1.00) |
0.2 (1.00) |
0.859 (1.00) |
0.267 (1.00) |
0.455 (1.00) |
0.552 (1.00) |
| 3q gain | 23 (41%) | 33 |
0.0997 (1.00) |
0.0494 (1.00) |
0.195 (1.00) |
0.121 (1.00) |
0.493 (1.00) |
0.192 (1.00) |
0.0743 (1.00) |
0.22 (1.00) |
| 4p gain | 9 (16%) | 47 |
0.733 (1.00) |
0.7 (1.00) |
0.822 (1.00) |
0.866 (1.00) |
0.777 (1.00) |
0.327 (1.00) |
0.264 (1.00) |
0.371 (1.00) |
| 4q gain | 3 (5%) | 53 |
1 (1.00) |
0.258 (1.00) |
0.511 (1.00) |
0.794 (1.00) |
0.674 (1.00) |
0.568 (1.00) |
0.598 (1.00) |
0.697 (1.00) |
| 5p gain | 23 (41%) | 33 |
0.0438 (1.00) |
0.376 (1.00) |
0.453 (1.00) |
0.245 (1.00) |
0.741 (1.00) |
0.0285 (1.00) |
0.595 (1.00) |
0.151 (1.00) |
| 5q gain | 8 (14%) | 48 |
0.507 (1.00) |
0.566 (1.00) |
0.307 (1.00) |
0.248 (1.00) |
0.0794 (1.00) |
0.154 (1.00) |
0.129 (1.00) |
0.191 (1.00) |
| 6p gain | 30 (54%) | 26 |
0.195 (1.00) |
0.522 (1.00) |
0.601 (1.00) |
0.413 (1.00) |
1 (1.00) |
0.472 (1.00) |
0.737 (1.00) |
0.325 (1.00) |
| 6q gain | 27 (48%) | 29 |
0.21 (1.00) |
0.207 (1.00) |
0.223 (1.00) |
0.166 (1.00) |
1 (1.00) |
0.188 (1.00) |
0.651 (1.00) |
0.136 (1.00) |
| 7p gain | 21 (38%) | 35 |
0.2 (1.00) |
0.554 (1.00) |
0.15 (1.00) |
0.28 (1.00) |
0.592 (1.00) |
0.128 (1.00) |
0.33 (1.00) |
0.121 (1.00) |
| 7q gain | 17 (30%) | 39 |
0.585 (1.00) |
0.839 (1.00) |
0.341 (1.00) |
0.812 (1.00) |
0.743 (1.00) |
0.165 (1.00) |
1 (1.00) |
0.155 (1.00) |
| 8p gain | 19 (34%) | 37 |
0.187 (1.00) |
0.744 (1.00) |
0.442 (1.00) |
0.875 (1.00) |
0.971 (1.00) |
0.561 (1.00) |
0.663 (1.00) |
0.596 (1.00) |
| 8q gain | 30 (54%) | 26 |
0.0139 (1.00) |
0.199 (1.00) |
0.0502 (1.00) |
0.506 (1.00) |
0.216 (1.00) |
0.327 (1.00) |
0.0671 (1.00) |
0.122 (1.00) |
| 9p gain | 6 (11%) | 50 |
0.352 (1.00) |
0.705 (1.00) |
0.936 (1.00) |
0.666 (1.00) |
0.831 (1.00) |
0.805 (1.00) |
0.86 (1.00) |
1 (1.00) |
| 10p gain | 21 (38%) | 35 |
0.328 (1.00) |
0.0209 (1.00) |
0.0396 (1.00) |
0.119 (1.00) |
0.324 (1.00) |
0.107 (1.00) |
0.676 (1.00) |
0.198 (1.00) |
| 10q gain | 17 (30%) | 39 |
0.874 (1.00) |
0.339 (1.00) |
0.554 (1.00) |
0.048 (1.00) |
0.222 (1.00) |
0.184 (1.00) |
0.381 (1.00) |
0.0729 (1.00) |
| 11p gain | 5 (9%) | 51 |
0.722 (1.00) |
0.446 (1.00) |
0.265 (1.00) |
0.852 (1.00) |
0.494 (1.00) |
0.118 (1.00) |
0.522 (1.00) |
0.0928 (1.00) |
| 11q gain | 7 (12%) | 49 |
0.684 (1.00) |
0.385 (1.00) |
0.229 (1.00) |
0.384 (1.00) |
0.755 (1.00) |
0.0351 (1.00) |
0.576 (1.00) |
0.0302 (1.00) |
| 12p gain | 22 (39%) | 34 |
0.265 (1.00) |
0.00378 (1.00) |
0.374 (1.00) |
0.0424 (1.00) |
0.81 (1.00) |
0.976 (1.00) |
0.531 (1.00) |
0.626 (1.00) |
| 12q gain | 11 (20%) | 45 |
0.538 (1.00) |
0.535 (1.00) |
0.808 (1.00) |
0.523 (1.00) |
1 (1.00) |
0.296 (1.00) |
0.91 (1.00) |
0.273 (1.00) |
| 13q gain | 15 (27%) | 41 |
0.646 (1.00) |
0.0707 (1.00) |
0.0218 (1.00) |
0.024 (1.00) |
0.222 (1.00) |
0.0456 (1.00) |
0.0104 (1.00) |
0.14 (1.00) |
| 14q gain | 7 (12%) | 49 |
0.609 (1.00) |
0.576 (1.00) |
0.259 (1.00) |
0.258 (1.00) |
0.209 (1.00) |
0.733 (1.00) |
0.226 (1.00) |
0.475 (1.00) |
| 15q gain | 4 (7%) | 52 |
0.189 (1.00) |
0.256 (1.00) |
0.577 (1.00) |
0.324 (1.00) |
0.757 (1.00) |
0.348 (1.00) |
0.423 (1.00) |
0.359 (1.00) |
| 16p gain | 10 (18%) | 46 |
0.111 (1.00) |
0.279 (1.00) |
0.197 (1.00) |
0.276 (1.00) |
1 (1.00) |
0.483 (1.00) |
0.904 (1.00) |
0.405 (1.00) |
| 16q gain | 6 (11%) | 50 |
0.171 (1.00) |
0.849 (1.00) |
0.545 (1.00) |
0.968 (1.00) |
0.771 (1.00) |
0.925 (1.00) |
0.478 (1.00) |
0.868 (1.00) |
| 17p gain | 9 (16%) | 47 |
0.385 (1.00) |
0.898 (1.00) |
0.567 (1.00) |
0.562 (1.00) |
0.286 (1.00) |
0.0587 (1.00) |
0.128 (1.00) |
0.173 (1.00) |
| 17q gain | 18 (32%) | 38 |
0.426 (1.00) |
0.269 (1.00) |
0.701 (1.00) |
0.515 (1.00) |
0.396 (1.00) |
0.301 (1.00) |
0.759 (1.00) |
0.433 (1.00) |
| 18p gain | 18 (32%) | 38 |
0.676 (1.00) |
0.0496 (1.00) |
0.0938 (1.00) |
0.344 (1.00) |
0.147 (1.00) |
0.2 (1.00) |
0.409 (1.00) |
0.433 (1.00) |
| 18q gain | 14 (25%) | 42 |
0.687 (1.00) |
0.0814 (1.00) |
0.152 (1.00) |
0.24 (1.00) |
0.203 (1.00) |
0.0875 (1.00) |
0.14 (1.00) |
0.169 (1.00) |
| 19p gain | 24 (43%) | 32 |
0.116 (1.00) |
0.178 (1.00) |
0.271 (1.00) |
0.369 (1.00) |
0.533 (1.00) |
0.229 (1.00) |
0.419 (1.00) |
0.511 (1.00) |
| 19q gain | 28 (50%) | 28 |
0.125 (1.00) |
0.076 (1.00) |
0.378 (1.00) |
0.397 (1.00) |
0.929 (1.00) |
0.899 (1.00) |
0.885 (1.00) |
0.938 (1.00) |
| 20p gain | 37 (66%) | 19 |
0.288 (1.00) |
0.504 (1.00) |
0.923 (1.00) |
0.761 (1.00) |
0.874 (1.00) |
0.698 (1.00) |
0.223 (1.00) |
0.471 (1.00) |
| 20q gain | 44 (79%) | 12 |
0.0528 (1.00) |
0.917 (1.00) |
0.968 (1.00) |
0.997 (1.00) |
0.588 (1.00) |
0.576 (1.00) |
0.214 (1.00) |
0.679 (1.00) |
| 21q gain | 18 (32%) | 38 |
0.0741 (1.00) |
0.378 (1.00) |
0.902 (1.00) |
0.892 (1.00) |
0.915 (1.00) |
0.573 (1.00) |
1 (1.00) |
0.949 (1.00) |
| 22q gain | 8 (14%) | 48 |
0.712 (1.00) |
0.959 (1.00) |
0.803 (1.00) |
0.925 (1.00) |
0.888 (1.00) |
0.942 (1.00) |
1 (1.00) |
1 (1.00) |
| xq gain | 14 (25%) | 42 |
0.861 (1.00) |
0.425 (1.00) |
0.881 (1.00) |
0.822 (1.00) |
0.961 (1.00) |
0.581 (1.00) |
1 (1.00) |
0.238 (1.00) |
| 1p loss | 9 (16%) | 47 |
0.595 (1.00) |
0.604 (1.00) |
0.921 (1.00) |
0.119 (1.00) |
0.111 (1.00) |
0.0308 (1.00) |
0.0547 (1.00) |
0.0475 (1.00) |
| 1q loss | 9 (16%) | 47 |
0.482 (1.00) |
0.516 (1.00) |
0.515 (1.00) |
0.0785 (1.00) |
0.422 (1.00) |
0.155 (1.00) |
0.212 (1.00) |
0.143 (1.00) |
| 3p loss | 20 (36%) | 36 |
0.0106 (1.00) |
0.423 (1.00) |
0.05 (1.00) |
0.229 (1.00) |
0.375 (1.00) |
0.928 (1.00) |
0.418 (1.00) |
0.433 (1.00) |
| 3q loss | 14 (25%) | 42 |
0.14 (1.00) |
0.46 (1.00) |
0.137 (1.00) |
0.606 (1.00) |
0.529 (1.00) |
0.88 (1.00) |
0.381 (1.00) |
1 (1.00) |
| 4p loss | 31 (55%) | 25 |
0.0654 (1.00) |
0.0624 (1.00) |
0.257 (1.00) |
0.203 (1.00) |
0.038 (1.00) |
0.711 (1.00) |
0.146 (1.00) |
0.447 (1.00) |
| 5p loss | 9 (16%) | 47 |
0.9 (1.00) |
0.475 (1.00) |
0.885 (1.00) |
0.137 (1.00) |
1 (1.00) |
0.299 (1.00) |
1 (1.00) |
0.416 (1.00) |
| 5q loss | 18 (32%) | 38 |
0.767 (1.00) |
0.303 (1.00) |
0.265 (1.00) |
0.235 (1.00) |
0.36 (1.00) |
0.948 (1.00) |
0.357 (1.00) |
0.947 (1.00) |
| 6p loss | 5 (9%) | 51 |
0.424 (1.00) |
0.956 (1.00) |
0.756 (1.00) |
0.957 (1.00) |
0.542 (1.00) |
0.911 (1.00) |
1 (1.00) |
1 (1.00) |
| 6q loss | 7 (12%) | 49 |
0.0641 (1.00) |
0.7 (1.00) |
0.64 (1.00) |
0.901 (1.00) |
0.705 (1.00) |
0.619 (1.00) |
0.671 (1.00) |
0.614 (1.00) |
| 7p loss | 13 (23%) | 43 |
1 (1.00) |
0.666 (1.00) |
0.738 (1.00) |
0.503 (1.00) |
0.315 (1.00) |
0.452 (1.00) |
0.779 (1.00) |
0.601 (1.00) |
| 7q loss | 13 (23%) | 43 |
0.12 (1.00) |
0.854 (1.00) |
0.922 (1.00) |
0.825 (1.00) |
0.717 (1.00) |
0.222 (1.00) |
1 (1.00) |
0.531 (1.00) |
| 8p loss | 23 (41%) | 33 |
0.287 (1.00) |
0.981 (1.00) |
0.826 (1.00) |
0.744 (1.00) |
0.687 (1.00) |
0.512 (1.00) |
0.606 (1.00) |
0.578 (1.00) |
| 8q loss | 9 (16%) | 47 |
1 (1.00) |
0.758 (1.00) |
0.295 (1.00) |
0.714 (1.00) |
0.951 (1.00) |
0.757 (1.00) |
0.26 (1.00) |
0.666 (1.00) |
| 9p loss | 34 (61%) | 22 |
0.297 (1.00) |
0.00736 (1.00) |
0.674 (1.00) |
0.135 (1.00) |
0.863 (1.00) |
0.29 (1.00) |
1 (1.00) |
0.0594 (1.00) |
| 9q loss | 39 (70%) | 17 |
0.192 (1.00) |
0.00152 (0.933) |
0.494 (1.00) |
0.0378 (1.00) |
0.666 (1.00) |
0.119 (1.00) |
1 (1.00) |
0.156 (1.00) |
| 10p loss | 23 (41%) | 33 |
0.622 (1.00) |
0.0127 (1.00) |
0.0288 (1.00) |
0.183 (1.00) |
0.247 (1.00) |
0.789 (1.00) |
0.881 (1.00) |
0.895 (1.00) |
| 10q loss | 21 (38%) | 35 |
0.888 (1.00) |
0.3 (1.00) |
0.177 (1.00) |
0.171 (1.00) |
0.125 (1.00) |
0.472 (1.00) |
0.398 (1.00) |
0.741 (1.00) |
| 11p loss | 26 (46%) | 30 |
1 (1.00) |
0.00377 (1.00) |
0.377 (1.00) |
0.517 (1.00) |
0.269 (1.00) |
0.577 (1.00) |
0.509 (1.00) |
0.359 (1.00) |
| 11q loss | 24 (43%) | 32 |
0.625 (1.00) |
0.00769 (1.00) |
0.806 (1.00) |
0.895 (1.00) |
0.295 (1.00) |
0.592 (1.00) |
0.221 (1.00) |
0.184 (1.00) |
| 12p loss | 13 (23%) | 43 |
0.304 (1.00) |
0.275 (1.00) |
0.579 (1.00) |
0.733 (1.00) |
0.546 (1.00) |
0.582 (1.00) |
1 (1.00) |
0.216 (1.00) |
| 12q loss | 14 (25%) | 42 |
0.429 (1.00) |
0.88 (1.00) |
0.821 (1.00) |
0.917 (1.00) |
0.964 (1.00) |
0.907 (1.00) |
0.921 (1.00) |
0.605 (1.00) |
| 13q loss | 26 (46%) | 30 |
0.418 (1.00) |
0.00115 (0.707) |
0.056 (1.00) |
0.0279 (1.00) |
0.352 (1.00) |
0.123 (1.00) |
0.0397 (1.00) |
0.197 (1.00) |
| 14q loss | 27 (48%) | 29 |
0.943 (1.00) |
0.0926 (1.00) |
0.122 (1.00) |
0.123 (1.00) |
0.617 (1.00) |
0.897 (1.00) |
0.94 (1.00) |
0.936 (1.00) |
| 15q loss | 32 (57%) | 24 |
0.00608 (1.00) |
0.712 (1.00) |
0.929 (1.00) |
0.981 (1.00) |
0.93 (1.00) |
0.978 (1.00) |
1 (1.00) |
0.896 (1.00) |
| 16p loss | 32 (57%) | 24 |
0.241 (1.00) |
0.493 (1.00) |
0.343 (1.00) |
0.0999 (1.00) |
0.811 (1.00) |
0.912 (1.00) |
0.47 (1.00) |
0.893 (1.00) |
| 16q loss | 37 (66%) | 19 |
0.777 (1.00) |
0.793 (1.00) |
0.447 (1.00) |
0.091 (1.00) |
0.683 (1.00) |
0.923 (1.00) |
0.139 (1.00) |
0.856 (1.00) |
| 17p loss | 34 (61%) | 22 |
0.549 (1.00) |
0.286 (1.00) |
0.981 (1.00) |
0.757 (1.00) |
0.804 (1.00) |
0.89 (1.00) |
0.236 (1.00) |
0.89 (1.00) |
| 17q loss | 17 (30%) | 39 |
0.163 (1.00) |
0.36 (1.00) |
0.714 (1.00) |
0.381 (1.00) |
0.967 (1.00) |
0.212 (1.00) |
0.932 (1.00) |
0.277 (1.00) |
| 18p loss | 18 (32%) | 38 |
0.0323 (1.00) |
0.0169 (1.00) |
0.0556 (1.00) |
0.0916 (1.00) |
0.066 (1.00) |
0.0784 (1.00) |
0.0606 (1.00) |
0.0469 (1.00) |
| 18q loss | 20 (36%) | 36 |
0.119 (1.00) |
0.0703 (1.00) |
0.183 (1.00) |
0.119 (1.00) |
0.0124 (1.00) |
0.00577 (1.00) |
0.00594 (1.00) |
0.00227 (1.00) |
| 19p loss | 15 (27%) | 41 |
0.561 (1.00) |
0.461 (1.00) |
0.203 (1.00) |
0.357 (1.00) |
0.351 (1.00) |
0.715 (1.00) |
0.213 (1.00) |
0.704 (1.00) |
| 19q loss | 13 (23%) | 43 |
0.732 (1.00) |
0.153 (1.00) |
0.946 (1.00) |
0.615 (1.00) |
0.23 (1.00) |
0.872 (1.00) |
0.237 (1.00) |
1 (1.00) |
| 20p loss | 7 (12%) | 49 |
0.536 (1.00) |
0.205 (1.00) |
0.0838 (1.00) |
0.0732 (1.00) |
0.618 (1.00) |
0.693 (1.00) |
0.578 (1.00) |
0.693 (1.00) |
| 20q loss | 4 (7%) | 52 |
0.372 (1.00) |
0.604 (1.00) |
0.117 (1.00) |
0.473 (1.00) |
1 (1.00) |
0.886 (1.00) |
0.67 (1.00) |
0.789 (1.00) |
| 21q loss | 17 (30%) | 39 |
0.67 (1.00) |
0.179 (1.00) |
0.635 (1.00) |
0.746 (1.00) |
0.679 (1.00) |
0.972 (1.00) |
0.932 (1.00) |
0.943 (1.00) |
| 22q loss | 33 (59%) | 23 |
0.177 (1.00) |
0.971 (1.00) |
0.963 (1.00) |
0.902 (1.00) |
0.707 (1.00) |
0.29 (1.00) |
0.467 (1.00) |
0.759 (1.00) |
| xq loss | 19 (34%) | 37 |
0.778 (1.00) |
0.328 (1.00) |
0.324 (1.00) |
0.874 (1.00) |
0.528 (1.00) |
0.972 (1.00) |
0.583 (1.00) |
0.926 (1.00) |
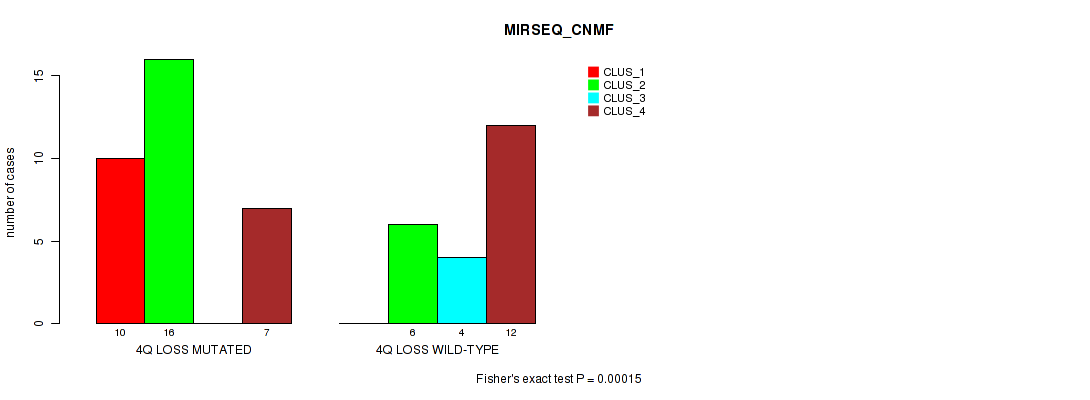
P value = 0.00015 (Fisher's exact test), Q value = 0.092
Table S1. Gene #45: '4q loss' versus Molecular Subtype #5: 'MIRSEQ_CNMF'
| nPatients | CLUS_1 | CLUS_2 | CLUS_3 | CLUS_4 |
|---|---|---|---|---|
| ALL | 10 | 22 | 4 | 19 |
| 4Q LOSS MUTATED | 10 | 16 | 0 | 7 |
| 4Q LOSS WILD-TYPE | 0 | 6 | 4 | 12 |
Figure S1. Get High-res Image Gene #45: '4q loss' versus Molecular Subtype #5: 'MIRSEQ_CNMF'
-
Copy number data file = transformed.cor.cli.txt
-
Molecular subtypes file = UCS-TP.transferedmergedcluster.txt
-
Number of patients = 56
-
Number of significantly arm-level cnvs = 77
-
Number of molecular subtypes = 8
-
Exclude genes that fewer than K tumors have mutations, K = 3
For binary or multi-class clinical features (nominal or ordinal), two-tailed Fisher's exact tests (Fisher 1922) were used to estimate the P values using the 'fisher.test' function in R
For multiple hypothesis correction, Q value is the False Discovery Rate (FDR) analogue of the P value (Benjamini and Hochberg 1995), defined as the minimum FDR at which the test may be called significant. We used the 'Benjamini and Hochberg' method of 'p.adjust' function in R to convert P values into Q values.
In addition to the links below, the full results of the analysis summarized in this report can also be downloaded programmatically using firehose_get, or interactively from either the Broad GDAC website or TCGA Data Coordination Center Portal.