This pipeline computes the correlation between significantly recurrent gene mutations and selected clinical features.
Testing the association between mutation status of 119 genes and 7 clinical features across 62 patients, 2 significant findings detected with Q value < 0.25.
-
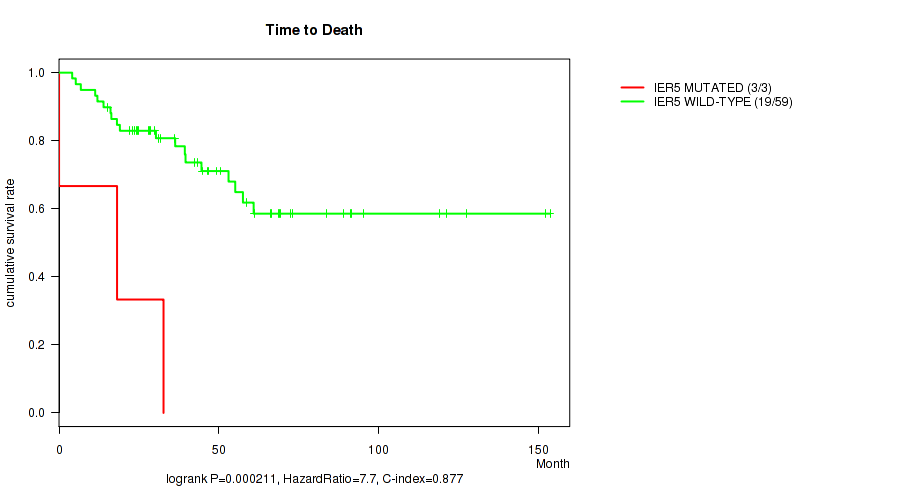
IER5 mutation correlated to 'Time to Death'.
-
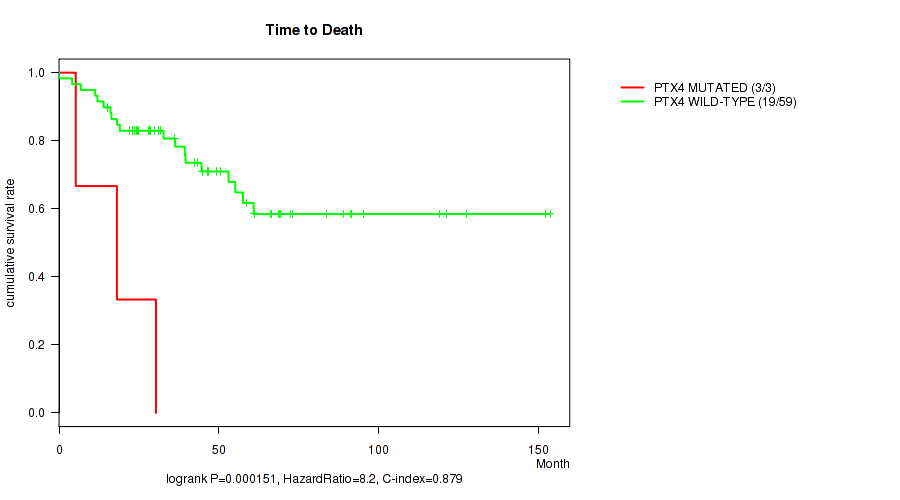
PTX4 mutation correlated to 'Time to Death'.
Table 1. Get Full Table Overview of the association between mutation status of 119 genes and 7 clinical features. Shown in the table are P values (Q values). Thresholded by Q value < 0.25, 2 significant findings detected.
|
Clinical Features |
Time to Death |
YEARS TO BIRTH |
NEOPLASM DISEASESTAGE |
PATHOLOGY T STAGE |
PATHOLOGY N STAGE |
GENDER | ETHNICITY | ||
| nMutated (%) | nWild-Type | logrank test | Wilcoxon-test | Fisher's exact test | Fisher's exact test | Fisher's exact test | Fisher's exact test | Fisher's exact test | |
| IER5 | 3 (5%) | 59 |
0.000211 (0.0877) |
0.588 (1.00) |
0.088 (1.00) |
0.0336 (0.956) |
0.275 (1.00) |
0.546 (1.00) |
1 (1.00) |
| PTX4 | 3 (5%) | 59 |
0.000151 (0.0877) |
0.301 (1.00) |
0.0103 (0.858) |
0.0341 (0.956) |
1 (1.00) |
1 (1.00) |
1 (1.00) |
| ZFPM1 | 24 (39%) | 38 |
0.202 (1.00) |
0.534 (1.00) |
0.319 (1.00) |
0.974 (1.00) |
0.666 (1.00) |
1 (1.00) |
0.677 (1.00) |
| LACTB | 19 (31%) | 43 |
0.782 (1.00) |
0.945 (1.00) |
0.194 (1.00) |
0.108 (1.00) |
1 (1.00) |
0.568 (1.00) |
0.656 (1.00) |
| CCDC102A | 17 (27%) | 45 |
0.174 (1.00) |
0.477 (1.00) |
0.146 (1.00) |
0.208 (1.00) |
0.17 (1.00) |
1 (1.00) |
1 (1.00) |
| ZNF517 | 13 (21%) | 49 |
0.992 (1.00) |
0.0421 (0.956) |
0.736 (1.00) |
0.75 (1.00) |
1 (1.00) |
0.756 (1.00) |
0.306 (1.00) |
| MAL2 | 11 (18%) | 51 |
0.753 (1.00) |
0.0708 (1.00) |
0.452 (1.00) |
0.0453 (0.956) |
0.302 (1.00) |
0.0789 (1.00) |
0.3 (1.00) |
| CLDN23 | 10 (16%) | 52 |
0.934 (1.00) |
0.716 (1.00) |
0.623 (1.00) |
0.755 (1.00) |
0.259 (1.00) |
0.472 (1.00) |
0.559 (1.00) |
| TOR3A | 12 (19%) | 50 |
0.568 (1.00) |
0.533 (1.00) |
0.187 (1.00) |
0.137 (1.00) |
0.581 (1.00) |
0.74 (1.00) |
1 (1.00) |
| USP42 | 15 (24%) | 47 |
0.75 (1.00) |
0.681 (1.00) |
0.528 (1.00) |
0.791 (1.00) |
0.634 (1.00) |
0.541 (1.00) |
1 (1.00) |
| TP53 | 12 (19%) | 50 |
0.0415 (0.956) |
0.782 (1.00) |
0.0958 (1.00) |
0.266 (1.00) |
1 (1.00) |
0.74 (1.00) |
0.58 (1.00) |
| APOE | 7 (11%) | 55 |
0.879 (1.00) |
0.133 (1.00) |
1 (1.00) |
0.919 (1.00) |
1 (1.00) |
0.0861 (1.00) |
1 (1.00) |
| ZAR1 | 11 (18%) | 51 |
0.23 (1.00) |
0.672 (1.00) |
0.655 (1.00) |
0.33 (1.00) |
0.302 (1.00) |
0.0789 (1.00) |
0.559 (1.00) |
| ASPDH | 8 (13%) | 54 |
0.333 (1.00) |
0.983 (1.00) |
0.00299 (0.83) |
0.31 (1.00) |
0.105 (1.00) |
0.7 (1.00) |
1 (1.00) |
| KCNK17 | 9 (15%) | 53 |
0.281 (1.00) |
0.719 (1.00) |
0.852 (1.00) |
0.429 (1.00) |
0.585 (1.00) |
0.709 (1.00) |
0.18 (1.00) |
| LZTR1 | 6 (10%) | 56 |
0.48 (1.00) |
0.46 (1.00) |
1 (1.00) |
1 (1.00) |
0.484 (1.00) |
1 (1.00) |
1 (1.00) |
| ERCC2 | 10 (16%) | 52 |
0.841 (1.00) |
0.833 (1.00) |
0.601 (1.00) |
0.636 (1.00) |
0.259 (1.00) |
1 (1.00) |
0.511 (1.00) |
| RINL | 8 (13%) | 54 |
0.359 (1.00) |
0.622 (1.00) |
0.617 (1.00) |
0.515 (1.00) |
1 (1.00) |
0.7 (1.00) |
0.268 (1.00) |
| SYT8 | 8 (13%) | 54 |
0.143 (1.00) |
0.407 (1.00) |
0.23 (1.00) |
0.693 (1.00) |
0.585 (1.00) |
1 (1.00) |
0.559 (1.00) |
| LRIG1 | 16 (26%) | 46 |
0.792 (1.00) |
0.459 (1.00) |
0.913 (1.00) |
0.745 (1.00) |
0.159 (1.00) |
0.375 (1.00) |
0.644 (1.00) |
| C1ORF106 | 9 (15%) | 53 |
0.148 (1.00) |
0.384 (1.00) |
0.515 (1.00) |
0.306 (1.00) |
0.218 (1.00) |
0.14 (1.00) |
0.559 (1.00) |
| GPRIN2 | 8 (13%) | 54 |
0.567 (1.00) |
0.401 (1.00) |
0.944 (1.00) |
0.58 (1.00) |
0.585 (1.00) |
1 (1.00) |
1 (1.00) |
| CTNNB1 | 7 (11%) | 55 |
0.285 (1.00) |
0.266 (1.00) |
0.684 (1.00) |
0.934 (1.00) |
0.14 (1.00) |
0.0443 (0.956) |
0.559 (1.00) |
| C16ORF3 | 5 (8%) | 57 |
0.434 (1.00) |
0.756 (1.00) |
0.238 (1.00) |
0.561 (1.00) |
0.421 (1.00) |
0.151 (1.00) |
1 (1.00) |
| CCDC105 | 6 (10%) | 56 |
0.444 (1.00) |
0.432 (1.00) |
0.281 (1.00) |
0.103 (1.00) |
0.484 (1.00) |
0.0808 (1.00) |
0.511 (1.00) |
| RGS9BP | 8 (13%) | 54 |
0.439 (1.00) |
0.983 (1.00) |
0.938 (1.00) |
0.0347 (0.956) |
0.541 (1.00) |
0.438 (1.00) |
0.511 (1.00) |
| HHIPL1 | 6 (10%) | 56 |
0.779 (1.00) |
0.6 (1.00) |
0.73 (1.00) |
0.639 (1.00) |
0.484 (1.00) |
0.657 (1.00) |
1 (1.00) |
| C10ORF95 | 6 (10%) | 56 |
0.946 (1.00) |
0.536 (1.00) |
0.358 (1.00) |
0.707 (1.00) |
1 (1.00) |
1 (1.00) |
1 (1.00) |
| TSC22D2 | 8 (13%) | 54 |
0.0252 (0.956) |
0.629 (1.00) |
0.275 (1.00) |
0.112 (1.00) |
1 (1.00) |
0.7 (1.00) |
0.511 (1.00) |
| NOXA1 | 5 (8%) | 57 |
0.655 (1.00) |
0.99 (1.00) |
0.897 (1.00) |
0.797 (1.00) |
0.421 (1.00) |
0.151 (1.00) |
1 (1.00) |
| THEM4 | 5 (8%) | 57 |
0.426 (1.00) |
0.313 (1.00) |
0.479 (1.00) |
0.387 (1.00) |
0.351 (1.00) |
0.647 (1.00) |
1 (1.00) |
| ATXN1 | 10 (16%) | 52 |
0.717 (1.00) |
0.263 (1.00) |
0.749 (1.00) |
0.433 (1.00) |
1 (1.00) |
0.082 (1.00) |
1 (1.00) |
| PLIN5 | 5 (8%) | 57 |
0.405 (1.00) |
0.587 (1.00) |
1 (1.00) |
0.894 (1.00) |
0.421 (1.00) |
0.647 (1.00) |
0.374 (1.00) |
| OPRD1 | 12 (19%) | 50 |
0.926 (1.00) |
0.139 (1.00) |
1 (1.00) |
1 (1.00) |
1 (1.00) |
0.512 (1.00) |
1 (1.00) |
| KRTAP4-5 | 5 (8%) | 57 |
0.134 (1.00) |
0.477 (1.00) |
0.573 (1.00) |
0.311 (1.00) |
1 (1.00) |
0.647 (1.00) |
1 (1.00) |
| C19ORF10 | 7 (11%) | 55 |
0.932 (1.00) |
0.533 (1.00) |
0.144 (1.00) |
0.476 (1.00) |
0.541 (1.00) |
0.405 (1.00) |
1 (1.00) |
| AATK | 6 (10%) | 56 |
0.336 (1.00) |
0.034 (0.956) |
0.681 (1.00) |
0.709 (1.00) |
0.484 (1.00) |
0.409 (1.00) |
1 (1.00) |
| SARM1 | 6 (10%) | 56 |
0.224 (1.00) |
0.739 (1.00) |
0.632 (1.00) |
0.234 (1.00) |
1 (1.00) |
0.657 (1.00) |
0.101 (1.00) |
| TRIOBP | 10 (16%) | 52 |
0.796 (1.00) |
0.767 (1.00) |
0.953 (1.00) |
1 (1.00) |
0.0524 (0.981) |
0.082 (1.00) |
1 (1.00) |
| ZNF598 | 12 (19%) | 50 |
0.345 (1.00) |
0.021 (0.956) |
0.513 (1.00) |
0.866 (1.00) |
0.581 (1.00) |
0.0186 (0.956) |
0.58 (1.00) |
| WDR34 | 5 (8%) | 57 |
0.539 (1.00) |
0.679 (1.00) |
1 (1.00) |
0.735 (1.00) |
1 (1.00) |
0.0493 (0.956) |
1 (1.00) |
| ZNF628 | 7 (11%) | 55 |
0.0281 (0.956) |
0.755 (1.00) |
0.434 (1.00) |
0.415 (1.00) |
1 (1.00) |
1 (1.00) |
0.511 (1.00) |
| BTBD11 | 6 (10%) | 56 |
0.707 (1.00) |
0.868 (1.00) |
0.0369 (0.956) |
0.143 (1.00) |
0.484 (1.00) |
0.409 (1.00) |
1 (1.00) |
| IRX3 | 5 (8%) | 57 |
0.906 (1.00) |
0.313 (1.00) |
0.236 (1.00) |
0.505 (1.00) |
1 (1.00) |
0.647 (1.00) |
1 (1.00) |
| FPGS | 5 (8%) | 57 |
0.113 (1.00) |
0.319 (1.00) |
0.237 (1.00) |
0.56 (1.00) |
0.421 (1.00) |
1 (1.00) |
1 (1.00) |
| MEN1 | 5 (8%) | 57 |
0.0772 (1.00) |
0.688 (1.00) |
0.0332 (0.956) |
0.153 (1.00) |
0.351 (1.00) |
1 (1.00) |
0.511 (1.00) |
| BHLHE22 | 5 (8%) | 57 |
0.198 (1.00) |
0.928 (1.00) |
0.287 (1.00) |
0.895 (1.00) |
0.0735 (1.00) |
0.647 (1.00) |
0.18 (1.00) |
| DMKN | 3 (5%) | 59 |
0.199 (1.00) |
0.384 (1.00) |
1 (1.00) |
1 (1.00) |
1 (1.00) |
||
| OBSCN | 18 (29%) | 44 |
0.797 (1.00) |
0.0453 (0.956) |
0.436 (1.00) |
0.838 (1.00) |
0.338 (1.00) |
0.561 (1.00) |
1 (1.00) |
| PANK2 | 5 (8%) | 57 |
0.00733 (0.858) |
0.166 (1.00) |
0.897 (1.00) |
0.621 (1.00) |
1 (1.00) |
0.0493 (0.956) |
1 (1.00) |
| RREB1 | 5 (8%) | 57 |
0.824 (1.00) |
0.938 (1.00) |
0.634 (1.00) |
0.235 (1.00) |
0.0735 (1.00) |
1 (1.00) |
0.374 (1.00) |
| RNF149 | 4 (6%) | 58 |
0.189 (1.00) |
0.0709 (1.00) |
0.23 (1.00) |
0.387 (1.00) |
1 (1.00) |
1 (1.00) |
1 (1.00) |
| GLTPD2 | 6 (10%) | 56 |
0.389 (1.00) |
0.1 (1.00) |
0.634 (1.00) |
0.619 (1.00) |
1 (1.00) |
0.657 (1.00) |
0.206 (1.00) |
| SNED1 | 5 (8%) | 57 |
0.353 (1.00) |
0.737 (1.00) |
0.129 (1.00) |
0.162 (1.00) |
0.0735 (1.00) |
0.647 (1.00) |
1 (1.00) |
| TPO | 12 (19%) | 50 |
0.764 (1.00) |
0.852 (1.00) |
0.865 (1.00) |
0.952 (1.00) |
0.0879 (1.00) |
1 (1.00) |
1 (1.00) |
| PTPLA | 4 (6%) | 58 |
0.681 (1.00) |
0.72 (1.00) |
0.607 (1.00) |
0.641 (1.00) |
1 (1.00) |
0.61 (1.00) |
0.511 (1.00) |
| PRSS27 | 3 (5%) | 59 |
0.235 (1.00) |
0.412 (1.00) |
0.468 (1.00) |
0.517 (1.00) |
1 (1.00) |
0.285 (1.00) |
0.0374 (0.956) |
| CD320 | 4 (6%) | 58 |
0.364 (1.00) |
0.282 (1.00) |
0.152 (1.00) |
0.274 (1.00) |
1 (1.00) |
1 (1.00) |
0.101 (1.00) |
| SEMA5B | 8 (13%) | 54 |
0.778 (1.00) |
0.644 (1.00) |
0.852 (1.00) |
1 (1.00) |
1 (1.00) |
0.438 (1.00) |
1 (1.00) |
| CCDC150 | 4 (6%) | 58 |
0.0832 (1.00) |
0.456 (1.00) |
0.0337 (0.956) |
0.105 (1.00) |
0.351 (1.00) |
1 (1.00) |
0.101 (1.00) |
| TAF5 | 4 (6%) | 58 |
0.382 (1.00) |
0.596 (1.00) |
0.32 (1.00) |
0.844 (1.00) |
0.351 (1.00) |
1 (1.00) |
0.374 (1.00) |
| GARS | 19 (31%) | 43 |
0.0285 (0.956) |
0.225 (1.00) |
0.00878 (0.858) |
0.0066 (0.858) |
0.658 (1.00) |
1 (1.00) |
0.644 (1.00) |
| MUC5B | 22 (35%) | 40 |
0.958 (1.00) |
0.581 (1.00) |
0.734 (1.00) |
0.803 (1.00) |
0.412 (1.00) |
1 (1.00) |
1 (1.00) |
| KIAA1984 | 4 (6%) | 58 |
0.861 (1.00) |
0.657 (1.00) |
0.833 (1.00) |
0.517 (1.00) |
1 (1.00) |
0.124 (1.00) |
0.511 (1.00) |
| SRPX | 3 (5%) | 59 |
0.928 (1.00) |
0.922 (1.00) |
0.833 (1.00) |
0.624 (1.00) |
0.275 (1.00) |
0.546 (1.00) |
0.511 (1.00) |
| TNIP2 | 5 (8%) | 57 |
0.555 (1.00) |
0.605 (1.00) |
0.0865 (1.00) |
0.641 (1.00) |
0.0463 (0.956) |
1 (1.00) |
1 (1.00) |
| IDUA | 8 (13%) | 54 |
0.145 (1.00) |
0.204 (1.00) |
0.109 (1.00) |
0.232 (1.00) |
1 (1.00) |
1 (1.00) |
1 (1.00) |
| RNF39 | 5 (8%) | 57 |
0.738 (1.00) |
0.776 (1.00) |
0.322 (1.00) |
0.84 (1.00) |
0.351 (1.00) |
1 (1.00) |
0.374 (1.00) |
| PABPC1 | 4 (6%) | 58 |
0.646 (1.00) |
0.398 (1.00) |
1 (1.00) |
1 (1.00) |
0.351 (1.00) |
0.61 (1.00) |
0.559 (1.00) |
| SCRT1 | 3 (5%) | 59 |
0.0357 (0.956) |
0.225 (1.00) |
0.834 (1.00) |
0.332 (1.00) |
0.275 (1.00) |
0.546 (1.00) |
1 (1.00) |
| MAP1S | 5 (8%) | 57 |
0.688 (1.00) |
0.401 (1.00) |
0.388 (1.00) |
1 (1.00) |
0.421 (1.00) |
0.337 (1.00) |
1 (1.00) |
| NF1 | 7 (11%) | 55 |
0.297 (1.00) |
0.681 (1.00) |
1 (1.00) |
1 (1.00) |
1 (1.00) |
0.00642 (0.858) |
0.511 (1.00) |
| AKAP2 | 4 (6%) | 58 |
0.73 (1.00) |
0.586 (1.00) |
0.32 (1.00) |
0.737 (1.00) |
1 (1.00) |
0.124 (1.00) |
|
| NOTCH2 | 5 (8%) | 57 |
0.474 (1.00) |
0.766 (1.00) |
0.686 (1.00) |
0.465 (1.00) |
0.351 (1.00) |
1 (1.00) |
1 (1.00) |
| FANK1 | 4 (6%) | 58 |
0.696 (1.00) |
0.218 (1.00) |
0.062 (1.00) |
0.0853 (1.00) |
0.351 (1.00) |
0.287 (1.00) |
0.559 (1.00) |
| NEFH | 6 (10%) | 56 |
0.21 (1.00) |
0.536 (1.00) |
1 (1.00) |
0.369 (1.00) |
0.484 (1.00) |
1 (1.00) |
0.18 (1.00) |
| NPTX1 | 3 (5%) | 59 |
0.979 (1.00) |
0.896 (1.00) |
0.245 (1.00) |
0.244 (1.00) |
1 (1.00) |
0.285 (1.00) |
1 (1.00) |
| KBTBD13 | 9 (15%) | 53 |
0.427 (1.00) |
0.497 (1.00) |
0.0883 (1.00) |
0.112 (1.00) |
0.218 (1.00) |
0.14 (1.00) |
1 (1.00) |
| RASIP1 | 6 (10%) | 56 |
0.106 (1.00) |
0.99 (1.00) |
0.638 (1.00) |
0.479 (1.00) |
0.484 (1.00) |
0.409 (1.00) |
1 (1.00) |
| AR | 4 (6%) | 58 |
0.141 (1.00) |
0.785 (1.00) |
0.319 (1.00) |
0.155 (1.00) |
0.351 (1.00) |
1 (1.00) |
1 (1.00) |
| KNDC1 | 9 (15%) | 53 |
0.169 (1.00) |
0.912 (1.00) |
0.129 (1.00) |
0.068 (1.00) |
1 (1.00) |
0.14 (1.00) |
1 (1.00) |
| SEZ6L2 | 8 (13%) | 54 |
0.577 (1.00) |
0.883 (1.00) |
0.851 (1.00) |
0.615 (1.00) |
1 (1.00) |
1 (1.00) |
0.306 (1.00) |
| VARS | 6 (10%) | 56 |
0.967 (1.00) |
0.84 (1.00) |
0.316 (1.00) |
0.233 (1.00) |
1 (1.00) |
0.174 (1.00) |
0.0211 (0.956) |
| NMU | 5 (8%) | 57 |
0.45 (1.00) |
0.272 (1.00) |
1 (1.00) |
0.896 (1.00) |
0.421 (1.00) |
0.151 (1.00) |
0.511 (1.00) |
| TMEM189 | 3 (5%) | 59 |
0.207 (1.00) |
0.441 (1.00) |
1 (1.00) |
1 (1.00) |
0.374 (1.00) |
||
| ADAD2 | 4 (6%) | 58 |
0.985 (1.00) |
0.626 (1.00) |
0.836 (1.00) |
1 (1.00) |
1 (1.00) |
0.124 (1.00) |
1 (1.00) |
| PLEC | 13 (21%) | 49 |
0.784 (1.00) |
0.568 (1.00) |
0.82 (1.00) |
0.794 (1.00) |
1 (1.00) |
0.112 (1.00) |
0.644 (1.00) |
| RGMB | 6 (10%) | 56 |
0.823 (1.00) |
0.73 (1.00) |
1 (1.00) |
0.707 (1.00) |
0.484 (1.00) |
1 (1.00) |
0.306 (1.00) |
| CLIC6 | 5 (8%) | 57 |
0.338 (1.00) |
0.345 (1.00) |
0.472 (1.00) |
0.707 (1.00) |
1 (1.00) |
0.647 (1.00) |
1 (1.00) |
| ZNF814 | 3 (5%) | 59 |
0.196 (1.00) |
0.743 (1.00) |
0.0256 (0.956) |
0.0636 (1.00) |
1 (1.00) |
1 (1.00) |
1 (1.00) |
| DSPP | 9 (15%) | 53 |
0.933 (1.00) |
0.412 (1.00) |
0.691 (1.00) |
1 (1.00) |
0.218 (1.00) |
0.471 (1.00) |
1 (1.00) |
| AMDHD1 | 10 (16%) | 52 |
0.547 (1.00) |
0.0434 (0.956) |
0.825 (1.00) |
1 (1.00) |
0.578 (1.00) |
0.307 (1.00) |
0.511 (1.00) |
| CRIPAK | 10 (16%) | 52 |
0.648 (1.00) |
0.116 (1.00) |
0.0963 (1.00) |
0.325 (1.00) |
0.577 (1.00) |
1 (1.00) |
1 (1.00) |
| NOM1 | 6 (10%) | 56 |
0.923 (1.00) |
0.625 (1.00) |
0.208 (1.00) |
0.258 (1.00) |
1 (1.00) |
1 (1.00) |
1 (1.00) |
| MAP7 | 3 (5%) | 59 |
0.947 (1.00) |
0.73 (1.00) |
1 (1.00) |
1 (1.00) |
1 (1.00) |
1 (1.00) |
1 (1.00) |
| LRP11 | 6 (10%) | 56 |
0.649 (1.00) |
0.497 (1.00) |
0.754 (1.00) |
1 (1.00) |
1 (1.00) |
0.657 (1.00) |
0.559 (1.00) |
| PDCD6 | 3 (5%) | 59 |
0.929 (1.00) |
0.0879 (1.00) |
0.0103 (0.858) |
0.00482 (0.858) |
0.275 (1.00) |
1 (1.00) |
0.206 (1.00) |
| SHOX2 | 3 (5%) | 59 |
0.224 (1.00) |
0.896 (1.00) |
1 (1.00) |
0.784 (1.00) |
0.275 (1.00) |
1 (1.00) |
1 (1.00) |
| UQCRFS1 | 5 (8%) | 57 |
0.199 (1.00) |
0.0493 (0.956) |
0.0361 (0.956) |
0.0207 (0.956) |
0.421 (1.00) |
1 (1.00) |
0.18 (1.00) |
| CTBP2 | 3 (5%) | 59 |
0.918 (1.00) |
0.244 (1.00) |
0.388 (1.00) |
0.16 (1.00) |
1 (1.00) |
1 (1.00) |
0.511 (1.00) |
| PRKAR1A | 6 (10%) | 56 |
0.784 (1.00) |
0.83 (1.00) |
0.0608 (1.00) |
0.0624 (1.00) |
0.484 (1.00) |
0.0808 (1.00) |
0.374 (1.00) |
| JMJD4 | 3 (5%) | 59 |
0.858 (1.00) |
0.844 (1.00) |
1 (1.00) |
0.626 (1.00) |
1 (1.00) |
0.285 (1.00) |
0.374 (1.00) |
| HSD17B1 | 4 (6%) | 58 |
0.624 (1.00) |
0.596 (1.00) |
0.186 (1.00) |
0.229 (1.00) |
1 (1.00) |
1 (1.00) |
0.374 (1.00) |
| COQ2 | 5 (8%) | 57 |
0.884 (1.00) |
0.124 (1.00) |
0.47 (1.00) |
0.705 (1.00) |
1 (1.00) |
0.647 (1.00) |
1 (1.00) |
| FEZ2 | 3 (5%) | 59 |
0.743 (1.00) |
0.491 (1.00) |
0.833 (1.00) |
0.784 (1.00) |
0.275 (1.00) |
1 (1.00) |
1 (1.00) |
| DLEU7 | 3 (5%) | 59 |
0.398 (1.00) |
0.611 (1.00) |
0.834 (1.00) |
1 (1.00) |
1 (1.00) |
1 (1.00) |
1 (1.00) |
| RNF135 | 3 (5%) | 59 |
0.224 (1.00) |
0.831 (1.00) |
0.576 (1.00) |
0.784 (1.00) |
1 (1.00) |
1 (1.00) |
0.511 (1.00) |
| SPIRE2 | 3 (5%) | 59 |
0.945 (1.00) |
0.0637 (1.00) |
0.388 (1.00) |
0.16 (1.00) |
1 (1.00) |
0.546 (1.00) |
0.206 (1.00) |
| KRTAP5-5 | 3 (5%) | 59 |
0.324 (1.00) |
0.0661 (1.00) |
0.833 (1.00) |
1 (1.00) |
1 (1.00) |
0.285 (1.00) |
1 (1.00) |
| SGK223 | 3 (5%) | 59 |
0.737 (1.00) |
0.46 (1.00) |
0.469 (1.00) |
0.517 (1.00) |
1 (1.00) |
0.546 (1.00) |
0.374 (1.00) |
| C9ORF66 | 5 (8%) | 57 |
0.233 (1.00) |
0.359 (1.00) |
0.426 (1.00) |
0.561 (1.00) |
1 (1.00) |
0.337 (1.00) |
0.0374 (0.956) |
| AQP7 | 3 (5%) | 59 |
0.737 (1.00) |
0.0435 (0.956) |
0.574 (1.00) |
0.784 (1.00) |
1 (1.00) |
1 (1.00) |
1 (1.00) |
| ADAMTS7 | 4 (6%) | 58 |
0.169 (1.00) |
0.129 (1.00) |
0.23 (1.00) |
0.385 (1.00) |
1 (1.00) |
1 (1.00) |
1 (1.00) |
| PCDHB13 | 5 (8%) | 57 |
0.696 (1.00) |
0.127 (1.00) |
0.347 (1.00) |
0.206 (1.00) |
1 (1.00) |
1 (1.00) |
0.101 (1.00) |
| CSGALNACT2 | 3 (5%) | 59 |
0.866 (1.00) |
0.706 (1.00) |
0.831 (1.00) |
1 (1.00) |
1 (1.00) |
0.546 (1.00) |
1 (1.00) |
| HLA-A | 3 (5%) | 59 |
0.321 (1.00) |
0.225 (1.00) |
1 (1.00) |
0.625 (1.00) |
1 (1.00) |
0.285 (1.00) |
0.206 (1.00) |
| MTFMT | 3 (5%) | 59 |
0.893 (1.00) |
0.577 (1.00) |
0.833 (1.00) |
1 (1.00) |
1 (1.00) |
0.0407 (0.956) |
1 (1.00) |
| NLRP5 | 4 (6%) | 58 |
0.97 (1.00) |
0.053 (0.981) |
0.478 (1.00) |
0.189 (1.00) |
1 (1.00) |
1 (1.00) |
1 (1.00) |
| KCNJ11 | 4 (6%) | 58 |
0.485 (1.00) |
0.414 (1.00) |
0.0346 (0.956) |
0.736 (1.00) |
0.0463 (0.956) |
0.61 (1.00) |
1 (1.00) |
P value = 0.000211 (logrank test), Q value = 0.088
Table S1. Gene #82: 'IER5 MUTATION STATUS' versus Clinical Feature #1: 'Time to Death'
| nPatients | nDeath | Duration Range (Median), Month | |
|---|---|---|---|
| ALL | 62 | 22 | 0.0 - 153.6 (41.0) |
| IER5 MUTATED | 3 | 3 | 0.0 - 32.7 (18.1) |
| IER5 WILD-TYPE | 59 | 19 | 4.1 - 153.6 (43.3) |
Figure S1. Get High-res Image Gene #82: 'IER5 MUTATION STATUS' versus Clinical Feature #1: 'Time to Death'
P value = 0.000151 (logrank test), Q value = 0.088
Table S2. Gene #95: 'PTX4 MUTATION STATUS' versus Clinical Feature #1: 'Time to Death'
| nPatients | nDeath | Duration Range (Median), Month | |
|---|---|---|---|
| ALL | 62 | 22 | 0.0 - 153.6 (41.0) |
| PTX4 MUTATED | 3 | 3 | 5.2 - 30.3 (18.1) |
| PTX4 WILD-TYPE | 59 | 19 | 0.0 - 153.6 (43.3) |
Figure S2. Get High-res Image Gene #95: 'PTX4 MUTATION STATUS' versus Clinical Feature #1: 'Time to Death'
-
Mutation data file = sample_sig_gene_table.txt from Mutsig_2CV pipeline
-
Processed Mutation data file = /xchip/cga/gdac-prod/tcga-gdac/jobResults/GDAC_Correlate_Genomic_Events_Preprocess/ACC-TP/15172905/transformed.cor.cli.txt
-
Clinical data file = /xchip/cga/gdac-prod/tcga-gdac/jobResults/Append_Data/ACC-TP/15074660/ACC-TP.merged_data.txt
-
Number of patients = 62
-
Number of significantly mutated genes = 119
-
Number of selected clinical features = 7
-
Exclude genes that fewer than K tumors have mutations, K = 3
For survival clinical features, the Kaplan-Meier survival curves of tumors with and without gene mutations were plotted and the statistical significance P values were estimated by logrank test (Bland and Altman 2004) using the 'survdiff' function in R
For binary or multi-class clinical features (nominal or ordinal), two-tailed Fisher's exact tests (Fisher 1922) were used to estimate the P values using the 'fisher.test' function in R
For multiple hypothesis correction, Q value is the False Discovery Rate (FDR) analogue of the P value (Benjamini and Hochberg 1995), defined as the minimum FDR at which the test may be called significant. We used the 'Benjamini and Hochberg' method of 'p.adjust' function in R to convert P values into Q values.
In addition to the links below, the full results of the analysis summarized in this report can also be downloaded programmatically using firehose_get, or interactively from either the Broad GDAC website or TCGA Data Coordination Center Portal.